SHORT-TERM TRADE IN BANKNIFTY F&0SHORT-TERM TRADE IN BANKNIFTY
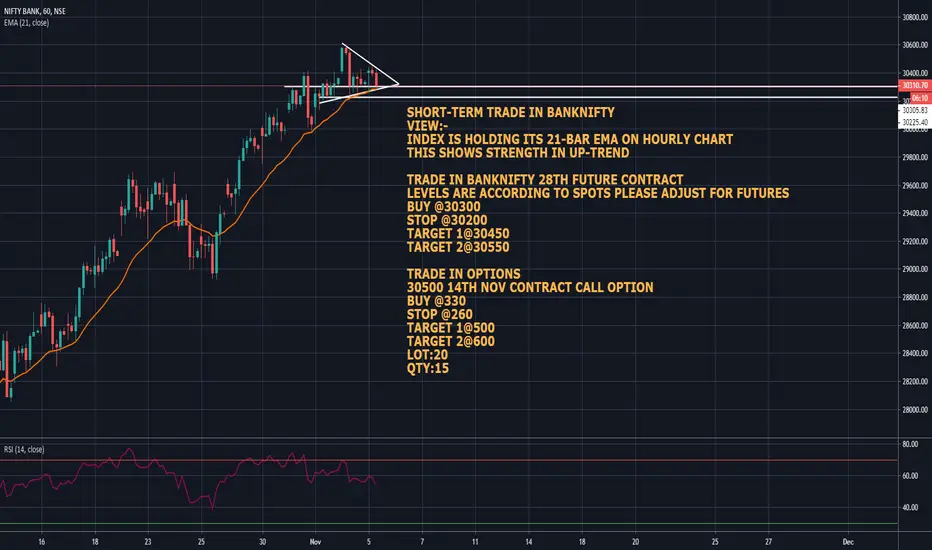
VIEW:-
INDEX IS HOLDING ITS 21-BAR EMA ON HOURLY CHART
THIS SHOWS STRENGTH IN UP-TREND
TRADE IN BANKNIFTY 28TH FUTURE CONTRACT
LEVELS ARE ACCORDING TO SPOTS PLEASE ADJUST FOR FUTURES
BUY @30300
STOP @30200
TARGET 1@30450
TARGET 2@30550
TRADE IN OPTIONS
30500 14TH NOV CONTRACT CALL OPTION
BUY @330
STOP @260
TARGET 1@500
TARGET 2@600
LOT:20
QTY:15
Exponential Moving Average (EMA)
Nifty weekly charts have something to say.Giving a look at the Nifty weekly chart. The index is moving into gap zone plus RSI is near 60 levels. Though the daily charts don’t display any caution yet, but 60 levels on weekly’s are pressure points. The week is still on, so the analysis will make sense only after the weekly close by Friday. But the exuberance is building up, emotion outburst are generally not good. Waiting for lower time-frames to show some signs.
REC , Daily ,LongAfter a rising window , price consolidated for a couple of weeks , and then a nice breakout , which coincided with the down sloping trendline and the 50 EMA. Longs may be initiated for a swing target of 180 with a stoploss around 153.Also the price has crossed its 200 EMA , though closed below it.
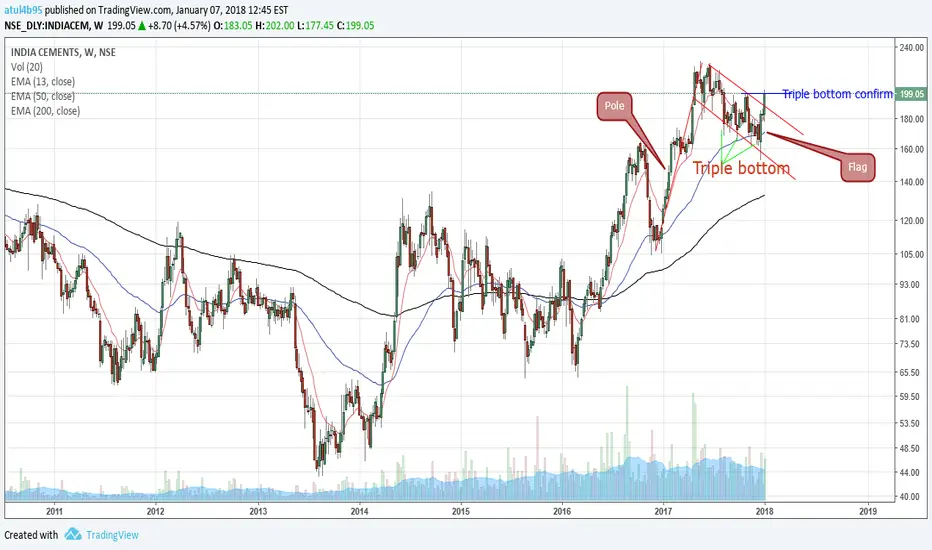
India Cements ,Weekly , Confluence of factors suggesting LongNSE:INDIACEM On weekly charts ,there is a breakout from flag pattern and triple bottom has been confirmed.
the pullback of the flag coincides with 50% fib retrace.
Long positions may be initiated at a throwback to the flag or after consolidation breakout on lower time frame .
Its trending above its 200,62 and 13 period EMA and after bullish crossover of 13,62 EMA has taken support on 62 EMA.
HDFC approaching 1800HDFC has been in a nice long term uptrend trending above 200 EMA, and is just given 13,62 EMA Crossover.
Also the price has broken up from a consolidation zone and confirmed a double bottom.
Long position may be initiated above 1737 with a target of 1800 and SL 1725
HLong