AUROPHARMA Ascending Triangle Breakout📊 Aurobindo Pharma Ltd.: Daily Technical Snapshot – Ascending Triangle Breakout
📊 STWP Technical Analysis
________________________________________
MARKET STRUCTURE SNAPSHOT | NSE: AUROPHARMA | DAILY
Closing Price: 1,658.00 (+69.10 | +4.35%)
Core Trend: Uptrend
Market State: Ascending Triangle Breakout
Price Structure: Price has broken above the horizontal resistance zone of an Ascending Triangle, supported by a rising trendline, strong bullish candle and above-average volume. The breakout indicates an attempt to move into a higher trading range.
________________________________________
OPERATIONAL PRICE GRID & KEY REFERENCE LEVELS
Model Reference Level: 1,662.40
Hard Invalidation Level: 1,564.80
Structural Risk: 97.60 (5.87%)
Resistance Levels: R1 1,686.97 | R2 1,715.93 | R3 1,769.47
Support Levels: S1 1,604.47 | S2 1,550.93 | S3 1,521.97
Range Structure: Low 1,416.10 | High 1,769.47
Higher Timeframe Observation Zones: 1,716 | 1,769 | 1,850
________________________________________
MOMENTUM, PARTICIPATION & CPR DATA
Volume Profile: 2.00 Million Shares
Volume Character: High Relative Participation
Current Bias: BREAKOUT CONFIRMATION / BUY ON PULLBACKS
CPR State: Bullish Zone | CPR Sideways (Wide)
Today's CPR: Pivot 1,602.50 | Top 1,595.70 | Base 1,609.30
Tomorrow's CPR (Projected): Pivot 1,633.40 | Top 1,645.70 | Base 1,621.20
________________________________________
💡 STWP QUICK READ
Price has broken above an Ascending Triangle resistance.
Strong volume supports the breakout.
Buyers remain in control above the breakout zone.
Momentum remains firmly bullish, though extended.
Watch for sustained acceptance above the breakout area.
________________________________________
📚 EDUCATIONAL OBSERVATION
Aurobindo Pharma has delivered a notable Ascending Triangle breakout after several weeks of price compression. The pattern developed through a series of higher lows while price repeatedly encountered resistance around the same horizontal zone. This combination reflected increasing buying pressure as buyers gradually accepted higher prices.
The latest session has pushed price decisively above the upper boundary of the formation, accompanied by a strong bullish candle and increased participation. This gives the breakout greater technical significance compared with a move occurring on weak volume.
The overall technical picture suggests that buyers are attempting to establish a new higher trading range.
Momentum remains constructive. RSI at 65.27 indicates strong bullish momentum, while ADX at 27.03 suggests that the developing trend has meaningful strength. ROC at +8.22% confirms positive price acceleration, while the CCI at +233.75 reflects strong buying pressure. The Stochastic at 97.07 shows highly extended momentum, which means short-term consolidation or pullbacks remain possible even while the broader structure remains bullish.
Volume expanded to 2.00 million shares, approximately double the 20-day average of 1.00 million shares, representing a participation ratio of around 2.00x. Such above-average volume indicates increased market participation and adds credibility to the Ascending Triangle breakout.
The projected Central Pivot Range (CPR) has shifted higher, with tomorrow's Pivot at 1,633.40 and the projected CPR extending from 1,621.20 to 1,645.70. The upward shift in CPR supports the improving price structure, although sustained acceptance above the breakout zone remains important.
Immediate attention remains on 1,686.97 and 1,715.93, followed by 1,769.47 as the next major resistance zone. Sustained trading above the breakout area could strengthen the developing trend and bring higher-timeframe observation zones into focus. On the downside, 1,604.47 becomes the first important support, while 1,564.80 remains the structural invalidation level.
________________________________________
🏢 BUSINESS & FUNDAMENTAL UPDATE
Aurobindo Pharma remains a major Indian pharmaceutical company with a strong presence across generic medicines, active pharmaceutical ingredients (APIs), specialty products and international markets. Its diversified product portfolio, manufacturing capabilities and global presence provide a constructive long-term business backdrop. Continued focus on complex generics, specialty pharmaceuticals and international expansion remains important to the company's growth trajectory. Aurobindo Pharma delivered a strong Q1 FY27, with consolidated revenue rising approximately 16% YoY to 9,150 crore and net profit increasing 25.2% YoY to 1,032 crore. EBITDA grew around 20%, with the EBITDA margin improving to approximately 21%. The performance was supported by broad-based growth, particularly across its Europe and US businesses. Management also maintained a double-digit revenue growth outlook for FY27, while continuing investments in biosimilars and specialty products. The strong quarterly performance provides a constructive fundamental backdrop to the stock's current technical breakout.
________________________________________
📖 Educational Note
The Ascending Triangle generally develops when price repeatedly encounters resistance at a similar level while successive lows move higher. This reflects increasing demand and compression between buyers and sellers. However, the pattern becomes more meaningful when the breakout is accompanied by strong participation and sustained price acceptance above resistance. Support and resistance levels should be treated as observation zones rather than predictive targets. Chart patterns, price action, momentum indicators, volume analysis and CPR are educational tools that help market participants understand evolving market structure within a disciplined risk-management framework.
________________________________________
⚠️ Disclaimer
This analysis is provided strictly for educational and informational purposes.
This is not financial, investment or trading advice and should not be considered a recommendation to buy or sell any security.
Stock market investments are subject to market risks, including the possible loss of capital.
Past performance, historical observations, chart patterns and technical indicators do not guarantee future results.
Please conduct your own research and consult a SEBI-registered investment adviser before making investment decisions.
STWP assumes no responsibility or liability for any financial loss arising directly or indirectly from the use of this information.
 Long
Long
 Long
Long
 Short
Short
HAL Symmetrical Triangle Breakout Watch_______________________________________
📊 Hindustan Aeronautics Ltd. (HAL): Daily Technical Snapshot – Symmetrical Triangle Breakout Watch
📊 STWP Technical Analysis
________________________________________
MARKET STRUCTURE SNAPSHOT | NSE: HAL | DAILY
Closing Price: ₹4,581.70 (+₹90.70 | +2.02%)
Core Trend: Strong Uptrend
Market State: Consolidation Within Uptrend
Price Structure: Price is consolidating inside a Symmetrical Triangle, following a strong prior advance. The recent Bullish Engulfing candle suggests improving buying interest as the stock approaches the upper boundary of the pattern.
________________________________________
OPERATIONAL PRICE GRID & KEY REFERENCE LEVELS
Model Reference Level: ₹4,594.00
Hard Invalidation Level: ₹4,155.20
Structural Risk: ₹438.80 (9.55%)
Resistance Levels: R1 ₹4,630.00 | R2 ₹4,678.30 | R3 ₹4,762.60
Support Levels: S1 ₹4,497.40 | S2 ₹4,413.10 | S3 ₹4,364.80
Range Structure: Low ₹4,155.20 | High ₹4,762.60
Higher Timeframe Observation Zones: ₹4,678 | ₹4,763 | ₹4,900
________________________________________
MOMENTUM, PARTICIPATION & CPR DATA
Volume Profile: 697.57K Shares
Volume Character: Normal Relative Participation
RSI: 63.43 (Strong Momentum Zone)
ADX: 11.59 (Low Trend Strength – Compression Phase)
ROC: +4.12%
MACD Status: Strong Positive Momentum Structure
CCI: +173.39 (Strong Bullish Momentum)
Stochastic Reading: 95.73 (Extended Momentum Zone)
Current Bias: WAIT FOR BREAKOUT CONFIRMATION
CPR State: Bullish Zone | CPR Moving Up (Narrow)
Today's CPR: Pivot ₹4,489.00 | Top ₹4,490.00 | Base ₹4,488.00
Tomorrow's CPR (Projected): Pivot ₹4,545.70 | Top ₹4,563.70 | Base ₹4,527.70
________________________________________
📚 EDUCATIONAL OBSERVATION
Hindustan Aeronautics Ltd. (HAL) continues to trade within a Symmetrical Triangle, a consolidation pattern that often develops after a strong trending move. The formation of higher lows alongside lower highs indicates that buyers and sellers are gradually reaching equilibrium, leading to price compression before the next significant directional move.
The recent Bullish Engulfing candlestick near the rising trendline reflects renewed buying interest and suggests that buyers are attempting to challenge the upper boundary of the triangle. However, the pattern remains under development, and a decisive breakout above the resistance trendline, supported by stronger-than-average volume, would provide stronger confirmation of a potential continuation of the broader uptrend.
Momentum indicators continue to remain constructive. The RSI at 63.43 reflects healthy bullish momentum, while the MACD remains positive, indicating sustained upside strength. The ROC of +4.12% signals improving price acceleration, and the CCI reading of +173.39 confirms strong buying momentum. The Stochastic reading of 95.73 highlights continued participation, although elevated momentum levels may also lead to short-term consolidation before the next directional move. Meanwhile, the ADX at 11.59 indicates that the market is currently in a compression phase, which is common during triangle formations.
The projected Central Pivot Range (CPR) for the next trading session has shifted higher, with the projected Pivot at ₹4,545.70. A rising CPR reflects improving market acceptance of higher prices and supports the prevailing bullish bias.
Immediate technical attention remains on the resistance zone between ₹4,630 and ₹4,678, which also coincides with the upper boundary of the Symmetrical Triangle. A sustained breakout above this region could strengthen the existing bullish structure and bring the higher-timeframe observation zones near ₹4,763 and ₹4,900 into focus. On the downside, ₹4,497 remains the first important support, while the structural invalidation level is positioned near ₹4,155.
________________________________________
🏢 BUSINESS & FUNDAMENTAL UPDATE
Hindustan Aeronautics Ltd. (HAL) remains India's largest aerospace and defence manufacturer, benefiting from the Government of India's continued focus on defence modernisation and indigenous manufacturing under the Govt. initiative. The company maintains a strong order book across fighter aircraft, helicopters, engines and defence systems, providing healthy long-term revenue visibility. Increasing defence capital expenditure, export opportunities and sustained execution of major defence programmes continue to support HAL's long-term growth outlook.
________________________________________
📖 Educational Note
Support and resistance levels should be treated as observation zones rather than predictive targets. Chart patterns, price action, volume analysis, momentum indicators and CPR are educational tools that help market participants understand evolving market structure within a disciplined risk-management framework.
________________________________________
⚠️ Disclaimer
This analysis is provided strictly for educational and informational purposes.
It does not constitute financial, investment or trading advice and should not be interpreted as a recommendation to buy or sell any security.
Investments in the stock market are subject to market risks, including the possible loss of capital.
Historical performance, business developments, chart patterns and technical indicators do not guarantee future outcomes.
Please conduct your own research and consult a SEBI-registered investment adviser before making investment decisions.
STWP assumes no responsibility or liability for any financial loss arising directly or indirectly from the use of this analysis.
 Long
Long
TVSMOTOR Rising Wedge Recovery Strong Q1 FY27 Earnings📊 TVS Motor Company: Daily Technical Snapshot – Rising Wedge Recovery & Strong Q1 FY27 Earnings
📊 STWP Technical Analysis
________________________________________
MARKET STRUCTURE SNAPSHOT | NSE: TVSMOTOR | DAILY
Closing Price: 3,792.00 (+201.80 | +5.62%)
Core Trend: Strong Uptrend
Market State: Recovery Within Uptrend
Price Structure: Price has rebounded strongly after forming a Bullish Engulfing near the rising support trendline and is now attempting to break above the descending resistance of a Rising Wedge consolidation. The recovery is supported by improving momentum, healthy volume participation and strong quarterly earnings.
________________________________________
OPERATIONAL PRICE GRID & KEY REFERENCE LEVELS
Model Reference Level: 3,810.00
Hard Invalidation Level: 3,260.70
Structural Risk: 549.30 (14.42%)
Resistance Levels: R1 3,875.73 | R2 3,959.47 | R3 4,108.93
Support Levels: S1 3,642.53 | S2 3,493.07 | S3 3,409.33
Range Structure: Low 3,260.70 | High 4,108.93
Higher Timeframe Observation Zones: 3,960 | 4,109 | 4,250
________________________________________
🏢 BUSINESS & FUNDAMENTAL UPDATE
TVS Motor reported a strong Q1 FY27 performance, exceeding market expectations across revenue, profitability and margins. Standalone revenue increased 38% YoY to 13,896 crore, while net profit rose 51% YoY to a record 1,174 crore. EBITDA grew 41%, with margins expanding to 12.8%, despite concerns over rising input costs and a higher EV mix. The company also recorded its highest-ever quarterly vehicle sales of 1.63 million units, driven by robust growth across motorcycles, scooters, exports and electric vehicles, with EV sales surging 86% YoY. The Board also declared plans to raise up to 1,000 crore through debt instruments. The stronger-than-expected earnings, improving margins and record sales provided a positive fundamental backdrop to the stock's ongoing technical recovery and trendline breakout attempt.
________________________________________
⚠️ MOMENTUM, PARTICIPATION & CPR DATA
Volume Profile: 2.39 Million Shares
Volume Character: Strong Relative Participation
RSI: 65.36 (Strong Momentum Zone)
ADX: 18.85 (Trend Strength Improving)
ROC: +2.14%
MACD Status: Fresh Bullish Crossover
CCI: +127.60 (Positive Momentum)
Stochastic Reading: 93.64 (Extended Momentum Zone)
Current Bias: BUY ON PULLBACKS AFTER BREAKOUT CONFIRMATION
CPR State: Bullish Zone | CPR Moving Down (Narrow)
Today's CPR: Pivot 3,586.70 | Top 3,588.40 | Base 3,584.90
Tomorrow's CPR (Projected): Pivot 3,726.30 | Top 3,759.10 | Base 3,693.40
________________________________________
📚 EDUCATIONAL OBSERVATION
TVS Motor has staged a strong recovery after forming a Bullish Engulfing candlestick near the lower boundary of its rising support trendline. The stock is now testing the upper boundary of a Rising Wedge consolidation, signalling that buyers have regained control following a brief corrective phase. The recent price action indicates that selling pressure has gradually weakened while demand has improved near key support levels. The strong bullish candle, combined with improving momentum indicators, reflects renewed buying interest. However, the trendline breakout is still in progress, and confirmation would require sustained trading above the wedge resistance, preferably supported by stronger-than-average trading volume.
Momentum indicators continue to improve. The RSI at 65.36 reflects healthy bullish momentum without entering an extreme overbought zone. MACD has generated a fresh bullish crossover, suggesting strengthening upside momentum, while the ROC of +2.14% indicates improving price acceleration. The CCI reading of +127.60 confirms positive buying momentum, and the Stochastic reading of 93.64 highlights sustained participation. While momentum remains constructive, elevated readings may also result in short-term consolidations after a sharp advance. The projected Central Pivot Range (CPR) for the next trading session has shifted higher, with the projected Pivot at 3,726.30. A higher CPR reflects improving market acceptance of higher prices and supports the prevailing bullish structure as long as prices remain above key support levels. Immediate attention remains focused on the resistance zone between 3,876 and 3,959, which also coincides with the upper boundary of the Rising Wedge. A decisive close above this region, supported by improving participation, would confirm the breakout and could shift attention towards the higher-timeframe observation zones near 4,109 and 4,250. On the downside, 3,643 remains the first important support, while the structural invalidation level is positioned near 3,261.
________________________________________
📖 Educational Note
The combination of strong quarterly earnings, record vehicle sales, margin expansion, and a technical recovery within a Rising Wedge provides a constructive backdrop for the stock. However, from a technical perspective, the current setup will be considered fully confirmed only if price sustains above the wedge resistance with continued participation. Support and resistance levels should be treated as observation zones rather than predictive targets. Technical analysis and financial results are educational tools that help investors evaluate market structure and business performance within a disciplined risk-management framework.
________________________________________
Disclaimer
This analysis is provided strictly for educational and informational purposes.
It does not constitute financial, investment or trading advice and should not be interpreted as a recommendation to buy or sell any security. Investments in the stock market are subject to market risks, including the possible loss of capital. Historical performance, financial results, chart patterns and technical indicators do not guarantee future outcomes. Please conduct your own research and consult a SEBI-registered investment adviser before making investment decisions. STWP assumes no responsibility or liability for any financial loss arising directly or indirectly from the use of this analysis.
 Long
Long
HCLTECH Falling Wedge Breakout After Strong Q1 FY27 Results📊 HCL Technologies: Daily Technical Snapshot – Falling Wedge Breakout After Strong Q1 FY27 Results
📊 STWP Technical Analysis
________________________________________
MARKET STRUCTURE SNAPSHOT | NSE: HCLTECH | DAILY
Closing Price: 1,221.20 (+57.10 | +4.91%)
Core Trend: Recovery within Long-Term Uptrend
Market State: Confirmed Falling Wedge Breakout
Price Structure: Price has broken above a multi-month Falling Wedge, supported by a strong bullish breakout candle and significantly higher trading volume. The breakout signals weakening selling pressure and improving buyer conviction.
________________________________________
OPERATIONAL PRICE GRID & KEY REFERENCE LEVELS
Model Reference Level: 1,237.00
Hard Invalidation Level: 1,119.00
Structural Risk: 118.00 (9.54%)
Resistance Levels: R1 1,251.47 | R2 1,281.73 | R3 1,326.47
Support Levels: S1 1,176.47 | S2 1,131.73 | S3 1,101.47
Range Structure: Low 1,119.00 | High 1,326.47
Higher Timeframe Observation Zones: 1,355.00 | 1,472.95
________________________________________
MOMENTUM, PARTICIPATION & CPR DATA
Volume Profile: 9.03 Million Shares
Volume Character: Very High Relative Participation
RSI: 62.89 (Strong Momentum Zone)
ADX: 14.20 (Early Trend Development Phase)
ROC: +10.78%
MACD Status: Fresh Bullish Momentum Structure
CCI: +174.99 (Strong Bullish Momentum)
Stochastic Reading: 92.37 (Extended Momentum Zone)
Current Bias: BUY ON PULLBACKS
CPR State: Bullish Zone | CPR Moving Up (Wide)
Today's CPR: Pivot 1,169.70 | Top 1,166.90 | Base 1,172.50
Tomorrow's CPR (Projected): Pivot 1,206.75 | Top 1,213.95 | Base 1,199.50
________________________________________
📚 EDUCATIONAL OBSERVATION
HCL Technologies has confirmed a breakout from a multi-month Falling Wedge, a chart pattern widely regarded as a bullish reversal formation that often develops after an extended corrective phase. The breakout is supported by a strong bullish candle, improving momentum indicators and significantly higher trading volume, reflecting renewed buying interest and strengthening market participation.
A Falling Wedge forms as prices create progressively lower highs and lower lows within converging trendlines. As the pattern matures, selling pressure gradually weakens while buyers begin accumulating at lower levels. A decisive breakout above the upper boundary often signals that the corrective phase may be ending and that a fresh upward trend could be developing.
Momentum indicators continue to support the improving technical structure. The RSI at 62.89 reflects healthy bullish momentum without entering an extreme overbought zone. MACD has generated a fresh bullish crossover, indicating strengthening upside momentum, while the ROC of +10.78% highlights strong price acceleration. The CCI reading of +174.99 confirms robust buying pressure, and the Stochastic reading of 92.37 reflects sustained momentum, although elevated readings also suggest that short-term consolidations or pullbacks remain a normal possibility after a sharp breakout.
The projected Central Pivot Range (CPR) for the next trading session has shifted higher, with the projected Pivot at 1,206.75. A rising and widening CPR generally reflects improving market acceptance of higher prices and often supports trend continuation when accompanied by healthy participation. The current dashboard therefore maintains a constructive outlook with a preference for buying on pullbacks rather than chasing extended moves.
Immediate attention remains focused on the resistance zone between 1,251 and 1,282. A sustained move above this region could strengthen the breakout further and bring the higher-timeframe observation zones near 1,355 and 1,473 into focus. On the downside, 1,176 remains the first important support, while the structural invalidation level is positioned near 1,119.
________________________________________
🏢 BUSINESS & FUNDAMENTAL UPDATE
HCL Technologies recently announced its Q1 FY27 financial results (quarter ended June 2026), delivering a strong operational performance despite a challenging environment for the global IT services sector.
Key Highlights
Net Profit: 4,624 crore, up 20.32% year-on-year from 3,843 crore.
Revenue: 34,579 crore, representing 13.94% year-on-year growth from 30,349 crore.
Interim Dividend: The Board declared an interim dividend of 12 per equity share (face value 2) for FY27. The record date is 17 July 2026, while the dividend will be paid on 27 July 2026.
FY27 Guidance: Management reiterated its constant currency revenue growth guidance of 1–4%, maintaining its earlier outlook despite macroeconomic uncertainty.
The quarterly performance comes at a time when the broader IT sector continues to face headwinds from cautious enterprise technology spending, reduced discretionary budgets and increasing discussions around AI-driven pricing pressure across traditional IT services. Against this backdrop, HCLTech's stronger-than-expected profitability, double-digit revenue growth and stable guidance demonstrate operational resilience and disciplined execution.
Interestingly, the stock had already attracted strong buying interest ahead of the earnings announcement, rallying nearly 5% in the previous trading session. The combination of robust quarterly earnings, a healthy dividend announcement, stable management guidance and a technically confirmed Falling Wedge breakout provides both fundamental and technical support for the improving market structure.
________________________________________
📖 Educational Note
Support and resistance levels should be viewed as observation zones rather than predictive targets. Chart patterns, price action, volume analysis, momentum indicators and CPR are educational tools that help market participants understand evolving market structure within a disciplined risk-management framework. Similarly, strong quarterly results can improve investor sentiment but should always be evaluated alongside broader market conditions, valuation and risk management principles.
________________________________________
⚠️ Disclaimer
This analysis is provided strictly for educational and informational purposes.
It does not constitute financial, investment or trading advice and should not be interpreted as a recommendation to buy or sell any security.
Stock market investments are subject to market risks, including the possible loss of capital.
Past performance, historical observations, chart patterns, earnings performance and technical indicators do not guarantee future results.
Please conduct your own research and consult a SEBI-registered investment adviser before making investment decisions.
STWP assumes no responsibility or liability for any financial loss arising directly or indirectly from the use of this analysis.
 Long
Long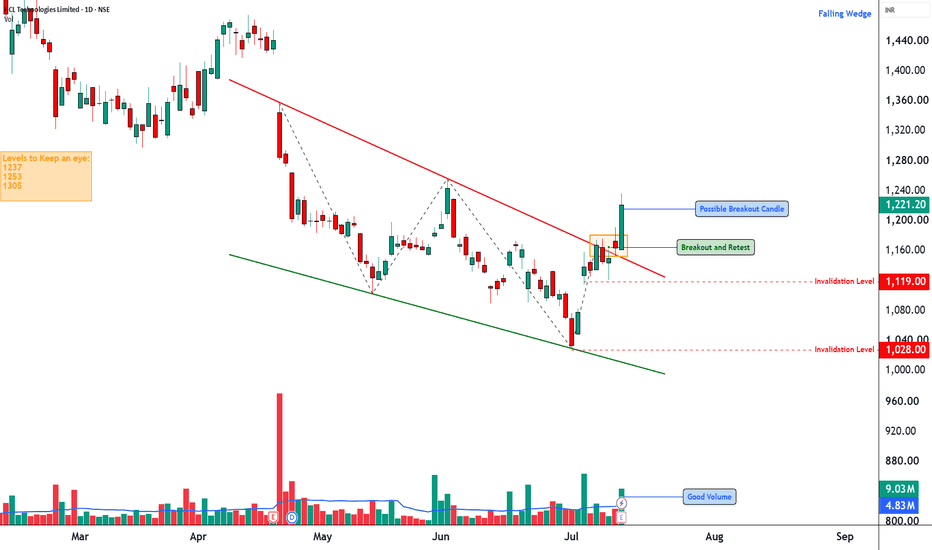
MCX Falling Wedge Recovery Setup📊 MCX: Daily Technical Snapshot – Falling Wedge Recovery Setup
📊 STWP Technical Analysis
________________________________________
MARKET STRUCTURE SNAPSHOT | NSE: MCX | DAILY
Closing Price: 2,742.00 (+98.80 | +3.74%)
Core Trend: Downtrend (Swing Structure)
Market State: Recovery Attempt Within Falling Wedge
Price Structure: Price is trading inside a Falling Wedge, a bullish reversal pattern, after forming a Bullish Engulfing near the lower boundary. Buyers have defended support, and the stock is now attempting to challenge the upper boundary of the wedge.
________________________________________
OPERATIONAL PRICE GRID & KEY REFERENCE LEVELS
Model Reference Level: 2,766.00
Hard Invalidation Level: 2,571.80
Structural Risk: 194.20 (7.02%)
Resistance Levels: R1 2,807 | R2 2,872 | R3 2,978
Support Levels: S1 2,636 | S2 2,530 | S3 2,465
Range Structure: Low 2,571.80 | High 2,978.00
Higher Timeframe Observation Zones: 2,872 | 2,978 | 3,100 | 3,180
________________________________________
MOMENTUM, PARTICIPATION & CPR DATA
Volume Profile: 4.93 Million Shares
Volume Character: Strong Relative Participation
RSI: 42.96 (Recovering Momentum Zone)
ADX: 20.18 (Trend Development Phase)
ROC: -3.14%
MACD Status: Negative Momentum Showing Signs of Stabilization
CCI: -155.33 (Recovering from Oversold Zone)
Stochastic Reading: 35.72 (Recovering from Oversold Zone)
Current Bias: WAIT FOR BREAKOUT CONFIRMATION
CPR State: Bullish Zone | CPR Moving Down (Normal)
Today's CPR: Pivot 2,651.55 | Top 2,655.75 | Base 2,647.40
Tomorrow's CPR (Projected): Pivot 2,701.00 | Top 2,721.50 | Base 2,680.50
________________________________________
📚 EDUCATIONAL OBSERVATION
MCX has shown encouraging signs of recovery after forming a Bullish Engulfing candlestick near the lower boundary of a Falling Wedge, a chart pattern commonly associated with bullish reversals following a corrective phase. The recent price action suggests that selling pressure is gradually weakening while buyers have started defending lower price levels.
The recent decline briefly pushed prices below nearby support before buyers quickly regained control, creating characteristics of a liquidity sweep (false breakdown). Such behaviour often reflects seller exhaustion, where weak hands exit the market before stronger buying interest emerges. The subsequent bullish engulfing candle reinforces this recovery attempt and highlights improving short-term sentiment.
Several technical observations are currently supporting the developing structure:
Falling Wedge Recovery Setup
Bullish Engulfing Candlestick
Liquidity Sweep / False Breakdown
Strong Bullish Recovery Candle
Bullish VWAP Position
Strong Relative Volume Participation
Buyers Regaining Short-Term Control
Momentum indicators are beginning to stabilise after the recent correction. The RSI at 42.96 remains below the stronger momentum zone but has started recovering, indicating improving buying interest. MACD continues to remain below the zero line, suggesting that the broader corrective trend is still intact, although downside momentum appears to be slowing. The CCI reading of -155.33 reflects a deeply oversold condition from which the stock has begun recovering, while the Stochastic reading of 35.72 also points towards improving momentum after emerging from oversold territory.
The projected Central Pivot Range (CPR) for the next trading session has shifted moderately higher, with the projected Pivot at 2,701.00. While this reflects improving market acceptance of higher prices, the setup continues to favour patience until a clearer directional breakout develops.
The immediate technical focus remains on the upper boundary of the Falling Wedge, which also coincides with the resistance zone between 2,807 and 2,872. A decisive close above this region, supported by stronger-than-average trading volume, would confirm the wedge breakout and significantly improve the probability of a broader bullish reversal. Upon confirmation, the higher-timeframe observation zones near 2,978, 3,100, and 3,180 may become relevant for future market structure analysis.
From a business perspective, Multi Commodity Exchange of India (MCX) is India's leading commodity derivatives exchange, facilitating trading across precious metals, base metals, energy and agricultural commodities. Continued growth in commodity market participation, increasing institutional activity and expansion of derivative products provide a constructive long-term backdrop for the company.
Support and resistance levels should be viewed as observation zones rather than predictive targets. Chart patterns, candlestick analysis, price action, volume studies, momentum indicators and CPR are educational tools that help market participants understand evolving market structure within a disciplined risk-management framework.
________________________________________
⚠️ Disclaimer
This analysis is provided strictly for educational and informational purposes.
This is not financial, investment or trading advice and should not be considered a recommendation to buy or sell any security.
Stock market investments are subject to market risks, including the possible loss of capital.
Past performance, historical observations, chart patterns and technical indicators do not guarantee future results.
Please conduct your own research and consult a SEBI-registered investment adviser before making investment decisions.
STWP assumes no responsibility or liability for any financial loss arising directly or indirectly from the use of this information.
 Long
Long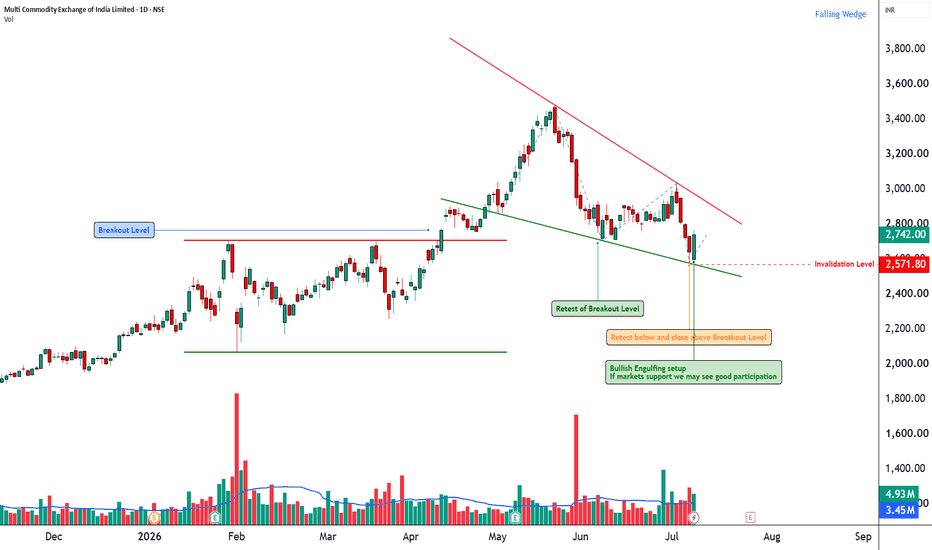
 Long
Long
 Long
Long
SUPREMEIND – STWP Equity Snapshot 📊 SUPREMEIND – Technical & Educational Snapshot
Ticker: NSE: SUPREMEIND
Sector: 🧪 Chemicals / Plastics
CMP: 3,500.80 ▲ (+4.15% | 22 Jan 2026)
Learning Rating: ⭐⭐⭐⭐☆ (Neutral–Range with Recovery Bias)
Chart Pattern Observed: 📊 Range Structure with Recovery from Demand
Candlestick Pattern Observed: Bullish Engulfing
📊 Technical Snapshot
SUPREMEIND is attempting a short-term stabilisation after a sharp corrective phase, with the latest daily candle showing a strong bullish response from lower demand zones. RSI is placed near 52.5, indicating neutral momentum with early signs of internal strength but no overbought pressure yet. Stochastic is around the mid-zone, suggesting recovery from oversold conditions rather than trend exhaustion. Bollinger Bands remain wide, reflecting elevated volatility and a market still adjusting after the decline, while price continues to trade below major supply zones — keeping the broader structure range-bound with recovery bias. MACD remains subdued, highlighting that momentum improvement is still developing rather than fully established. Price is currently interacting near the CPR band, which is relatively wide, typically associated with range-bound or two-sided price action. As long as price remains within or below the CPR zone, upside moves may face supply pressure, while sustained acceptance above the CPR pivot would be required to signal any meaningful directional shift.
📊 Volume Analysis
🔹 Current Volume: ~536K
🔹 Average Volume (20-period): ~252K ✅
💥 Volume is running at more than 2× the recent average, confirming active participation during the rebound from demand.
💡 Interpretation: Higher-than-average volume near support zones suggests genuine buying interest and supply absorption. However, for any sustained move toward upper range resistance, similar volume expansion will be required near higher levels to confirm acceptance.
🔑 Key Levels – Daily Timeframe
Support Areas: 3373 | 3258 | 3194
Resistance Areas: 3552 | 3616 | 3731
These are zones where price has paused or reacted earlier.
What’s Catching Our Eye: Sharp demand-led rebound with strong participation.
What to Watch For: Acceptance above CPR and nearby resistance.
Failure Zone: Loss of the recent demand base.
Risks to Watch: Overhead supply and wide CPR.
What to Expect Next: Range-bound move with recovery bias.
Bullish Case: Sustained Demand absorption may support recovery.
Bearish Case: Failure to hold Demand base risks deeper reversion.
Momentum Case: Strong Rebound momentum, needs follow-through.
STWP Equity Snapshot – SUPREMEIND
Intraday Setup:
Entry: 3,500.8
Invalidation level: 3,237.11
Reference 1: 3,817.23
Reference 2: 4,028.18
Swing Setup (Hybrid Model – 2–5 days):
Entry: 3,500.8
Invalidation level: 3,151.67
Reference 1: 4,199.06
Reference 2: 4,722.75
STWP View: Momentum: Strong | Trend: Range | Risk: High |Volume: High
Learning Note: Focus on structure, risk per trade and clean reviews – not prediction.
Disclaimer:
Educational view only. Not a Buy/Sell recommendation. Please consult a SEBI-registered advisor before making any decision. STWP is not responsible for trading decisions based on this post.
💬 Did this help you read the chart better?
🔼 Boost | ✍️ Comment | 🔁 Share with a learner
👉 Follow STWP for clean chart-reading insights
🚀 Stay Calm. Stay Clean. Trade With Patience.
 Long
Long
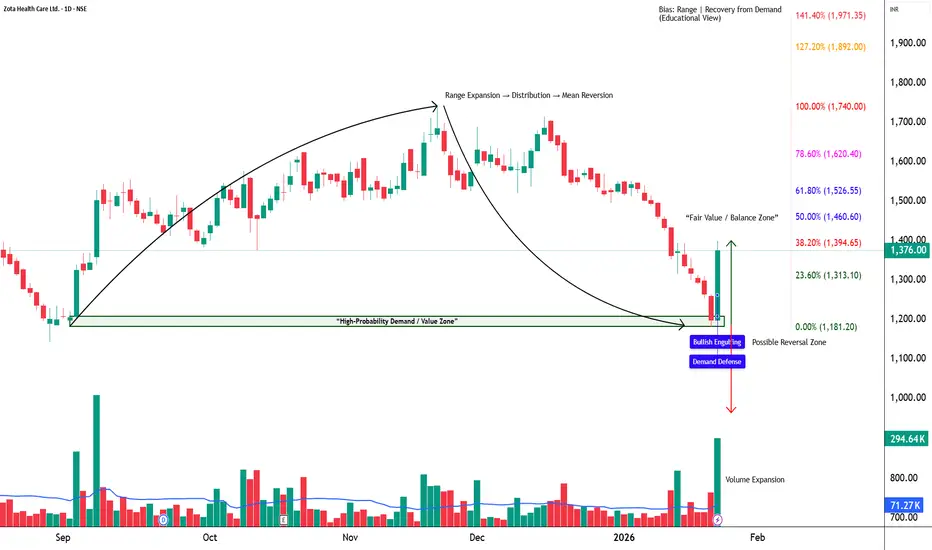
ZOTA - STWP Equity Snapshot📊 STWP Equity Snapshot – Zota Health Care Ltd
(Educational | Chart-Based Interpretation)
Market Structure
ZOTA witnessed a sharp corrective phase from higher levels, followed by a strong rebound from a well-defined demand zone. The recent candle stands out as a decisive bullish reaction, indicating aggressive buying interest after prolonged selling pressure. Despite the strength of the bounce, price is still trading within a broader range, and the larger trend structure has not yet shifted into a clear uptrend.
Demand–Supply Structure
Price moved deeply into a historical demand zone where buyers stepped in with conviction. The strong bullish candle suggests absorption of selling pressure and short-term buyer dominance. However, overhead supply zones remain active, meaning the current move should be viewed as a recovery from demand rather than a confirmed breakout. Sustained strength is required for further range expansion.
Key Levels – Daily Timeframe
Immediate demand zones are placed near 1376, followed by lower structural supports around 1290 and 1250. These are areas where buyers have previously defended price. On the upside, resistance zones are visible near 1451, 1526, and 1652, where selling pressure has historically emerged. These levels act as reaction zones and help define the current range.
What the Chart is Saying
Momentum has improved significantly after the recent bullish expansion, supported by strong volume participation. RSI is recovering from lower levels, indicating improving internal strength, but it is still not in a trending zone. The structure remains range-bound, suggesting that price may consolidate or oscillate between demand and supply zones before showing directional clarity.
CPR Impact
ZOTA is currently interacting with a wide CPR structure, which typically signals indecision and range-bound behavior. Earlier price action stayed below CPR resistance, reinforcing the lack of strong directional bias. For any sustained bullish shift, price would need to show acceptance above the CPR pivot with follow-through. Until then, the CPR structure supports a cautious, range-based view.
Additional Structure Observations
The rebound candle carries added significance as it formed with an open equal to the low, indicating immediate buyer control and minimal intraday selling pressure. This move was supported by clear volume expansion, suggesting participation beyond short-term traders and pointing toward stronger hands absorbing supply near demand. Short-term moving averages are attempting to turn up, reflecting improving momentum, while price remains below longer-term averages, keeping the broader structure neutral. RSI has recovered from lower levels but is still below bullish expansion zones, indicating support without trend confirmation. Additionally, the projected wide CPR for the next session reinforces the probability of consolidation or two-sided activity rather than immediate directional continuation. Overall, the move reflects strength from demand, but structural acceptance above nearby supply is still required for confirmation.
Intraday Reference Levels (Structure-Based)
The reference price zone near 1400 acts as a short-term decision area. Weakness below this zone may expose price toward lower demand regions around 1290. On the upside, reaction zones near 1450 and above are areas where price may pause or face selling pressure. These are observational levels, not predictions.
Swing Reference Levels (Hybrid Model | 2–5 Days)
For the short swing perspective, the 1400 zone remains the structural reference. Failure to hold demand increases downside risk toward deeper support zones. If strength sustains, higher range-expansion zones above previous resistance come into focus, but only as conditional possibilities within the broader range.
Final Outlook (Condition-Based)
Momentum is strong in the short term, supported by volume expansion. The trend remains range-bound, with no confirmed directional control yet. Risk remains high due to the counter-trend nature of the recovery and nearby supply zones. Volume is elevated, indicating participation, but structure confirmation is still pending.
💡 STWP Learning Note
Strong rebounds from demand show intent — not confirmation.
Let structure and acceptance guide bias, not candle size.
📘 STWP Approach
Observe price. Respect risk.
Trade structure, not excitement.
⚠️ Disclaimer
This post is shared strictly for educational and informational purposes.
It is not investment advice or a recommendation.
Please consult a SEBI-registered financial advisor before making any financial decision.
🚀 Stay Calm. Stay Clean. Trade With Patience. PGIL - STWP Equity Snapshot
📊 STWP Equity Snapshot – PGIL (Pearl Global Industries Ltd)
(Educational | Chart-Based Interpretation)
Market Structure:
Price fell sharply from the recent high and moved into a known demand zone where buyers usually step in. From this area, buying interest appeared, highlighted by a bullish engulfing candle. This shows that buyers are active and willing to defend this level. However, price is still moving inside a broader range, so the overall trend has not yet changed. Strength is visible from support, but clear trend confirmation is still awaited.
Demand–Supply Structure:
Price declined strongly into a previous demand zone, where buyers reacted immediately and pushed prices higher. The bullish engulfing candle reflects short-term buying interest from this support area. However, price is still facing resistance at higher levels, which limits upside for now. This move should be seen as a reaction from demand rather than a confirmed breakout.
Key Levels – Daily Timeframe:
The support zones around 1398, 1349, and 1321 are areas where buyers have previously stepped in and defended price. The resistance zones near 1475, 1502, and 1552 are levels where selling pressure has appeared in the past. These levels are important because price has reacted here earlier and may do so again.
What the Chart is Saying:
The overall trend is still range-bound, meaning price is moving sideways rather than trending clearly. Momentum is slowly recovering from oversold levels, showing some improvement in buying interest. Buyers have successfully defended the demand zone, which has helped stop the recent fall. However, price may now spend some time consolidating before it decides the next clear direction.
CPR Impact:
PGIL is trading below a wide CPR, which shows that the market lacks strong directional confidence. Earlier attempts to move above the CPR did not hold, and this zone is now acting as resistance. A wide CPR usually leads to range-bound or corrective price action, which fits well with the current chart structure. As long as price remains below the CPR pivot, upside moves may face selling pressure. A sustained move and acceptance above CPR would be needed to signal any meaningful bullish shift.
Intraday Reference Levels (Structure-based):
The reference price zone near 1453 acts as the key area to watch in the short term. If support weakens, the risk area lies around 1356, where the structure may start failing. On the upside, zones between 1570 and 1648 are areas where price may react or pause. These levels indicate possible reactions, not predictions.
Swing Reference Levels (Hybrid Model | 2–5 days):
For the short swing view, the reference price zone remains around 1453. If demand fails, risk increases below 1353. If strength continues, higher zones between 1654 and 1805 come into focus as possible range expansion areas. These zones reflect potential movement within the range, not certainty.
Final Outlook (Condition-Based):
Momentum is moderate, showing some recovery but not strong acceleration. The trend remains range-bound, with no clear directional control yet. Risk is high because the move is a counter-trend recovery and price is also facing resistance from the CPR zone. Volume is moderate, supporting the move but not strong enough to confirm a trend change.
💡 STWP Learning Note
A strong candle at support shows interest, not confirmation.
Let price accept above resistance and CPR before assuming a trend change.
📘 STWP Approach
Observe price. Respect risk.
Let structure guide decisions — not emotions.
🚀 Stay Calm. Stay Clean. Trade With Patience.
⚠️ Disclaimer
This post is shared only for educational and informational purposes.
It is not investment advice or a recommendation.
Please consult a SEBI-registered financial advisor before making any financial decision.
OFSS - STWP Equity SnapshotSTWP Equity Snapshot – OFSS (Educational | Chart-Based Interpretation)
📌 Intraday Reference Levels (Structure-based)
Reference Price Zone: 7,841
Risk Reference (Structure Invalidation): 7,432.87
Observed Upside Zones: 8,330.75 → 8,657.26
📌 Swing Reference Levels (Hybrid Model | 2–5 days | Observational)
Reference Price Zone: 7,841
Risk Reference (Structural Breakdown): 7,324.35
Higher Range Projection (If structure sustains): 8,874.29 → 9,649.27
Key Levels – Daily TF
Support: 7,643 | 7,455 | 7,356
Resistance: 7,931 | 8,030 | 8,219
🔍 STWP Market Read
Oracle Financial Services Software Ltd is attempting a base-building recovery after a prolonged corrective phase. Price has recently reacted positively from a defined demand zone, while overhead supply remains visible across clustered resistance bands. The latest rebound reflects improving participation, though confirmation is still evolving.
Momentum indicators are balanced rather than aggressive, with RSI near 48.48, suggesting stabilization without overextension. Volume remains around average (Vol X ~1.46), indicating participation but not yet a decisive expansion. Overall, the structure points to early stabilization with conditional upside, while risk remains elevated until price sustains beyond nearby supply.
📊 Chart Structure & Indicator Summary
Structure: Corrective base with early rebound
Trend: Improving, not yet dominant
Momentum: Strong recovery attempt, still developing
RSI: Healthy zone — neither stretched nor weak
MACD & ADX: Gradual improvement, trend strength building
Volume: Moderate, awaiting confirmation
📈 Final Outlook (Condition-Based)
Momentum: Strong (developing)
Trend: Improving / Early up-bias
Risk: High (overhead supply & confirmation pending)
Volume: Moderate
💡 STWP Learning Note
Recoveries are processes, not events. Strong outcomes emerge when price structure, momentum, and volume align over time — patience and risk discipline remain essential.
⚠️ Disclaimer:
This is an educational market interpretation based on chart structure and publicly available data. It is not a recommendation, advice, or solicitation. Equity markets involve risk. Please consult a SEBI-registered financial advisor before taking any investment or trading decision.
📘 STWP Approach:
Observe momentum. Respect risk. Let structure guide decisions.
💬 Did this add value?
🔼 Boost to support structured learning
✍️ Share your views or questions in the comments
🔁 Forward to traders who value disciplined analysis
👉 Follow for clean, probability-driven STWP insights
🚀 Stay Calm. Stay Clean. Trade With Patience.
Trade Smart | Learn Zones | Be Self-Reliant 📊
 Long
Long
 Long
Long
 Short
Short
BRITANNIA - Falling Wedge + Bullish Engulfing Combo💹 Britannia Industries Ltd (NSE: BRITANNIA)
Sector: FMCG | CMP: ₹5,892.50 | View: Falling Wedge + Bullish Engulfing Reversal Setup
📊 Price Action:
Britannia is currently displaying a strong confluence setup where both a chart pattern and a candlestick pattern align perfectly to signal a potential trend reversal.
After weeks of consolidation within a downward-sloping structure, the stock has formed a Falling Wedge pattern — a classic bullish reversal formation.
Adding strength to this structure, a Bullish Engulfing Candle on 4 Nov 2025 emerged from the wedge’s lower boundary, confirming buyer dominance and hinting at a near-term trend reversal.
📉 Chart Pattern Analysis – Falling Wedge (Bullish Setup):
The Falling Wedge pattern is marked by two converging downward trendlines, each connecting a series of lower highs and lower lows.
This structure reflects seller exhaustion and early buying interest.
Britannia’s wedge formation is now reaching its apex, where breakout probability is highest.
Volume contraction throughout the wedge also supports the notion that supply is drying up, preparing for a breakout above the upper trendline.
📈 Candlestick Pattern – Bullish Engulfing Confirmation:
The Bullish Engulfing Candle formed on 4 Nov 2025 precisely at the lower support line of the wedge, validating the pattern with strong timing. It represents a shift in control from sellers to buyers, with the green candle completely engulfing the prior red body. Volume expansion on that session further confirmed active participation by institutions ahead of the upcoming news catalysts. This one-day reversal candle acts as the first technical confirmation, while a breakout above the upper trendline will serve as the structural confirmation for the wedge pattern.
📏 Fibonacci Analysis:
From swing low ₹5,298 to swing high ₹5,930:
78.6% retracement @ ₹5,795 → Key reversal level defended.
61.8% retracement @ ₹5,888 → Currently reclaimed zone.
100% extension @ ₹5,930 → Short-term breakout threshold.
The Fibonacci structure aligns beautifully with the wedge’s geometry, implying that the reversal zone is complete and buyers are regaining momentum.
🧭 STWP Support & Resistance:
Resistances: ₹5,940 | ₹5,987 | ₹6,055
Supports: ₹5,825 | ₹5,775 | ₹5,710
The ₹5,775–₹5,825 range is acting as a high-confidence accumulation base, while ₹6,090–₹6,150 represents the key breakout trigger zone.
📊 STWP Volume & Technical Setup:
Volume on 4 Nov surged to 363.4K vs 248.7K average, confirming institutional interest at lower levels. VWAP recovery and improving RSI (47→52+) show that momentum is gradually returning.
MACD is approaching a bullish crossover, while Stochastic and CCI have both turned upward — all aligning with a reversal confirmation setup.
Trend Direction: UPTREND (Transitioning) | Volume Confirmation: Possible Accumulation in Progress
🧩 STWP Summary View:
Final Outlook:
Momentum: Strengthening | Pattern: Falling Wedge + Bullish Engulfing | Risk: Moderate | Volume: Increasing
Britannia’s technical structure now showcases dual confirmation — a chart pattern (Falling Wedge) supported by a candlestick reversal (Bullish Engulfing).
This confluence enhances the reliability of the reversal signal and increases the probability of an upside breakout. As long as the price holds above ₹5,825, the bias remains bullish with potential continuation toward ₹6,150–₹6,250.
⚠️ Disclosure & Disclaimer – Please Read Carefully
This analysis is for educational purposes only and should not be treated as financial or investment advice.
I am not a SEBI-registered investment adviser. All views are based on technical observations and publicly available information.
Trading involves risk; please assess your financial suitability, position size, and stop-loss levels before entering any trade.
Always consult a SEBI-registered financial adviser for personalized guidance.
Position Status: No active position in (BRITANNIA) at the time of this analysis.
Data Source: TradingView & NSE India
💬 Found this useful?
🔼 Give this post a Boost if you value clean technical confluence studies.
💭 Comment your thoughts — does this wedge-breakout setup look convincing to you?
🔁 Share this post to help others understand pattern + candlestick synergy.
👉 Follow for more institutional-style technical breakdowns built on clarity and patience.
🚀 Stay Calm. Stay Clean. Trade With Patience.
Trade Smart | Learn Zones | Be Self-Reliant 📊  Long
Long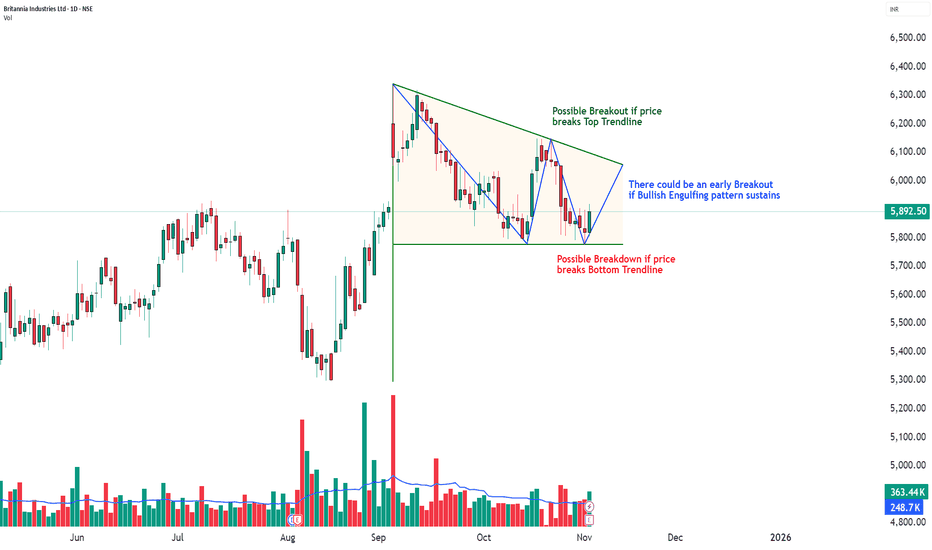
NUVAMA | Bullish Engulfing + VWAP Alignment📈 NUVAMA | Bullish Engulfing + VWAP Alignment + Strong Momentum Reversal 🚀
🔹 Entry Zone: ₹7,420.50 – ₹7,436.00
🔹 Stop Loss: ₹7,151.90 (Risk ~284 pts)
🔹 Supports: 7,244.33 / 7,068.17 / 6,972.33
🔹 Resistances: 7,516.33 / 7,612.17 / 7,788.33
🔹 Swing Demand Zone: ₹7,086 – ₹6,998.50
🔹 Intraday Demand Zone: ₹7,253.50 – ₹7,223
🔑 Key Highlights
✅ Bullish Engulfing Candle – powerful reversal confirmation
✅ VWAP Alignment – institutional bias turning bullish
✅ Momentum Strength – bullish follow-up after base formation
✅ Bollinger Squeeze-Off – volatility expansion expected
✅ Volume near average – healthy buyer participation, stable accumulation
🎯 STWP Trade View
📊 Strong bullish momentum supports a near-term rally toward ₹7,516–₹7,612. Sustaining above ₹7,612 could open upside potential to ₹7,788.
⚠️ The ₹7,253–₹7,223 zone provides intraday support, while ₹7,190–₹7,165 acts as a swing base for positional buyers to watch.
💡 Learning Note
This setup demonstrates how a Bullish Engulfing pattern with VWAP confirmation offers a reliable multi-signal entry. When aligned with tight demand zones, it allows traders to manage risk effectively while capitalizing on short-term breakouts.
Final Outlook: Momentum: Strong, Trend: Bullish, Risk: Low, Volume: High
________________________________________
________________________________________
⚠️ Disclosure & Disclaimer – Please Read Carefully
The information shared here is meant purely for learning and awareness. It is not a buy or sell recommendation and should not be taken as investment advice. I am not a SEBI-registered investment adviser, and all views expressed are based on personal study, chart patterns, and publicly available market data.
Trading—whether in stocks or options—carries risk. Markets can move unexpectedly, and losses can sometimes exceed the money you have invested. Past performance or past setups do not guarantee future results.
If you are a beginner, treat this as a guide to understand how the market works and practice on paper trades before risking real money. If you are experienced, always assess your own risk, position sizing, and strategy suitability before entering trades.
Consult a SEBI-registered financial adviser before making any real trading decision. By engaging with this content, you acknowledge full responsibility for your trades and investments.
Position Status: No active position in NUVAMA at the time of analysis.
Data Source: TradingView & NSE India (Past Chart Reference) (Historical levels)
💬 Found this useful?
🔼 Give this post a Boost to help more traders discover clean, structured learning.
✍️ Drop your thoughts, questions, or setups in the comments — let’s grow together!
🔁 Share with fellow traders and beginners to spread awareness.
👉 “If you liked this breakdown, follow for more clean, structured setups with discipline at the core.”
🚀 Stay Calm. Stay Clean. Trade With Patience.
Trade Smart | Learn Zones | Be Self-Reliant 📊  Long
Long
TITAN - Bullish Reversal & Long-Term Growth StoryTITAN | Bullish Reversal & Long-Term Growth Story
Stock: Titan Company Ltd (NSE: TITAN)
Timeframe: Daily Chart
Pattern: Bullish Reversal from Key Support(Bullish Engulfing)
🏷️ Stock Intro
Titan is India’s leading lifestyle & jewellery retailer with brands like Tanishq, CaratLane and Fastrack. Strong brand equity and robust consumer demand keep Titan a long-term structural growth story.
🔎 Price Action
Current Price: ₹3,401.20
After a sharp fall from the 3,740 zone, Titan bounced off the bottom range near ₹3,303 with a strong bullish candle & above-average volume (see chart).
Key Fibonacci levels: 23.6% at 3,406, 38.2% at 3,470, and 61.8% at 3,573.
🧮 Technical Analysis
Trend: Medium-term uptrend remains intact despite recent correction.
Volume: Spike to 1.45M signals aggressive buying near support.
Momentum: Bullish engulfing candle with open = low indicates strong intraday demand.
🎯 Key Levels
Support: 3,346 / 3,297 / 3,255
Resistance: 3,437 / 3,473 / 3,528
Top Range: 3,740 (major breakout level)
📊 Volume & Indicators
Bullish VWAP confirmation with BBSqueeze OFF → potential breakout if liquidity holds.
🆕 Latest Update & Growth Outlook
FY28 EPS projected ~₹75–76 (21% CAGR).
High ROE (~35%) and sustained jewellery demand keep Titan a premium growth play.
💹 STWP Educational Trade Illustration
This illustration is only for learning purposes and not a recommendation to trade or invest.
Chart Observation: Price action shows a recent bullish reversal near the ₹3,300 support zone with strong volume.
Illustrative Setup: A trader studying this pattern might observe a potential entry area around ₹3,418 with a protective stop near ₹3,300 to manage risk.
Potential Price Zones: Key resistance zones lie near ₹3,740 and ₹3,850, which could act as future reference levels if the bullish momentum continues.
Valuation Outlook: Based on projected FY28 EPS of about ₹75–76 and an illustrative P/E multiple of 70×, some analysts estimate a theoretical long-term fair value band of around ₹5,300–₹5,500, provided growth assumptions hold.
⚠️ Risk Reminder
Gold price volatility and discretionary slowdown can impact margins.
Premium valuation (~80× trailing P/E) requires consistent earnings growth.
🏁 Final Outlook
Titan shows a strong reversal setup backed by robust fundamentals and premium brand positioning. Ideal for positional swing traders and long-term investors seeking compounding stories.
💡 Learning Note:
This setup demonstrates how price action + Fibonacci levels + surge in volume can signal a high-conviction reversal trade when aligned with long-term growth fundamentals.
⚠️ Disclosure & Disclaimer – Please Read Carefully
The information shared here is meant purely for learning and awareness. It is not a buy or sell recommendation and should not be taken as investment advice. I am not a SEBI-registered investment adviser, and all views expressed are based on personal study, chart patterns, and publicly available market data.
Trading—whether in stocks or options—carries risk. Markets can move unexpectedly, and losses can sometimes exceed the money you have invested. Past performance or past setups do not guarantee future results.
If you are a beginner, treat this as a guide to understand how the market works and practice on paper trades before risking real money. If you are experienced, always assess your own risk, position sizing, and strategy suitability before entering trades.
Consult a SEBI-registered financial adviser before making any real trading decision. By engaging with this content, you acknowledge full responsibility for your trades and investments.
💬 Found this useful?
🔼 Give this post a Boost to help more traders discover clean, structured learning.
✍️ Drop your thoughts, questions, or setups in the comments — let’s grow together!
🔁 Share with fellow traders and beginners to spread awareness.
👉 “If you liked this breakdown, follow for more clean, structured setups with discipline at the core.”
🚀 Stay Calm. Stay Clean. Trade With Patience.
Trade Smart | Learn Zones | Be Self-Reliant 📊  Long
Long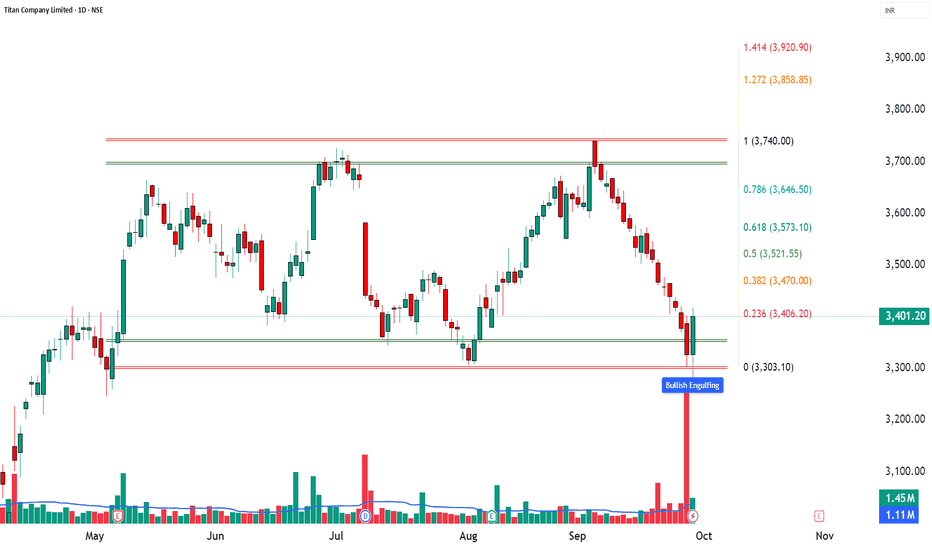
Silver: Bearish Engulfing – Is the Top In?#Silver View:
Just like Gold, Silver has formed a strong Bearish Engulfing pattern on the daily chart, potentially signaling a temporary top in the current trend. While it’s still early to confirm a full reversal, the price action suggests caution for bulls.
✅ Confirmation:
A daily close below 143,900
(today's low), especially with increased volume, would confirm the pattern and likely trigger further downside momentum.
❌ Negation:
If Silver manages to close above 153,388 (today’s high), the bearish structure will be invalidated.
🎯 Key Levels to Watch:
Resistance: 153,388 (pattern high)
Support: 143,900 (pattern low)
Stay alert for follow-through candles and volume spikes in coming sessions.
#Silver | #XAGUSD | #BearishEngulfing | #CandlestickPatterns | #TechnicalAnalysis | #PriceAction | #SilverAnalysis
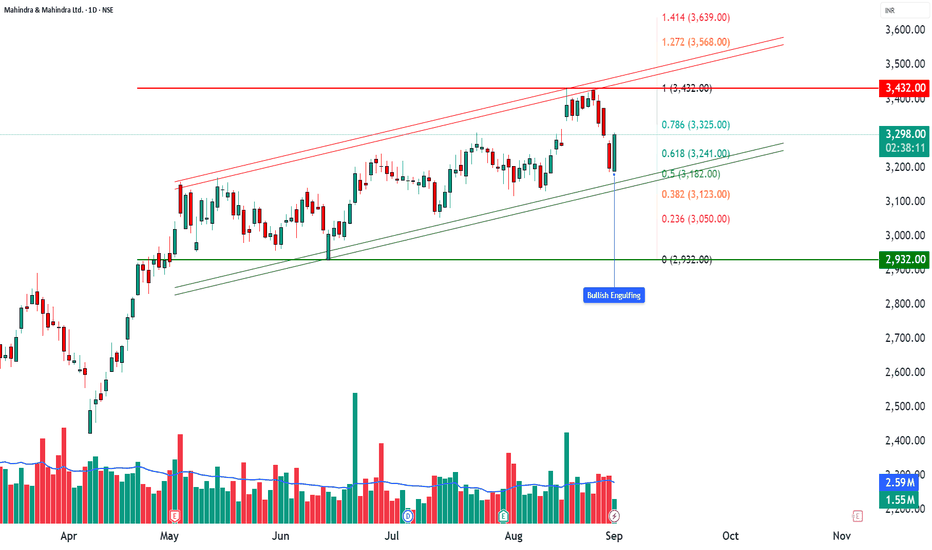
📌 Disclaimer: This analysis is shared for educational purposes only. It is not a buy/sell recommendation. Please do your own research before making any trading decisions. M&M | How to Trade a Bullish Engulfing in a Rising Channel🚘 M&M | How to Trade a Bullish Engulfing in a Rising Channel
📊 Stock: Mahindra & Mahindra Ltd (M&M)
⏳ Timeframe: Daily
📈 Chart Pattern: Rising Channel
🕯 Candlestick Pattern: Bullish Engulfing
________________________________________
🔹 Pattern Overview
M&M is currently trading within a Rising Channel, a structure that often reflects sustained bullish momentum. On the latest daily chart, a Bullish Engulfing candlestick has been formed, signaling renewed buying interest after a brief phase of consolidation.
________________________________________
The setup looks stronger with a Bullish Marubozu and an Open = Low candle, showing aggressive demand from the open. Price is holding well above VWAP, confirming bullish bias. A BB Squeeze Off signals volatility expansion ahead, while the recent false breakdown indicates sellers got trapped and buyers are back in control.
________________________________________
🔹 Key Levels to Watch
Resistance Zones: 3335 – 3374 – 3445
Support Zones: 3224 – 3152 – 3113
________________________________________
🔹 Technical Indicators Snapshot
RSI is at 52, sitting in the neutral zone but leaving room for upside momentum if buying picks up. The MACD shows a bearish crossover, which is an early caution signal to watch. CCI at -14 indicates neutral sentiment with no strong bias, while Stochastic at 55 is mid-range, suggesting neither overbought nor oversold conditions at the moment.
________________________________________
🔹 Candle Analysis
Candle 1 (Yesterday): High 3280 | Low 3187
Candle 2 (Today): High 3302.10 | Low 3191.10
👉 The today’s candle engulfed the previous session’s body, confirming the Bullish Engulfing pattern.
________________________________________
🔹 Trading View (Educational Insight Only)
A Bullish Engulfing inside a Rising Channel generally indicates continuation of the prevailing uptrend. If price manages to probably sustain above the 3335–3374 zone, it may signal strength for further upside. On the other hand, if the stock probably slips below the 3224–3152 support zone, it could lead to short-term profit booking.
________________________________________
📌 “All price levels mentioned are as observed at the time of writing and may change with market movements. Readers are advised to track live prices before making any trading or investment decision.”
⚠️ Disclaimer – Please Read Carefully
The information shared here is meant purely for learning and awareness. It is not a buy or sell recommendation and should not be taken as investment advice. I am not a SEBI-registered investment advisor, and all views expressed are based on personal study, chart patterns, and publicly available market data.
Trading — whether in stocks or options — carries risk. Markets can move unexpectedly, and losses can sometimes exceed the money you have invested. Past performance or past setups do not guarantee future results.
If you are a beginner, treat this as a guide to understand how the market works — practice on paper trades before risking real money. If you are experienced, always assess your own risk, position sizing, and strategy suitability before entering trades.
Consult a SEBI-registered financial advisor before making any real trading decision. By engaging with this content, you acknowledge full responsibility for your trades and investments.
💬 Found this useful?
🔼 Give this post a Boost to help more traders discover clean, structured learning.
✍️ Drop your thoughts, questions, or setups in the comments — let’s grow together!
🔁 Share with fellow traders and beginners to spread awareness.
👉 “If you liked this breakdown, follow for more clean, structured setups with discipline at the core.”
🚀 Stay Calm. Stay Clean. Trade With Patience.
Trade Smart | Learn Zones | Be Self-Reliant 📊  Long
Long