TOP/BOTTOM REVERSAL CANDLE PATTERNSHi
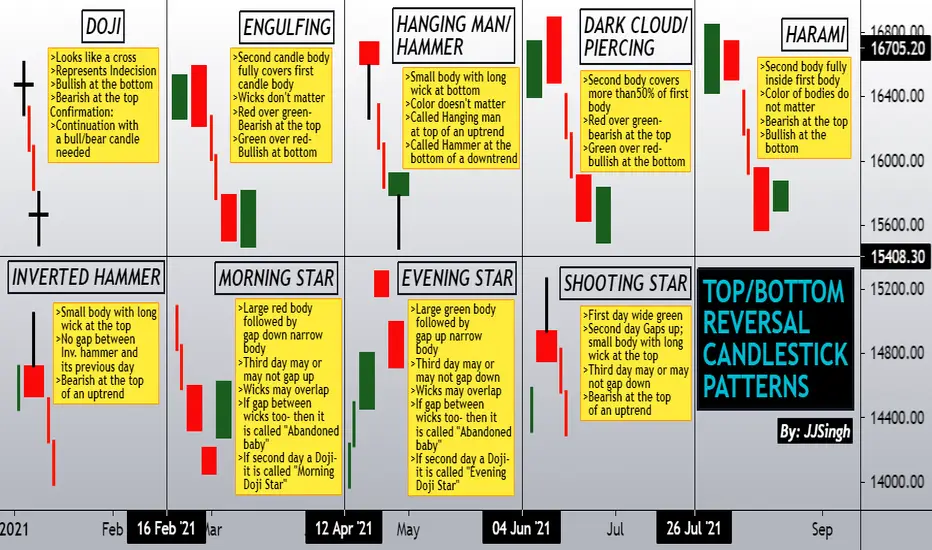
Its been a while since my last post. In this post I have represented selective candlestick reversal patterns.
In a candlestick, "body" represents the distance between candle OPEN and CLOSING price. Whereas "wicks" represent the entire range of the candle from TOP to the BOTTOM.
In most of these patterns only bodies are important. There are no conditions for wicks unless specifically mentioned like in abandoned baby star and (first two candles of) shooting star pattern. In an abandoned baby
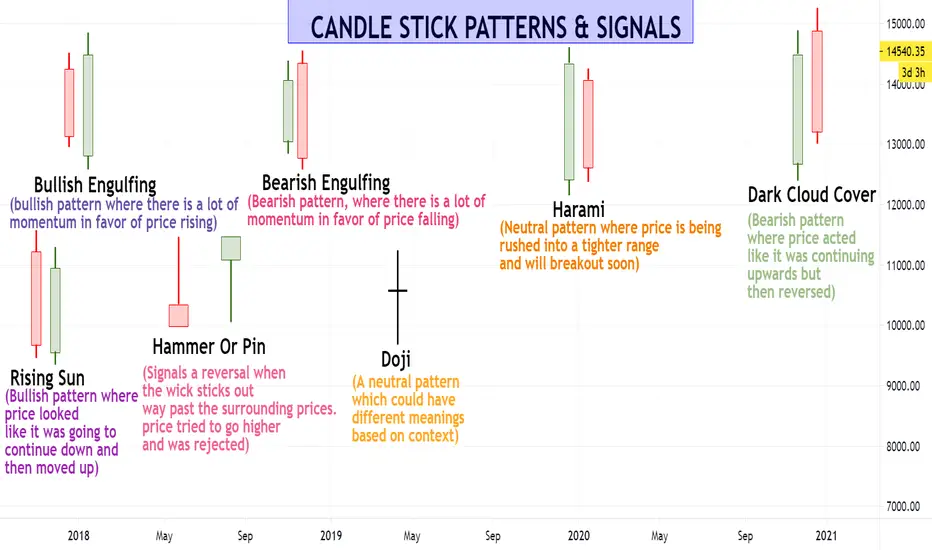
Engulfing Candle
All you need to know about DLF in 15 mins👑 Terms used if you don't know :
✣ An inverse head and shoulders also called a "head and shoulders bottom", is similar to the standard head and shoulders pattern, but inverted: with the head and shoulders top used to predict reversals in downtrends. This pattern is identified when the price action of security meets the following characteristics: the price falls to a trough and then rises; the price falls below the former trough and then rises again; finally, the price falls again but not as far
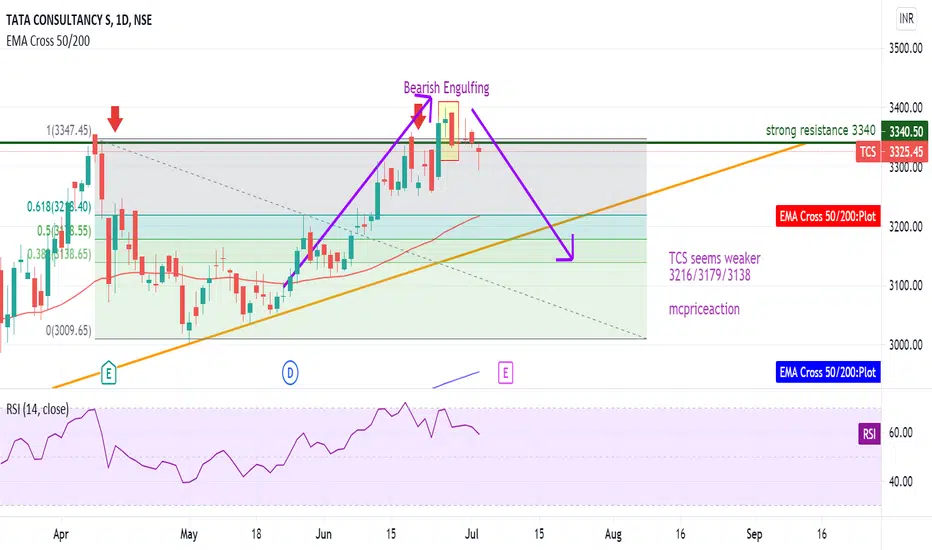
Bearish Engulfing TCS A bearish engulfing pattern is a technical chart pattern that signals lower prices to come. The pattern consists of an up (white or green) candlestick followed by a large down (black or red) candlestick that eclipses or "engulfs" the smaller up candle.
Bearish Engulfing Potential Sell Signal:
Three ways for selling using the Bearish Engulfing Pattern from most aggressive to most conservative:
1. A Aggressive trader might sell at the close of candle
2. If there is a substantial increase in
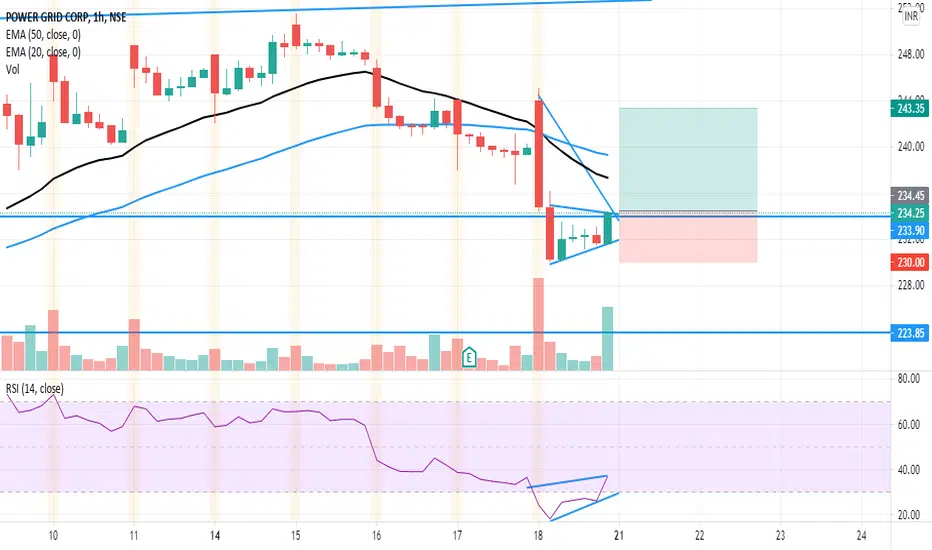
POWER GRID CORP :)DATE:18/06/2021.
Powergrid has clear rsi bullish divergence in"1 hour time frame".
and also today it forms clear bullish engulfing represents buyers took charge
buy at 235
target at 243(3.80%)
stoploss at 230(1.90%)
C0NS: in 1D chart it has big bearish candle with increased volumes represents bearish trend in 1D chart but uptrend stock in long time.
FOLLOW ME for more updates :)
TRANGLE & ELLIOTE WAAVE IN HDFC LIFEBUY : 682 TO 657
TARGET : 837
Reason For Buying This Script :
In this script has formed Elliot way in monthly time frame & in weekly waiting for triangle pattern breakout.
Once it break the triangle pattern the price will go in upward direction. This is good quality script try to accumulate more. Once it break the 837 and close above 837 level in monthly time frame means and the next target up to 960 .
Note:
Above given levels are based on monthly & weekly time frame . So be pati
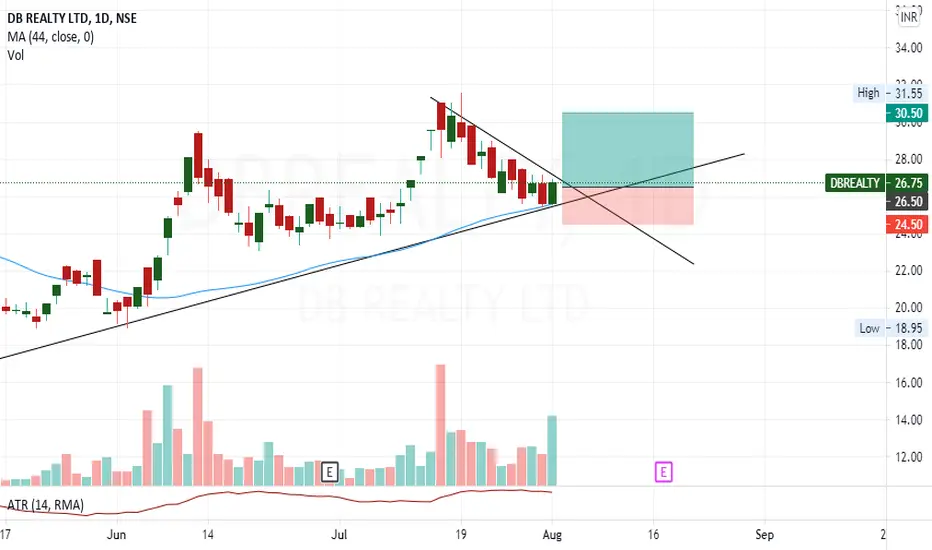
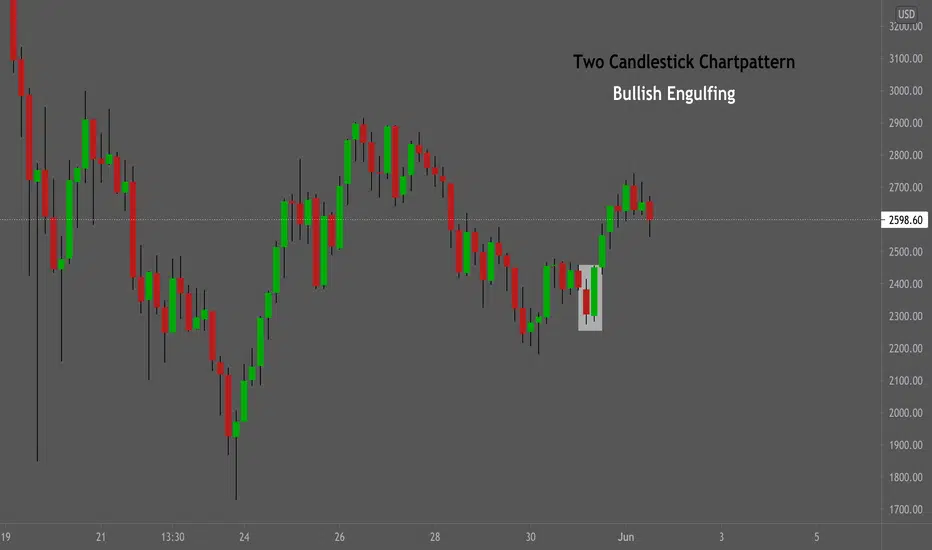
Two Candlestick Pattern - Bullish EngulfingA bullish engulfing pattern is a candlestick pattern that forms when a small Red candlestick is followed the next day by a large Green candlestick, the body of which completely overlaps or engulfs the body of the previous day’s candlestick.
Bullish engulfing patterns are more likely to signal reversals when they are preceded by four or more black candlesticks.
Investors should look not only to the two candlesticks which form the bullish engulfing pattern but also to the preceding candlesticks.
Reliance longReliance Long
Bullish engulfing candle stick pattern found yesterday
single candle covered 100 day and 50 day ema
high made exactly at 2095 (20 day ema)
Buy above 2095
SL- 2020
Target- 2178, 2205, 2305
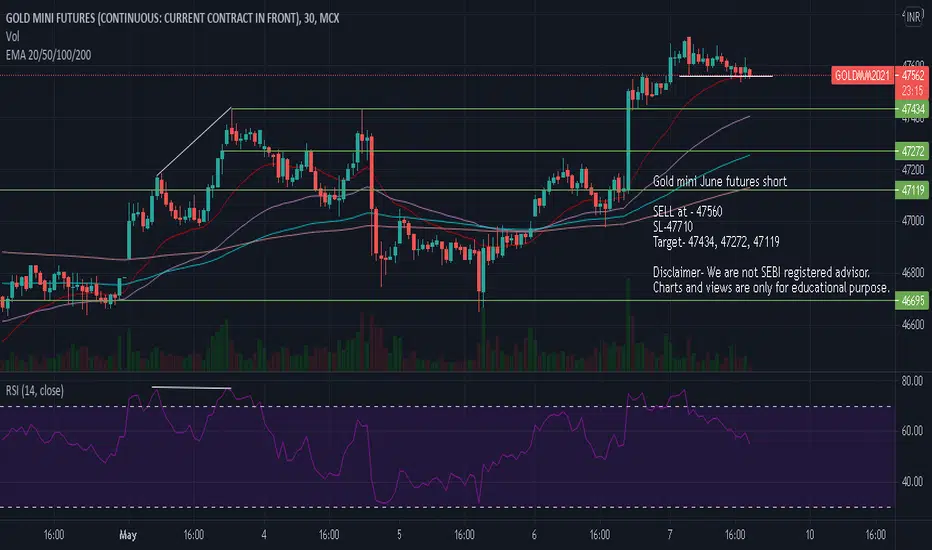
Disclaimer- We are not SEBI registered advisor.
Charts and views are only for educational purpose.