Bullish Opportunity on USDCNHHello traders!
I would like to present an exciting trading opportunity on the USDCNH currency pair, which appears to be trading bullish on the 1-hour chart. After analyzing the price action, I have identified a compelling bullish engulfing candlestick pattern, suggesting a continuation of the upward trend. Let's dive into the details of this trade plan.
Trade Plan:
Entry 1 (Market Execution): 7.1800
Entry 2 (Market Execution): 7.1804
Stop Loss (SL): 7.1277
Take Profit 1 (TP1): 7.2131
Take P
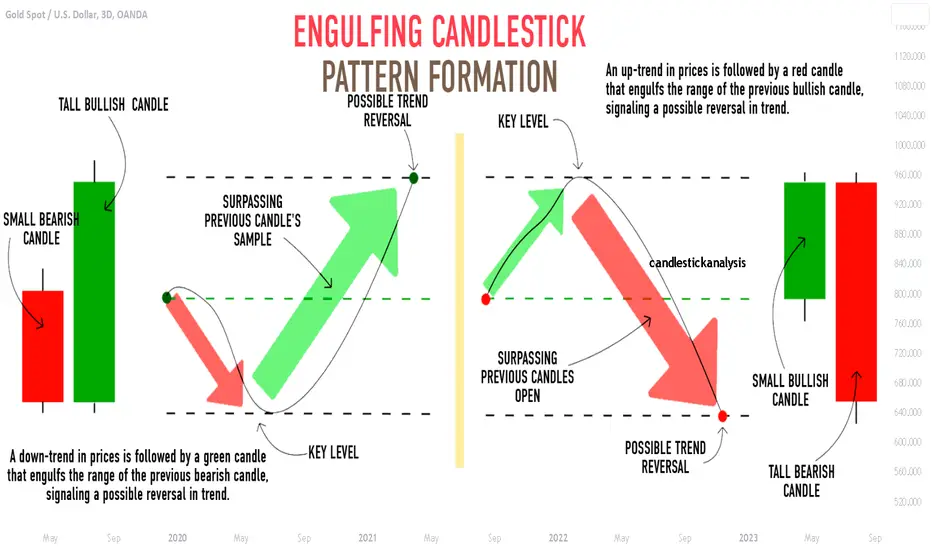
Engulfing Candle
How to Spot and Trade the ENGULFING CANDLE
Hey traders,
In this post, we will discuss a classic candlestick pattern formation each trader must know - the engulfing candle.
Key properties of this pattern:
🔑 Engulfing candle is a reversal pattern.
🔑 Engulfing candle can be bullish or bearish.
❗️Also, remember that this candle demonstrates the highest accuracy when it is formed on a key level (support or resistance).
⬆️Bullish Engulfing Candle usually forms after a strong bearish impulse.
Weakening, the market keeps going lower forming
Mastering Engulfing Candle Trading
📚Engulfing candles are an essential feature of technical analysis in forex trading. An engulfing pattern happens when a larger candle engulfs the entire body of the previous candle, signaling a potential reversal of the current trend. Engulfing candles, which can be either bullish or bearish, are trusted by many traders for their reliability in predicting future price movements. However, to become an expert in engulfing candle trading, one needs to learn how to identify the best ones and lever
CADJPY BEARISH THU 6 Jul 2023 (education)The price is ranging structure in monthly and daily timeframes
the price hits the upper range and reject with engulfing candles at the supply zone in daily timeframes
The set up is simple.
Engulfing breakout of range at the supply zone after price been ranging for a while.
The risk reward ratio is 5
the stoploss level is above supply zone
the target is the double bottom that cause price go went up
I risk 0.10% of entire portfolio on this trade.
🚀USDCAD double bottom: bulls ready to charge📈Brace yourself for a game-changing setup on the USDCAD forex pair! 🌟
The charts are showing a compelling buy signal in the 4-hour timeframe, with price bouncing off a solid support level at 1.31400.
But that's not all! The candlestick pattern has revealed a powerful bullish engulfing formation, signaling a potential trend reversal in the making.
Get ready to set your sights on multiple take profit levels: first target at 1.31950, representing the 0.618 Fibonacci retracement. Then, the nec
EURAUD 4Hrs Trend channel +190 PIPTimeframe: 4 Hours
Long Day Trading Position
Initial Take Profit : 1.6183 to the channel middle point
2nd TP: 1.6238 (to the high volume node of the volume profile)
SL: 1.593 (breaking the trend channel)
The pair is in a bearish tunnel for more than a month, and now in the trend channel's bottom, and has a high potential to go up again during the next few days↑.
↝✔
Esteem your Analysis and seek improvements ⌁
@AbdullahTech ♾✽
June23 ↝✔ Keep an eye on the next price journey ;)
Bearish engulfing candle 1WKeeping it simple. There is a bearish engulfing candle on the 1W with a clear invalidation level of 30650
This is a major resistance level including the Microstrategy average purchase and Elon Musk - Tesla 2021 sell price. It is also the yearly low of 2021. This is financial advice.
GANX Biotechnology Penny Stock Uptrending LONGGANX had been in a tight consolidation channel prior to April 12th. This is the
uncommon high tight flag pattern. Once breaking out, the typical guidance is
the next leg up will be at least the distance of the flagpole portion of the pattern.
On April 12th, a new chief financial officer was appointed to Gain Therapeutics.
( see the link below )
This is part of the push to generate earnings while still developing a pipeline
and potentially the first profitable FDA-approved product. A
Possible beginning of a new bearish leg for SPXSummary:
Main bearish trend (dotted teal downtrend line)
Reversal attempt in progress (purple uptrend line)
200-SMA breakout in jan-2023
Failure to continue the breakout (failed bull flag - orange lines)
Arrow #3 as a good entry option for a bear trade.
Possible beginning of a new bearish leg, aligned with the main trend
Possibility to surpass the last low (oct-13-2022). Set target @3,330.00.
Timeframe expected: 3 to 4 months.
Detailed explanation:
2022 was a very
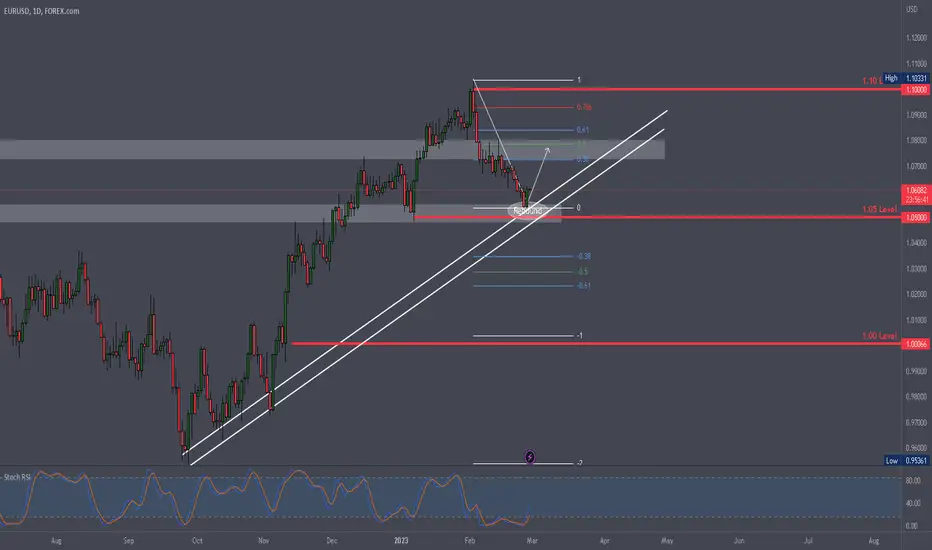
EURUSD - Wanna go up a little bit? EURUSD has been under water for a minute, but, a this point, we might want to go back up a little bit,
The window is short as I think we're expecting more downward movements in the upcoming months, but for now, we might be able to get a nugget from a temporary retracement.
I have been waiting for EU to get into the 1.05 level for a while and there it is, so, I'm going to enter a long, short term, contertrend short term trade/with the longer term uptrend trade
These times are tricky when it c
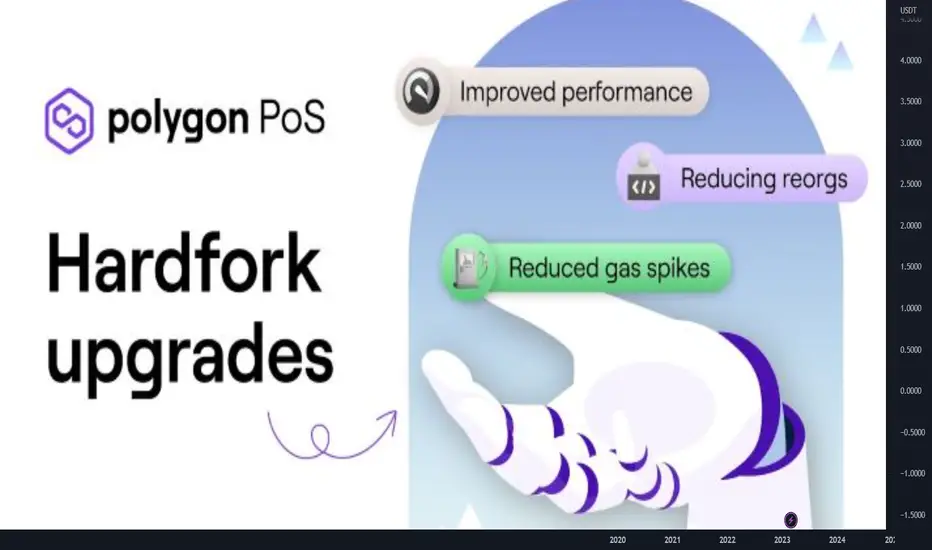
Upgrading Polygon PoS Chain to Boost Performance + TAHello friend.
Today im going to explain about the latest happenings in polygon layer-2 blockchain.
Lets see what will happen?
When the Polygon PoS chain first launched it offered a much-needed solution for Ethereum’s scaling issues.
It gave users and developers alike everything they love about Ethereum but with faster throughput and lower fees.
Now, with tens of thousands of decentralized apps, over 207 million unique addresses, more than 2.3 billion processed transactions, and a vanishingly-sm
MLong
EURUSD SHORTEURUSD is behaving like it going to go south for a little bit, let me explain,
The price as hit a very strong resistance, the 1.10 level, and is rejecting a couple other major chart elements,
I'm going to look for entries on H8 - H12 and D1 and help EURUSD get to the 1.04 - 1.05 Level first, then back to the 1.00 Level is further selling pressure
The reasons are the following :
1) Price has rejected the psycholigical level of 1.10
2) Price has retested and rejected the Trendline of a massi
Gold - Wanna Take a Breath?! Gold has been hit pretty hard by the rise of dollar since a couple of weeks.
It broke the ascending trendline it was in since november violently, without retesting it, falling like a rock all the way to the 1800s. But now could be the time for a little push up. It could either be a retracement if gold wants to print a downtrend, in what case we would go up to make a Lower low or even a double top. Or it could be a continuation of the uptrend. Both are possible, but for now, I'm gonna play the u
XAUUSD My analysis for rest of day : v2So here is my 2nd analysis using a separate set of 2 main tools and a 3rd which is sometimes switched out with any indicator I might come across and feel the urge to give it a try but otherwise its mainly EngulfingCandle and Fluid Trades - SMC
Anyone else use these indicators and if you have/are, what settings and assets do you find works best for you?
XShort
AU D Bullish Continuation Idea 1/22/23Price closed with a bullish engulfing candle on Friday. Looking for price to continue bullish after market open. Daily has come back and retested previous highs. Price may gap down at market open before continuing to go higher to take out previous highs.
(MarkUps1)