ETF
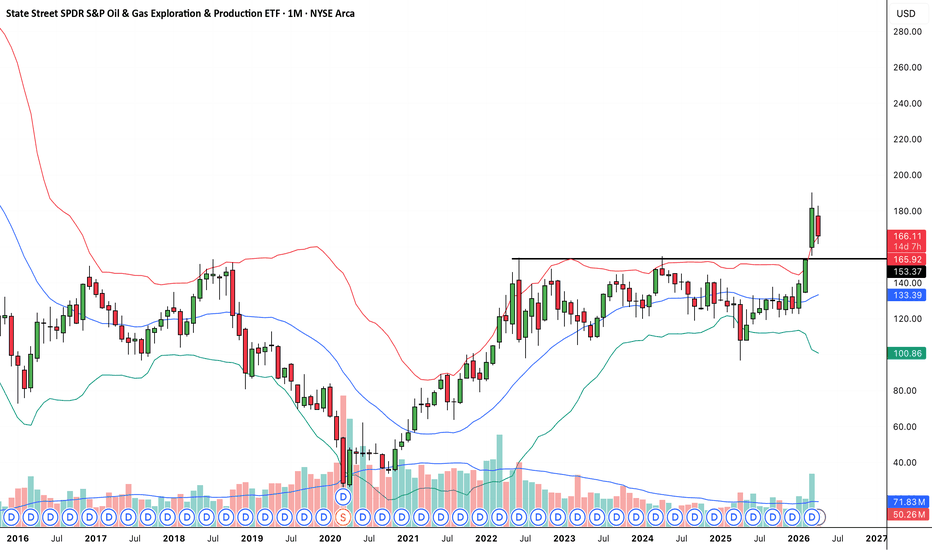
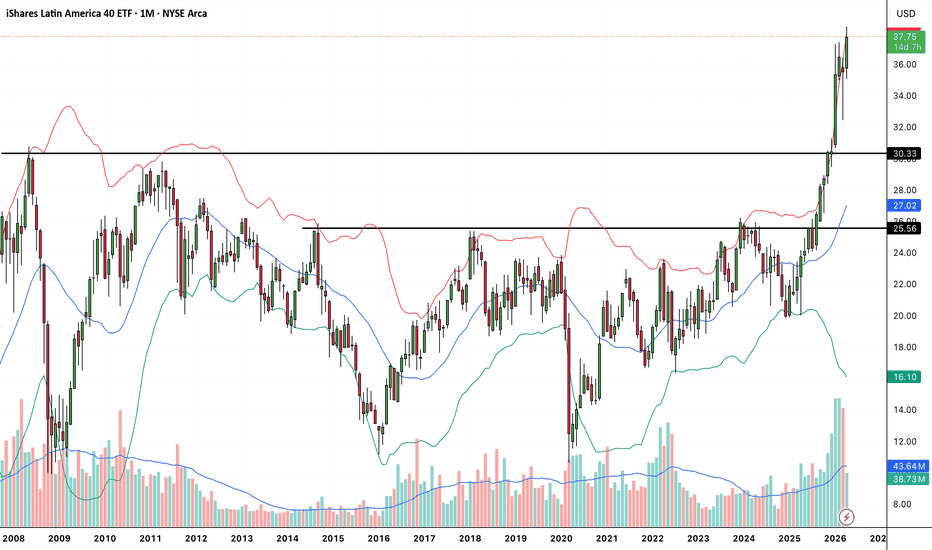
XOP - strong breakoutLooking at the AMEX:XOP monthly frame, the breakout above $153 is a significant shift in market character. Despite the recent red candle (profit-taking/mean reversion), the long-term trend has shifted from "sideways" to "up."
The 1M chart shows a classic rounding bottom/cup formation over 4 years. Is the market pricing in a tighter oil supply for the long haul?
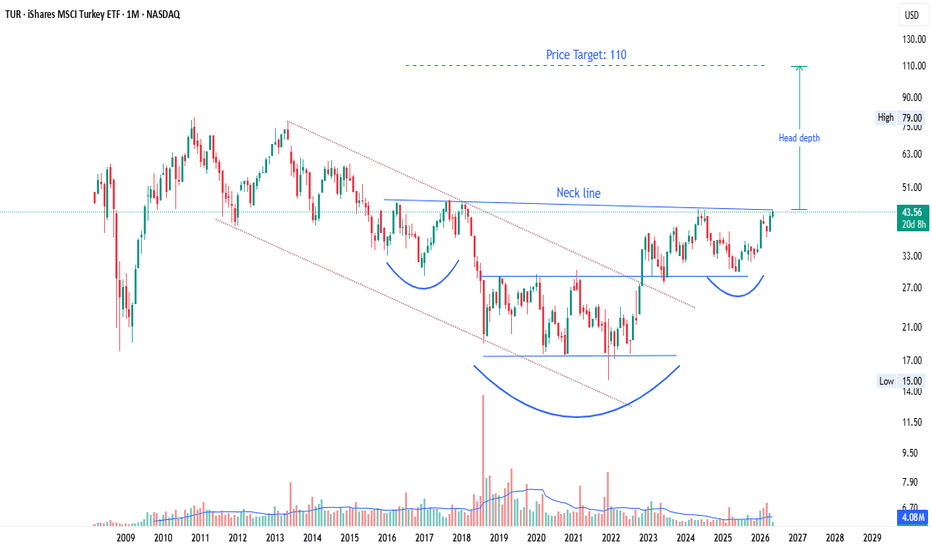
iShares MSCI Turkey ETF (TUR) | Massive Inverse H&S Monthly TFiShares MSCI Turkey ETF (TUR) | Massive Inverse H&S Bottom reversal on Monthly Chart 🇹🇷📈
The monthly chart of TUR is showing a strong long-term Inverse Head & Shoulders bottom reversal pattern, which could signal the beginning of a major bullish cycle after years of consolidation and downtrend.
The neckline zone around 43–44 has been tested multiple times and price is now attempting a decisive breakout. What makes this setup interesting is the huge multi-year base formation created between 2018–2026.
As the saying goes: “ The longer the base, the stronger the breakout and the directional move. ”
Here, the base has taken several years to form, which often leads to explosive moves once resistance is cleared convincingly.
Technical Structure:
Left Shoulder formed during 2018
Head created around 2020–2022 lows
Right Shoulder developing through 2024–2026
Neckline resistance near 43–44 zone
Breakout confirmation on sustained monthly close above neckline
Bullish Expectations:
If TUR manages a clean breakout and holds above the neckline, the pattern projection suggests a long-term upside move toward the 100–110 zone based on the head-depth measurement.
Key Levels:
Breakout Zone: 43–44
Support: 33 and 27
Long-Term Target: 100–110
Volume expansion near breakout levels would further strengthen the bullish case.
This is a high time-frame setup, so patience and confirmation are important. Monthly structures like these can lead to powerful trending moves once momentum kicks in.
If you like my ideas, please follow and share for more trade setups 🚀
⚠️ This is a technical analysis idea for educational purposes only, not financial advice. Please do your own research before making any trading decision.
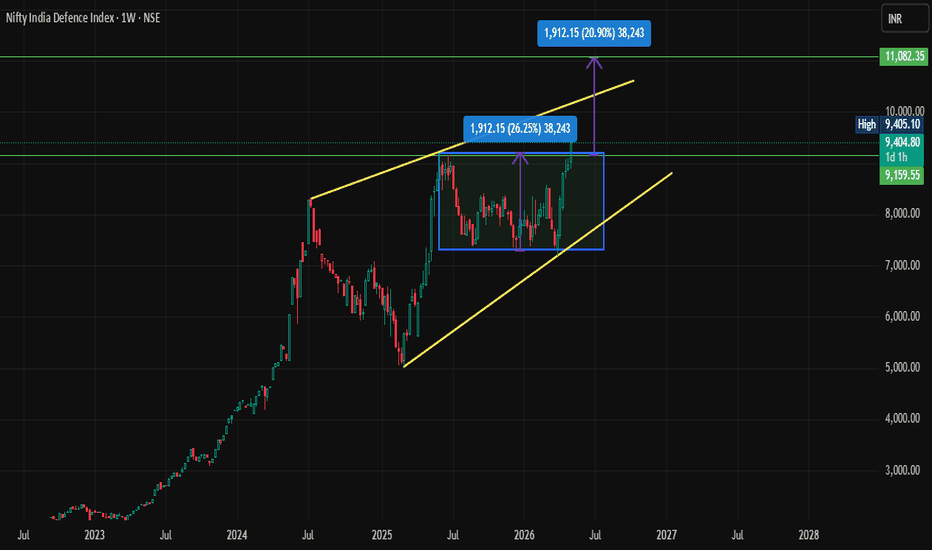
NIFTY DEFENSE very big break outNIfty Defense is giving very big break out on chart , rectangle break out can take this index to 20-22% higher from here aprox 11000 from 9300.
Many defense stocks also giving big break out , MZDOC, HAL,BDL etc.
I am not a SEBI-registered Investment Adviser or Research Analyst. The views expressed here are solely my personal opinions and for educational purposes. This is not a solicitation to trade. Investing in securities is subject to market risks; I assume no responsibility for any profit or loss arising from this post. I hold any position in the mentioned security.
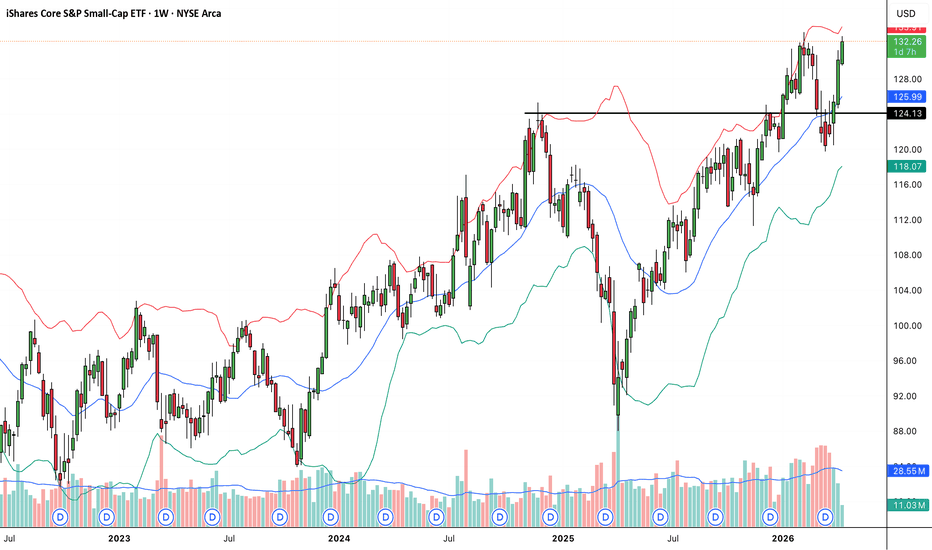
IJR - Small cap support bounce AMEX:IJR (S&P Small-Cap 600) is putting on a masterclass in "Support Turned Resistance Turned Support." After a long consolidation, we’ve cleared the key horizontal level at $124.13.
Notice the "Change of Polarity"—that previous peak from late 2024 is now acting as a floor. With the price riding above the 20-week moving average and the bands widening, the path of least resistance looks higher. 🚀
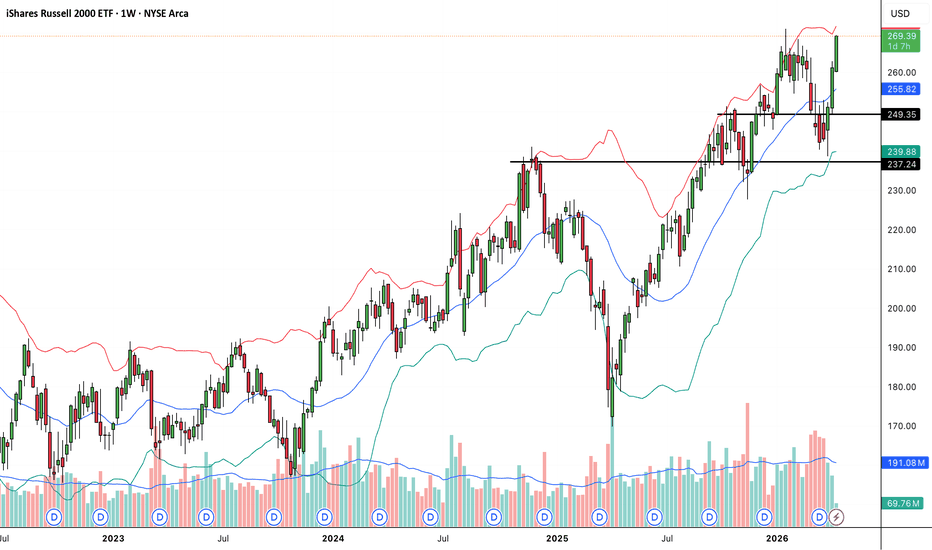
IWM - Strong bounceDespite the recent volatility, the Russell 2000 just staged a powerful recovery. Looking at the weekly chart, the $249 level has turned from a "ceiling" into a very strong "floor."
When small caps lead, it usually signals high risk-on sentiment in the broader market. With the price holding above the blue 20-week MA, the trend remains firmly to the upside. 🚀
Are you betting on a breakout to new highs this month? 📊
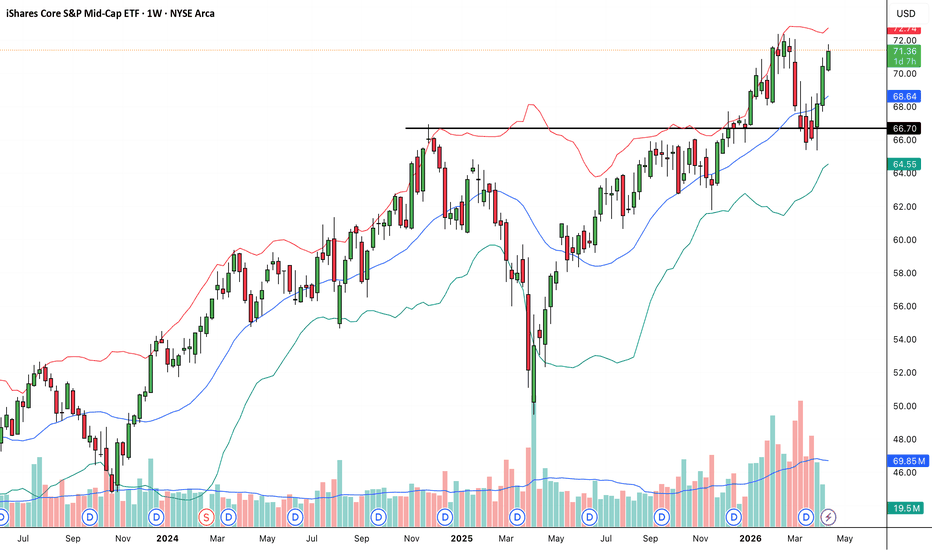
IJH - Bullish BounceWhile the market gets volatile, AMEX:IJH is holding its breakout level like a champ. This kind of base-building is exactly what you want to see for a healthy, long-term bull market.
This is a solid "Bullish Consolidation" chart for the iShares Core S&P Mid-Cap ETF ( AMEX:IJH ). It shows a classic breakout-retest-bounce sequence.
Key Level to watch: $66.70 (The Line in the Sand).
As long as this holds, the bulls are in control. 🐂
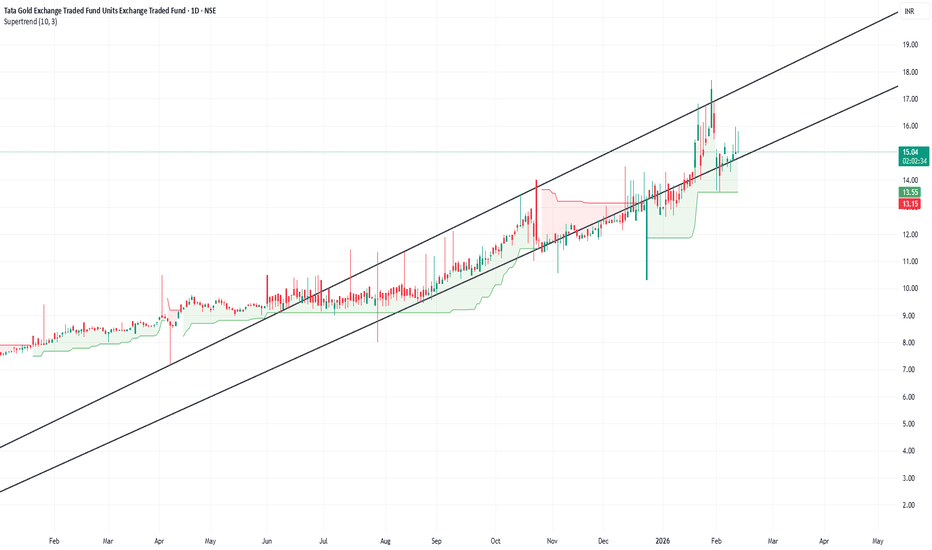
TATA GOLD Next StepGold and gold-linked ETFs can be sensitive to:
📉 Short-Term Risks
Profit booking after strong rallies (can cause dips).
Global macro data (e.g., US rate news, dollar strength) affecting gold prices.
Market corrections can continue before new trend emerges.
📈 Short-Term Positives
Safe-haven demand remains strong — especially with geopolitical uncertainty and inflation concerns.
Corrective pullbacks often become entry points for long-term investors.
Important: Short-term price moves are hard to predict — gold prices fluctuate from day to day based on macro news and technical traders’ behavior.
On my advise for all investors may be buy maximum lot size of #TATAGOLDETF for earn Maximum Return to year and year
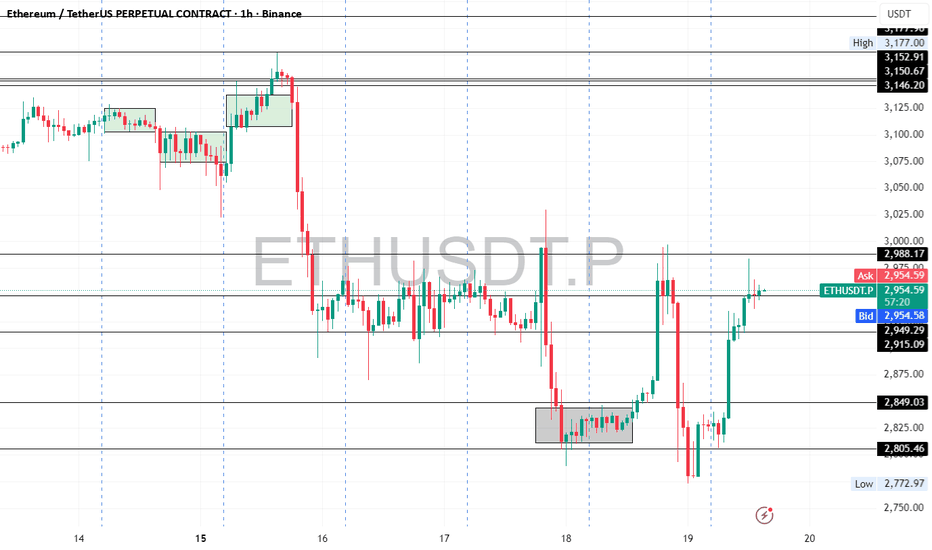
ETH UNDER PRESSURE - BREAKDOWN Ethereum slipped below the $3,000 support, following heavy selling in spot ETH ETFs. Net outflows hit $224.7M in a single day, the largest exit in weeks, extending total ETF selling to $286.5M over the past three days. Notably, BlackRock and Grayscale led the withdrawals, with zero inflows recorded across funds.
This breakdown triggered a liquidation cascade, wiping out nearly $168M in ETH long positions and driving price down toward the $2,895 zone.
📉 Technical View:
ETH remains under bearish pressure, forming a bearish flag while a confirmed death cross keeps downside risk elevated. Unless price reclaims resistance near $3,170, the structure points toward a potential move to the $2,620 support zone.
⚠️ Market Takeaway:
Momentum favors the downside for now. Bulls need a strong reclaim of key resistance to shift sentiment — otherwise, volatility remains skewed against longs.
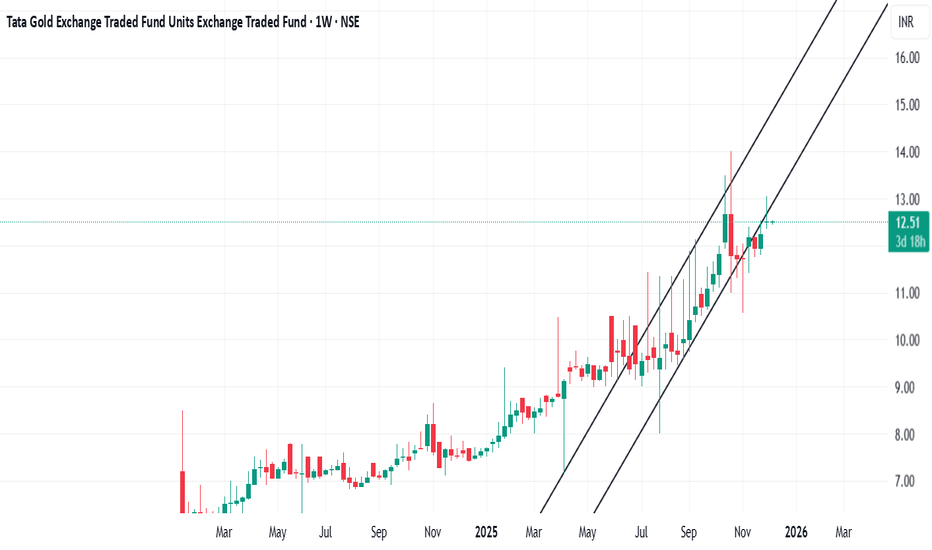
TATAGOLD What next do1. Over the last 3 months, the NAV of Tata Gold ETF rose from roughly ₹ ~10.20–10.90 (around early September 2025) to around ₹ 12.50 by early December 2025.
2. That implies a 3-month return of roughly +20–23%, which matches published data showing ~23-24% 3-month return.
3. The 52-week low was ~₹ 7.11 and high ~₹ 14.00 (or near that) — showing that the price nearly doubled from the low earlier in the 12-month period.
4. Recent momentum looks strong: after rising steadily from September to November, the ETF has seen consolidation around ₹12.4–12.6 levels in late November / early December — perhaps reflecting some profit booking or market hesitation
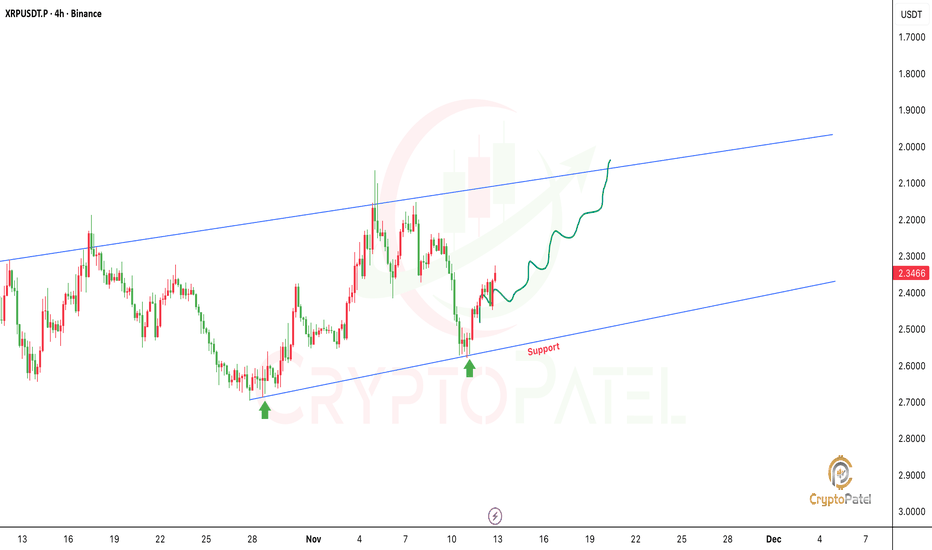
Breaking: XRP ETF to Launch on Nasdaq TomorrowBreaking: XRP ETF to Launch on Nasdaq Tomorrow
Big news for the CRYPTOCAP:XRP community!
Canary Capital has officially filed to list the first-ever Spot #XRPETF on the Nasdaq, trading under the ticker XRPC. If all goes as expected, trading could begin tomorrow.
This ETF will let U.S. investors get direct exposure to XRP through a regulated investment product, just like Bitcoin and Ethereum ETFs.
Why this matters:
🔹 It opens the doors for institutional investors to enter XRP legally and easily.
🔹 It could bring huge liquidity and more attention to the XRP ecosystem.
🔹 If the launch goes smoothly, it may spark a strong bullish move not only for XRP but also for the broader altcoin market.
Possible outcomes:
🔹 Positive: XRP price pumps as new money flows in.
🔹 Neutral: Market already priced it in.
🔹 Negative: Any delay or SEC hurdle could cause a short-term dip.
Overall, this launch could be a major milestone for XRP and the crypto market beyond BTC and ETH.
Keep your eyes on the charts tomorrow, The market reaction could be big!
NFA & DYOR
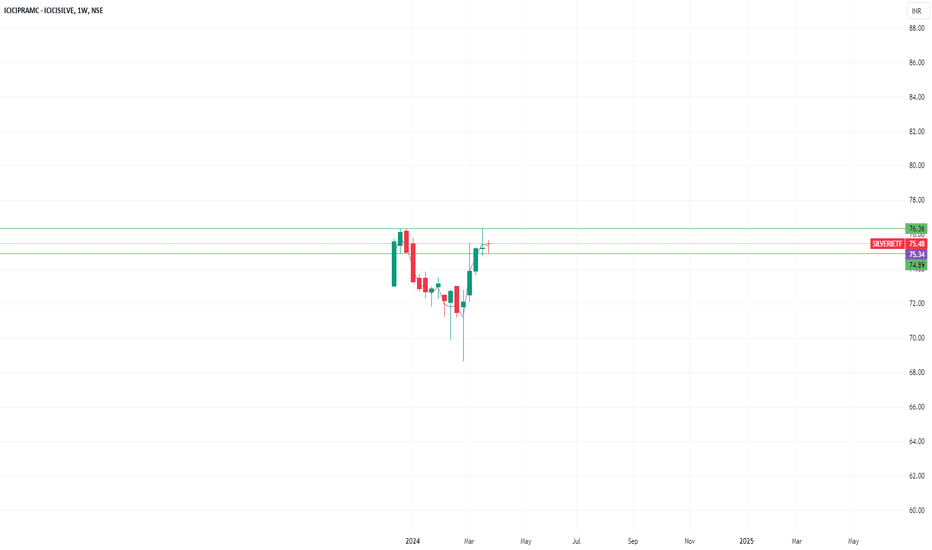
#SilverBees Doubled – Parabolic Move! #SilverBees
🚀 #SIP Strategy Delivers 💯%+ Returns 🥈🔥
On April 4, 2025 , suggested starting SIP in SilverBees at 89.72.
📉 The very next trading day , it dipped to 77.55 , a quick test of conviction.
📈 Since then, it’s been a parabolic rally to 180, with no looking back!
✅ Patience paid off
✅ SIP in commodities works, just like in stocks ( if started at the right time )
✅ Real assets like silver can be powerful wealth creators
⚠️ Going forward, be prepared for volatility.
After such a sharp move , price swings and corrections are normal. Stay disciplined and focus on your strategy.
🥈 Silver continues to shine. Are you riding the trend?
#SilverBees | #SilverETF | #Silver | #SIP | #ETF | #CommodityInvesting | #SmartInvesting
SILVERHello & welcome to this analysis
In the short term it appears to be under pressure mainly due to the strength seen in DXY.
In the medium to long term its in the completion of a very large breakout, we might not see the current price level for decades after 1-2 quarters of 2025
All the best for your Investing and Trading
IT Bees looks good for a positional medium-term play.#tradeideas #ITbees.
Looks good for a positional medium-term play.
-Nifty IT along with BN is supporting Nifty.
-IT sector shows resilience in this market fall.
- Positivity in US market (NASDAQ)
- Easy to get in and out. Good liquidity.
What could go wrong?
- Overall bearish sentiments in our market. If NIFTY were to fall further, IT would follow suit.
- Dependent on NASDAQ move, so pay close attention
to US markets.
Overall this is a low-risk setup. Risk is only 6.5-7%. Build positions sensibly. Risk management is key. Do not put all your money at once. And respect the SL. Building this position early because if we were to get a reversal soon then the rewards will be good. If the reversal is not sustained then our risk is still less.
This is just a view and chart shared for educational purposes only.
Midcap Momentum: Will Resistance Break or Bears Take Control?This chart depicts a technical analysis of the NIP IND ETF MIDCAP 150, likely with daily candlesticks. Here's a detailed breakdown:
### Key Observations:
1. **Support and Resistance Levels**:
- **R3 (Blue)**: Significant resistance near 220.82.
- **R2 (Green)**: Intermediate resistance around 215.99.
- **R1 (Orange)**: Support at 209.87.
- **S1 and S2 (Yellow and Purple)**: Further support levels at 204.00 and 199.79, respectively.
2. **200-Day SMA**:
- The blue line represents the 200-day Simple Moving Average (SMA) at 206.18, a crucial long-term trend indicator. The price is currently above the SMA, suggesting bullish momentum in the longer term.
3. **Price Action**:
- The price recently rebounded from a support zone near 204 and is now testing intermediate resistance levels.
- The formation of red candles near resistance (R2) indicates selling pressure, but a break above could indicate further upside potential.
4. **RSI Indicator**:
- The RSI (Relative Strength Index) at 39.20 is in the lower neutral zone, suggesting slight bearish momentum. However, it is rising, indicating potential recovery.
### Potential Outlook:
- **Bullish Scenario**:
- A close above 215.99 (R2) could lead to a retest of 220.82 (R3). Sustained momentum above R3 could indicate further upside.
- **Bearish Scenario**:
- Failure to hold above 209.87 (R1) might see the price revisit 204.00 (S1) or even 199.79 (S2).
### Recommendation:
- Monitor RSI and the price reaction near resistance levels.
- For a long trade, consider entering on a breakout above 215.99
- For a short trade, watch for a rejection at current levels and target supports near 204.00 or 200.
Would you like further analysis or specific trade setups based on this chart? Comment down