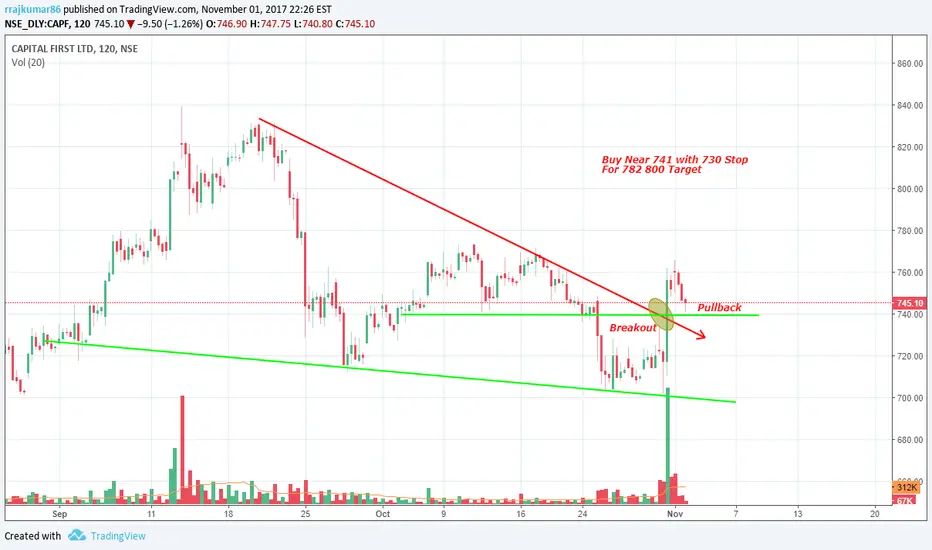
CAPF Falling WedgeFalling wedge pattern have been observed in CAPF, after breaking pull back have been done. Can initiate buy at 61.8 Fib levels with Stop below Fib 50% levelCLongby EatsleeprepeatUpdated 8
#OFSS - Falling WedgeOFSS has formed falling wedge pattern on weekly chart & looks like this time it will finally breakout and head upwards.Longby GSKASAR2
#INFRATEL - Falling Wedge on Weekly ChartINFRATEL has formed falling wedge pattern on weekly chart. Long looks only when upside breakout happens.ILongby GSKASARUpdated 1
Tata Motors: Falling WedgesNotes on the charts. Hit like if you think this information is useful. Trade Safe, stay healthy Best Regards Afraidtotradeby BravetotradeUpdated 4413
Falling Wedge on Tatasteel - Intraday RecomendationFalling Wedge pattern formation on Tatasteel and its for day trade only. Trade: Buy above - 560.00 Target 1 - 562.50 Target 2 - 565.00 Stop loss - 557.00by raj3eliteUpdated 5
ACC Cements having strength to go long...!Falling Wedge pattern formation on ACC and it will break only on long side but if does in other direction, consider as false breakout or pattern failure. Trade: Buy above - 1625 Target 1 - 1656 Target 2 - 1682 Target 3 - 1711 Stop loss - 1580Longby raj3eliteUpdated 7
Falling Wedge on SiemensFalling Wedge pattern formation on Siemens and it will break on upside. Trade: Buy above - 1345 Target 1 - 1365 Target 2 - 1387 Target 3 - 1405 Stop Loss - 1317 Longby raj3eliteUpdated 6
ARVIND - Will it be the beauty of Falling Wedge break-out?It seems in Daily chart a Falling Wedge pattern formed on NSE:ARVIND . Once it Brakes the resistance, we can expect a sharp bullish rally. Go long after the brake-out as in the chart, target 428, sl 356. (Note: Stock market investments are subject to market risks. Do Your own study before making any positions) Longby Santhosh_SUpdated 4
QuickHeal: Falling Wedge Pattern This is the Chart of Quick Heal on the daily scale, A falling Wedge pattern did appear and the Prices breaks out downward. Though Falling Wedges patterns are supposed to breakout upwards, but here it breaks out downward. This pattern forms over a period of approx 6 months. Break out came with a gap , hence signalling price may go down further. Support for the stock is at 210-209 levels. And if i look at harmonic pattern i could see a probability of Bat pattern ,suggesting a support zone near 211-210 levels Hence , one should keep an eye on these levels to determine the further price action in this stock by manuagarwal212
Eur Usd Trump Eyed 06-04-2017 (AP) Hello Fellas, The pair is still ranging in 60 pips. there is no clear direction on the pair. A break above 1.0690 would trigger 1.0733 then 1.0766 & 1.0799. on the flip side next support lies at 1.0620,1.0600,1.0590. Trade at the breakout of the falling wedge & the resistance trend line & confirming it with the RSI & the Bollinger band. Note: Everything works with Best money management. Note: Please leave comments for any query. Disclaimer: Trade at your own risk. Good Luck...!! Regards, Growing forex Team Longby GrowingForex7
Symmetric Triangle on SBI - NeutralSymmetric Triangle on SBI and it may break either side. one more formation called falling wedge ( combine with orange and top yellow line but it will break on top ( bullish). Moreover SBIN currently lying on Strong support and statement - MAKE or BREAK Levels for Long: (Make) Level 1 - 259 Level 2 - 265 Level 3 - 273 Levels for Short: (Break) Level 1 - 233 Level 2 - 223by raj3eliteUpdated 337
 Long
Long
 Long
Long Long
Long Long
Long

 Long
Long