XAUUSD – Bearish Pressure Holds Below Ichimoku And TrendlineMASON XAUUSD – Bearish Pressure Holds Below Ichimoku And Trendline
XAUUSD is trading around 3,980 after failing to recover strongly from the recent support area. Price remains below the Ichimoku structure and under the descending trendline, so the main bias is still bearish.
The priority view is to look for sell confirmation on pullbacks, especially if gold retests the sell order zone.
Technical View
Gold is still moving under bearish pressure. The recent recovery attempt failed to break the descending trendline, showing that buyers have not taken control of the structure yet.
Price is also trading below the Ichimoku resistance area. This supports the bearish view because the cloud and Ichimoku lines are still acting as dynamic resistance above price. As long as gold stays below this structure, every rebound should be treated as a correction.
The trendline is important because it continues to cap the upside. If price pulls back into the 3,998–4,018 sell order zone and rejects, this may confirm another lower high inside the bearish trend.
The 3,943 support is the first downside area to watch. If gold breaks below this level, selling pressure may continue toward the Fibonacci 1.618 area near 3,910.
The deeper bearish target is the Fibonacci extension zone around 3,810–3,825. This area becomes more realistic if gold breaks support cleanly and fails to recover above the sell zone.
Key Zones
Current price: 3,980
Sell order zone: 3,998–4,018
Short-term resistance: 4,018
Upper liquidity area: 4,037–4,064
Nearest support: 3,943
Fibonacci 1.618 target: 3,910
Fibonacci extension target: 3,810–3,825
Invalidation: above 4,064
Trading Plan
Sell Priority: 3,998–4,018
Condition: wait for bearish rejection, failed breakout above 4,018, or lower high formation below the descending trendline.
SL: above 4,064
TP1: 3,943
TP2: 3,910
TP3: 3,810–3,825
Alternative Scenario
If gold breaks below 3,943 directly, wait for a retest of this level as resistance before looking for sell continuation toward 3,910 and the Fibonacci extension target.
Buy View
Buy is not the priority while price stays below the Ichimoku structure and descending trendline. A buy setup only becomes safer if gold breaks above 4,064 and holds above the liquidity area.
Final View
Overall, gold remains in a bearish structure. The cleaner plan is to wait for price to retest the sell order zone, then watch for rejection. As long as 4,018–4,064 holds as resistance, the downside path toward 3,943, 3,910, and 3,810–3,825 remains in focus.
Will gold reject from the sell order zone first, or break support directly toward the Fibonacci extension target?
 Short
Short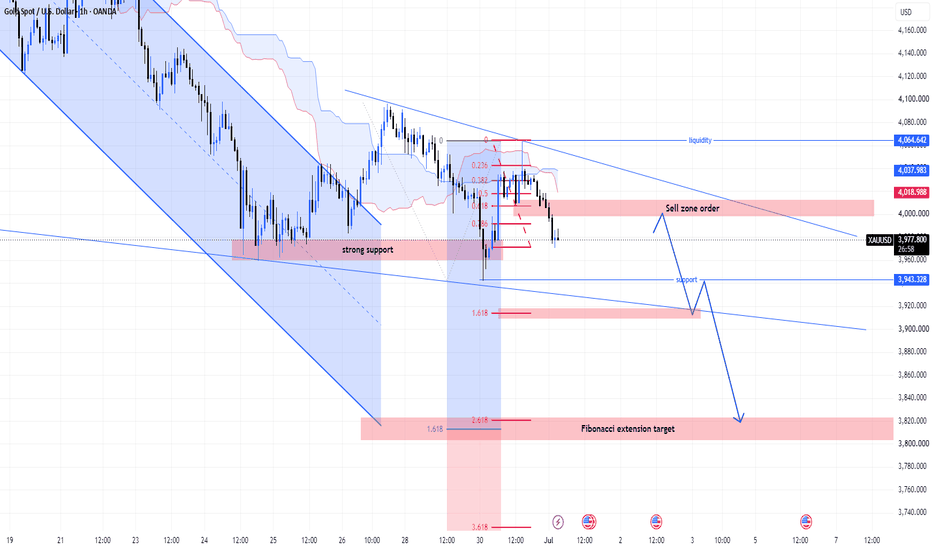
Has MCX Found a Temporary Top?MCX has given an incredible rally over the last few years, making it a star performer. However, the monthly chart now suggests that the stock might be entering a well-deserved resting phase. This is not a cause for panic, but rather a normal market cycle where a stock takes a break after a massive run-up.
The Technical Setup
Looking at the chart structure, the stock seems to have completed a classic five-wave upward journey. This move perfectly touched the upper boundary of its rising trend channel and faced resistance.
Right at the peak, we can see a shooting star candlestick pattern, followed by a solid red candle. This combination shows that the buyers are experiencing exhaustion at higher levels, and the sellers are gently stepping in to take control of the immediate trend.
The 19-Month Time Cycle
Many traders wonder if a correction can last long. History shows us that it can. If you look back at the previous major rest period between 2020 and 2022, the stock consolidated for exactly 19 months (578 days).
The current time cycle shows a striking similarity, projecting a quiet or sideways phase of around 576 days. While a year and a half sounds like a long time, in a monthly timeframe, it simply means the stock will likely trade in a broad, choppy range rather than falling in a straight line.
Key Support Levels to Watch
If this normal cooling-off phase continues, the chart points toward two primary mathematical support areas where the stock might find its floor:
The first major support rests around 1,855
The deeper structural support lies near 1,471
These levels align closely with the older, safer base channel, which can act as a strong accumulation zone for long-term investors.
The Invalidation Level
Every technical thesis must have a clear point where the idea no longer works. For this chart, the invalidation zone is strictly 3,480 . If the price reverses and breaks cleanly above this level, this entire cooling-off theory is canceled, signaling that the bulls have extended the rally to new heights.
Disclaimer: This post is for educational purposes only and is not financial advice. I am not a SEBI-registered analyst. Please do your own research and manage your risk carefully.  Short
Short
NIFTY Daily / Short Range Level Analysis for 01st Jul 2026🔕 SGMN SplD BULLISH Above => 23921.
🔕 SGMN SplD Bearish BELOW => 23814.
Mentioned analysis based on 2 consecutive candle close in 15 min Time Frame.
━━━━━🟥🟧🟨🟩🟦🟪⬛━━━━━
💥Level Interpretation / description:
✍🏻L#1: If the candle crossed & stays above the “Buy Gen”, it is treated / considered as Bullish bias. Cfm=> Confirmation.
L#2: Possibility / Probability of REVERSAL near 🔕RL/TF1 & 🔔RL/TF2
L#3: If the candle stays above “Sell Gen” but below “Buy Gen”, it is treated / considered as Sidewise. Aggressive Traders can take Long position near “Sell Gen” either retesting or crossed from Below & vice-versa i.e. can take Short position near “Buy Gen” either retesting or crossed downward from Above.
L#4: If the candle crossed & stays below the “Sell Gen”, it is treated / considered a Bearish bias.
L#5: Possibility / Probability of REVERSAL near 🔕RL/TF1 & 🔔RL/TF2
HZB (Buy side) & HZS (Sell side) => Hurdle Zone,
✍🏻 *** Specialty of “HZB#1, HZB#2 HZS#1 & HZS#2” is Sidewise (behaviour in Nature)
Rest Plotted and Mentioned on Chart
Color code Used:
Green, BLUE =. Positive bias.
Safron, RED =. Negative bias.
RED in Between Green means Trend Finder / Momentum Change
/ CYCLE Change and Vice Versa.
Notice One thing: HOW LEVELS are Working.
Use any Momentum Indicator / Oscillator or as you "USED to" to Take entry.
━━━━━🟥🟧🟨🟩🟦🟪⬛━━━━━
⚠️ DISCLAIMER:
The information, views, and ideas shared here are purely for educational and informational purposes only. They are not intended as investment advice or a recommendation to buy, sell, or hold any financial instruments. I am not a SEBI-registered financial adviser.
Trading and investing in the stock market involves risk, and you should do your own research and analysis. You are solely responsible for any decisions made based on this research.
"🔔As HARD EARNED MONEY IS YOUR's, So DECISION SHOULD HAVE TO BE YOUR's".
━━━━━🟥🟧🟨🟩🟦🟪⬛━━━━━
❇️ Follow notification about periodical View
💥 Do Comment for Stock WEEKLY Level Analysis.🚀
📊 Do you agree with this view?
✈️ HIT THE PLANE ICON if this technical observation resonates with you. It will Motivate me.
━━━━━🟥🟧🟨🟩🟦🟪⬛━━━━━
💡 If You LOOKING any CHART & want for Level and ANALYZE?
Share your desired stock names in the comments below! I will try to analyze the chart Levels, patterns and share my technical view (so far my Knowledge).
If Viewers think It can identify meaningful setups. Looking forward to hearing from all of you — let's keep this discussion going and help each other make better trading decisions.
___________🔕^^^⚫⚪^🙏🏼🙏🏼🙏🏼^⚪⚫^^^🔔___________ BANKNIFTY MONTHLY Exp. Level Analysis for 30th Jun 2026.🔕 SGMN SplD BULLISH Above => 57943.
🔕 SGMN SplD Bearish BELOW => 57522.
Mentioned analysis based on 2 consecutive candle close in 15 min Time Frame.
━━━━━🟥🟧🟨🟩🟦🟪⬛━━━━━
💥Level Interpretation / description:
✍🏻L#1: If the candle crossed & stays above the “Buy Gen”, it is treated / considered as Bullish bias. Cfm=> Confirmation.
L#2: Possibility / Probability of REVERSAL near 🔕RL/TF1 & 🔔RL/TF2
L#3: If the candle stays above “Sell Gen” but below “Buy Gen”, it is treated / considered as Sidewise. Aggressive Traders can take Long position near “Sell Gen” either retesting or crossed from Below & vice-versa i.e. can take Short position near “Buy Gen” either retesting or crossed downward from Above.
L#4: If the candle crossed & stays below the “Sell Gen”, it is treated / considered a Bearish bias.
L#5: Possibility / Probability of REVERSAL near 🔕RL/TF1 & 🔔RL/TF2
HZB (Buy side) & HZS (Sell side) => Hurdle Zone,
✍🏻 *** Specialty of “HZB#1, HZB#2 HZS#1 & HZS#2” is Sidewise (behaviour in Nature)
Rest Plotted and Mentioned on Chart
Color code Used:
Green, BLUE =. Positive bias.
Safron, RED =. Negative bias.
RED in Between Green means Trend Finder / Momentum Change
/ CYCLE Change and Vice Versa.
Notice One thing: HOW LEVELS are Working.
Use any Momentum Indicator / Oscillator or as you "USED to" to Take entry.
━━━━━🟥🟧🟨🟩🟦🟪⬛━━━━━
⚠️ DISCLAIMER:
The information, views, and ideas shared here are purely for educational and informational purposes only. They are not intended as investment advice or a recommendation to buy, sell, or hold any financial instruments. I am not a SEBI-registered financial adviser.
Trading and investing in the stock market involves risk, and you should do your own research and analysis. You are solely responsible for any decisions made based on this research.
"🔔As HARD EARNED MONEY IS YOUR's, So DECISION SHOULD HAVE TO BE YOUR's".
━━━━━🟥🟧🟨🟩🟦🟪⬛━━━━━
❇️ Follow notification about periodical View
💥 Do Comment for Stock WEEKLY Level Analysis.🚀
📊 Do you agree with this view?
✈️ HIT THE PLANE ICON if this technical observation resonates with you. It will Motivate me.
━━━━━🟥🟧🟨🟩🟦🟪⬛━━━━━
💡 If You LOOKING any CHART & want for Level and ANALYZE?
Share your desired stock names in the comments below! I will try to analyze the chart Levels, patterns and share my technical view (so far my Knowledge).
If Viewers think It can identify meaningful setups. Looking forward to hearing from all of you — let's keep this discussion going and help each other make better trading decisions.
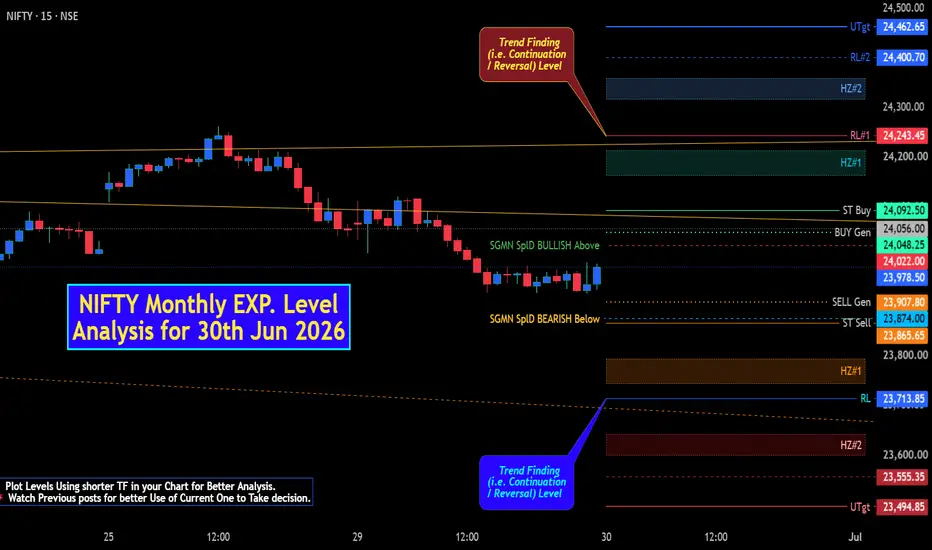
___________🔕^^^⚫⚪^🙏🏼🙏🏼🙏🏼^⚪⚫^^^🔔___________ NIFTY Monthly EXP. Level Analysis for 30th Jun 2026🔕 SGMN SplD BULLISH Above => 24022.
🔕 SGMN SplD Bearish BELOW => 23874.
Mentioned analysis based on 2 consecutive candle close in 15 min Time Frame.
━━━━━🟥🟧🟨🟩🟦🟪⬛━━━━━
💥Level Interpretation / description:
✍🏻L#1: If the candle crossed & stays above the “Buy Gen”, it is treated / considered as Bullish bias. Cfm=> Confirmation.
L#2: Possibility / Probability of REVERSAL near 🔕RL/TF1 & 🔔RL/TF2
L#3: If the candle stays above “Sell Gen” but below “Buy Gen”, it is treated / considered as Sidewise. Aggressive Traders can take Long position near “Sell Gen” either retesting or crossed from Below & vice-versa i.e. can take Short position near “Buy Gen” either retesting or crossed downward from Above.
L#4: If the candle crossed & stays below the “Sell Gen”, it is treated / considered a Bearish bias.
L#5: Possibility / Probability of REVERSAL near 🔕RL/TF1 & 🔔RL/TF2
HZB (Buy side) & HZS (Sell side) => Hurdle Zone,
✍🏻 *** Specialty of “HZB#1, HZB#2 HZS#1 & HZS#2” is Sidewise (behaviour in Nature)
Rest Plotted and Mentioned on Chart
Color code Used:
Green, BLUE =. Positive bias.
Safron, RED =. Negative bias.
RED in Between Green means Trend Finder / Momentum Change
/ CYCLE Change and Vice Versa.
Notice One thing: HOW LEVELS are Working.
Use any Momentum Indicator / Oscillator or as you "USED to" to Take entry.
━━━━━🟥🟧🟨🟩🟦🟪⬛━━━━━
⚠️ DISCLAIMER:
The information, views, and ideas shared here are purely for educational and informational purposes only. They are not intended as investment advice or a recommendation to buy, sell, or hold any financial instruments. I am not a SEBI-registered financial adviser.
Trading and investing in the stock market involves risk, and you should do your own research and analysis. You are solely responsible for any decisions made based on this research.
"🔔As HARD EARNED MONEY IS YOUR's, So DECISION SHOULD HAVE TO BE YOUR's".
━━━━━🟥🟧🟨🟩🟦🟪⬛━━━━━
❇️ Follow notification about periodical View
💥 Do Comment for Stock WEEKLY Level Analysis.🚀
📊 Do you agree with this view?
✈️ HIT THE PLANE ICON if this technical observation resonates with you. It will Motivate me.
━━━━━🟥🟧🟨🟩🟦🟪⬛━━━━━
💡 If You LOOKING any CHART & want for Level and ANALYZE?
Share your desired stock names in the comments below! I will try to analyze the chart Levels, patterns and share my technical view (so far my Knowledge).
If Viewers think It can identify meaningful setups. Looking forward to hearing from all of you — let's keep this discussion going and help each other make better trading decisions.
___________🔕^^^⚫⚪^🙏🏼🙏🏼🙏🏼^⚪⚫^^^🔔___________  Long
Long
 Long
Long
XAUUSD — Medium-Term Bearish Shift Below EMA Structure
Fundamental Analysis
Gold remains under pressure as the market continues to watch USD momentum, Treasury yields, and upcoming U.S. macro data.
For now, the medium-term structure is weakening. As long as gold trades below the main EMA area, recovery attempts should be treated as technical pullbacks rather than a full bullish reversal.
Technical Analysis
On the daily chart, XAUUSD is showing a clear medium-term bearish shift. After failing to hold the higher structure near the previous swing high, price started to move lower and is now trading below the EMA 34, EMA 89, and EMA 200 area.
The EMA structure is beginning to converge and turn downward. This is important because it suggests that the previous bullish momentum is losing control, while sellers are gradually taking over the medium-term direction.
Price is currently around 4,088 after reacting from the strong liquidity zone near 4,000. However, the bounce remains below the EMA resistance area, so the main plan is still to wait for a recovery into the value zone before looking for sell confirmation.
The key sell swing zone is around 4,307 - 4,352. This area aligns with the Fibonacci retracement zone, EMA resistance, broken trendline pressure, and previous market structure. If gold reaches this zone and rejects, the bearish continuation scenario becomes stronger.
The medium-term downside target remains the Fibonacci extension and liquidity zone around 3,481 - 3,462.
Important Key Levels
Current price area: 4,088
Strong liquidity zone: 3,980 - 4,000
Main sell swing zone: 4,307 - 4,352
EMA resistance area: 4,307 - 4,497
Key bearish invalidation: above 4,497
First downside target: 3,980 - 4,000
Medium-term target: 3,481 - 3,462
Trading Scenario
Main Sell Scenario
Entry: 4,307 - 4,352
Stop Loss: 4,497
Take Profit 1: 4,000
Take Profit 2: 3,800
Take Profit 3: 3,481 - 3,462
Sell Condition
The preferred setup is to wait for gold to recover into the 4,307 - 4,352 sell swing zone. This area is important because it combines EMA resistance, Fibonacci retracement, and the broken structure from the previous bearish move.
A sell setup becomes more valid if price forms bearish rejection from this zone, such as a long upper wick, bearish engulfing candle, failed breakout, or lower high below the EMA structure.
If price rejects from the sell zone and breaks back below 4,000, the medium-term bearish view becomes stronger. The next major downside focus would be the Fibonacci extension target around 3,481 - 3,462.
Entry Conditions
Wait for price to recover into 4,307 - 4,352.
Look for bearish rejection before entering sell.
Do not sell aggressively at the low without a pullback.
A break below 4,000 confirms stronger bearish pressure.
If price breaks and holds above 4,497, the sell setup is invalid.
Overall, the main view remains bearish while XAUUSD trades below the converging EMA structure. The preferred plan is to wait for a pullback into the EMA and Fibonacci value zone, then look for sell confirmation toward 4,000 and the medium-term target around 3,481 - 3,462.
Do you share the same medium-term bearish view on gold, or are you waiting for a cleaner rejection from the EMA value zone first?
Short 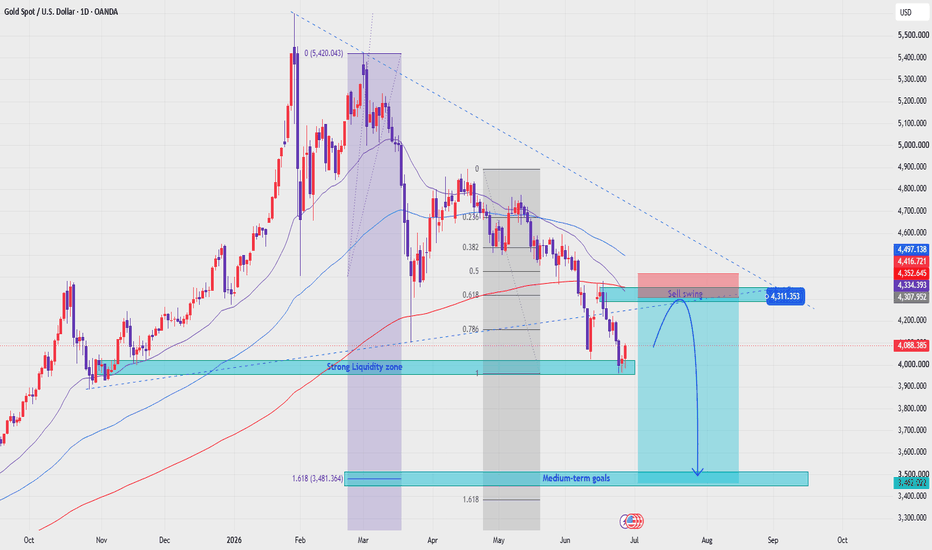
XAUUSD: ABC Wave Nears Fibonacci End ZoneGold is recovering from the recent lower base after completing a strong bearish sequence, and price is now developing an Elliott ABC structure. From Kelly’s view, the rebound is technically valid, but the market is approaching the zone where the ABC wave may complete around Fibonacci resistance.
The key idea is simple: gold can still push higher in the short term, but the strongest reaction may appear near the Fibonacci convergence area.
⟡ Market structure
The chart shows gold reacted from the lower accumulation area near 3,960–3,980, then started building a corrective recovery structure. Price is currently holding around the 4,011 buy zone and trying to continue higher from this base.
The nearest resistance sits around 4,044, while the more important reaction zone is the 4,069 area. If buyers can continue defending the buy zone, gold may extend towards the end of the ABC wave near 4,120.
However, this is still a corrective recovery inside a broader bearish environment, so each resistance zone should be treated carefully.
➤ Key levels
◌ 4,011: buy zone and short-term support
◌ 4,044: first reaction resistance
◌ 4,069: psychological resistance and sell scalping zone
◌ 4,120: Fibonacci confluence and possible end of ABC wave
◌ 3,980: lower reaction support
◌ Below 3,960: area where the ABC recovery setup weakens
⌁ Elliott Wave view
From an Elliott Wave perspective, gold appears to be forming an ABC corrective rebound after the previous bearish wave 5 ended near the lower zone.
Wave A pushed price away from the low and showed the first sign of seller exhaustion.
Wave B corrected back into the buy zone and held above the recent base.
Wave C may now be forming, with the upside path pointing towards 4,069 first and 4,120 as the stronger Fibonacci completion zone.
If wave C reaches the 4,069–4,120 resistance area and starts showing rejection, the ABC recovery may be close to completion.
▸ Trading scenario
Preferred scenario: wait for price to hold above the 4,011 buy zone and continue the ABC recovery.
Entry zone: 4,011–4,027 if bullish confirmation appears
Stop loss: below the confirmed reaction low or below 3,980
Take profit 1: 4,044
Take profit 2: 4,069
Take profit 3: 4,120
Alternative scenario: if gold fails to hold above 4,011 and breaks below 3,980, the ABC structure weakens. In that case, price may retest the lower accumulation zone before forming a new base.
⌁ Kelly’s view
For Kelly, this is a short-term ABC recovery structure, not a confirmed long-term bullish reversal. The buy zone is still holding, but the main focus is how price reacts around Fibonacci resistance.
If gold reaches 4,069–4,120 and sellers appear again, the ABC wave may be close to completion.
Gold is recovering from the lower base.
But structurally, the ABC wave may finish near the Fibonacci convergence zone.
Share your view below. Long 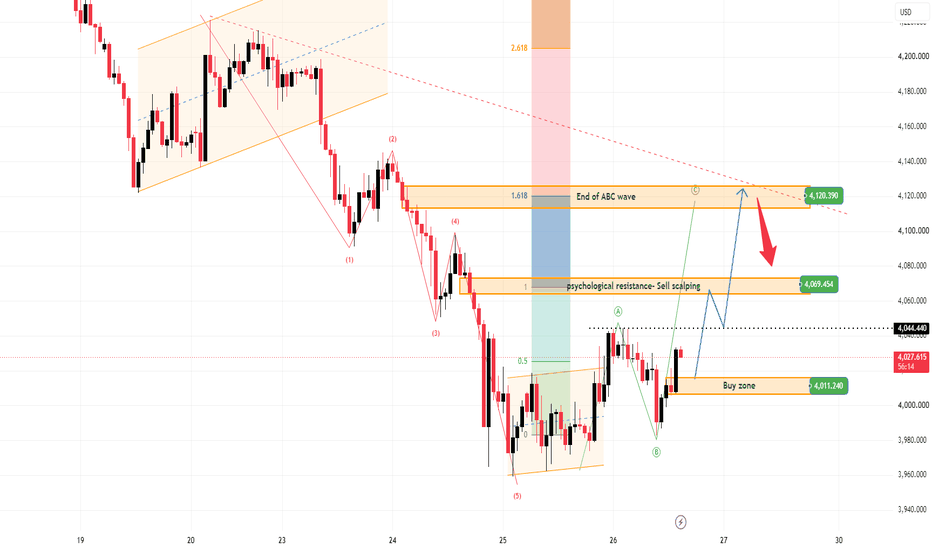
 Short
Short
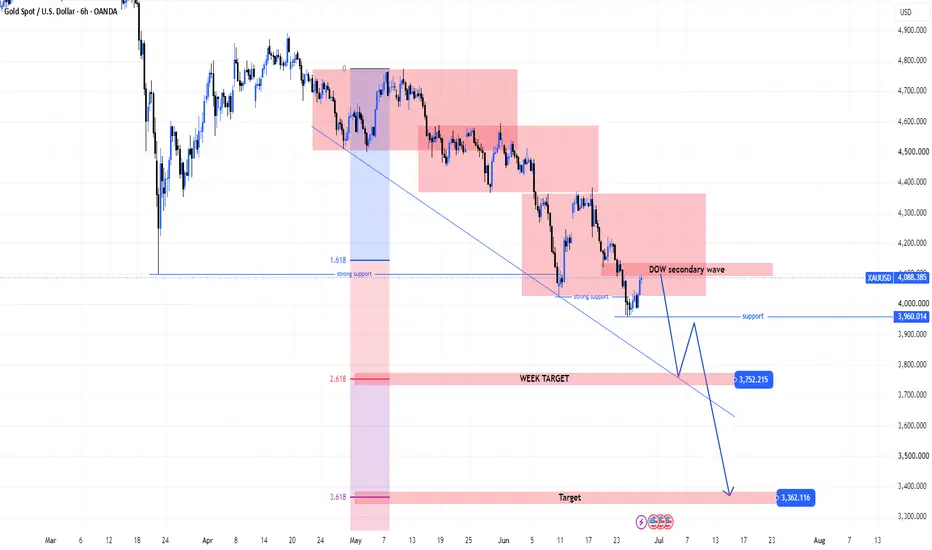
XAU- Medium-Term Bearish Structure Still Targets Lower LiquidityMASON XAUUSD – Medium-Term Bearish Structure Still Targets Lower Liquidity
XAUUSD is trading around 4,088 after recovering from the recent support area. Although gold is showing a short-term rebound, the medium-term structure remains bearish.
The main trend is still down, and any recovery toward resistance should be treated as a corrective wave unless price breaks back above the major supply structure.
Technical View
Gold is still moving inside a broad bearish structure. The chart shows a clear sequence of lower highs and lower lows from the previous top area, which means sellers are still controlling the medium-term direction.
The latest rebound from the 3,960 support zone is only a technical reaction for now. Price has not broken the main bearish structure, and the recovery is moving back into a previous supply area.
The zone around 4,080–4,130 is important because it sits near the marked DOW secondary wave area. If price fails here and forms bearish rejection, this zone may become the next lower high before another downside continuation.
The 3,960 level is the nearest key support. If gold breaks below this area again, the next downside target is the weekly target around 3,752. A deeper bearish continuation can open the way toward the major target near 3,362.
Fibonacci also supports the bearish roadmap. The 2.618 extension area near 3,752 is marked as the weekly target, while the 3.618 extension near 3,362 is the deeper medium-term target.
Key Zones
Current price: 4,088
Short-term resistance: 4,080–4,130
DOW secondary wave zone: 4,100–4,130
Key support: 3,960
Weekly bearish target: 3,752
Major medium-term target: 3,362
Invalidation for bearish continuation: above 4,350
Trading Plan
Sell Priority: 4,080–4,130
Condition: wait for bearish rejection, failed breakout, or lower high formation around the resistance zone.
SL: above 4,350
TP1: 3,960
TP2: 3,752
TP3: 3,362
Alternative Scenario
If gold breaks above 4,130 and holds, price may continue a deeper corrective rebound toward 4,300–4,350. However, this would still be a correction unless the market breaks the full bearish structure.
Buy View
Buy is not the priority in the medium-term view. A short-term buy reaction may appear above 3,960, but it should be managed as a corrective move, not a confirmed trend reversal.
Final View
Overall, gold remains in a medium-term bearish structure. The current rebound can continue slightly higher, but the cleaner view is to watch for rejection around 4,080–4,130. If 3,960 fails, the next downside focus will be 3,752, followed by the deeper target around 3,362.
Will gold reject from the secondary wave zone, or extend the correction before the next bearish move?
Short 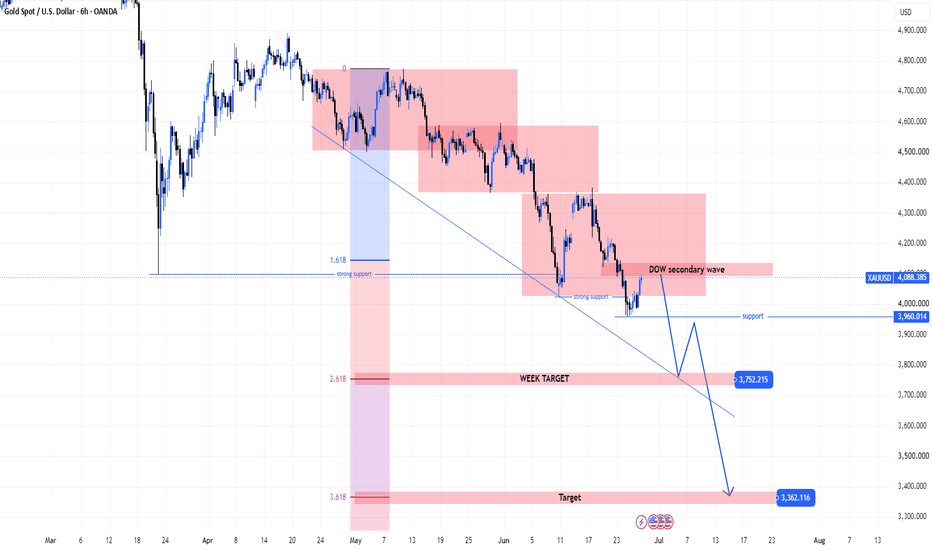
MASON XAUUSD – Important Rebound Zone AheadMASON XAUUSD – Gold May Rebound Toward Fibonacci Before Next Decision
XAUUSD is trading around 3,997 after a strong bearish move inside the descending channel. Price remains below the Ichimoku cloud, so the main structure is still bearish.
However, gold is reacting near the strong liquidity zone and buy area around 3,960–3,990, so a short corrective rebound may appear before the next trend confirmation.
Technical View
Gold is still moving inside a clear bearish channel. The market has been creating lower highs and lower lows, showing that sellers are still controlling the main structure.
Price is also below the Ichimoku cloud. This means the broader trend has not shifted bullish yet. Any recovery from the current zone should be treated as a correction unless price can break above the cloud and hold.
The current area around 3,960–3,990 is important because it combines the marked buy zone and strong liquidity support. Price reacting here shows that sellers may slow down in the short term.
If buyers defend this zone, gold may recover toward 4,040–4,050 first, then the Fibonacci and liquidity area around 4,118. This is the key rebound target to watch.
The stronger resistance remains near 4,216. If price reaches this zone and rejects, the bearish trend may continue again.
Key Zones
Current price: 3,997
Buy reaction zone: 3,960–3,990
Short-term confirmation: 4,040–4,050
Fibonacci & liquidity zone: 4,118
Strong resistance: 4,216
Invalidation for recovery: below 3,960
Trading Plan
Buy Recovery Priority: 3,960–3,990
Condition: wait for bullish rejection, higher low, or price holding above the strong liquidity zone.
SL: below 3,960
TP1: 4,040–4,050
TP2: 4,118
TP3: 4,216
Alternative Scenario
If gold breaks and holds above 4,050, wait for a retest before looking for continuation toward the Fibonacci liquidity zone at 4,118.
Sell View
Sell remains the main trend view while price stays below the Ichimoku cloud and inside the descending channel. A cleaner sell setup may appear if gold rejects from 4,118 or 4,216.
Final View
Overall, gold is still in a bearish structure, but the current liquidity zone may create a short corrective rebound. The key area to watch is 4,118, where Fibonacci and liquidity may decide the next move.
Will gold rebound toward the Fibonacci zone first, or break below the strong liquidity area directly?
Long 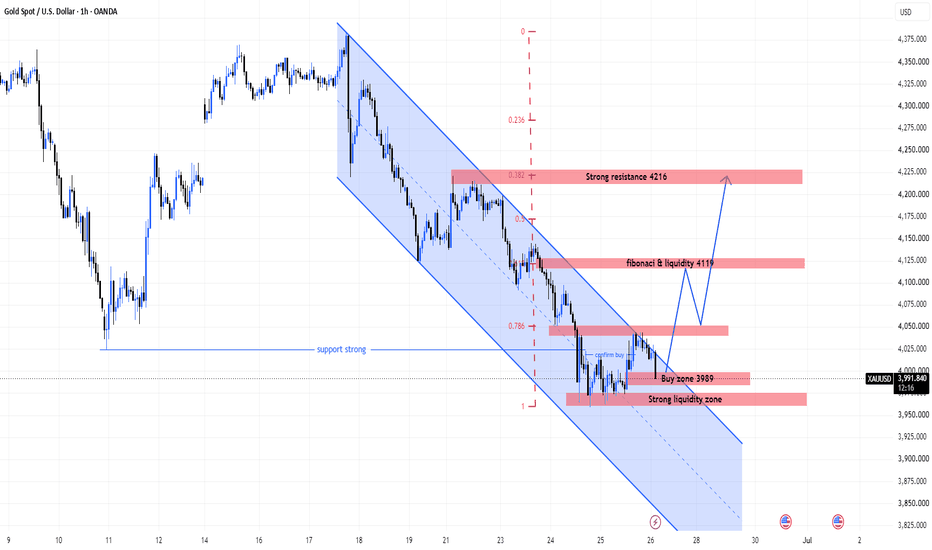
BANKNIFTY WEEKLY/ Pos[nal Level Analysis: 29th Jun-03rd Jul 2026BANKNIFTY WEEKLY/ Positional Level Analysis: 29th Jun-03rd Jul 2026
🔔 SGMN SplW Above BULLISH BIAS => 59021.
🔔 SGMN SplW BELOW Bearish BIAS => 57005.
Mentioned analysis based on 2 consecutive candle close in 15 min Time Frame.
━━━━━🟥🟧🟨🟩🟦🟪⬛━━━━━
💥Level Interpretation / description:
✍🏻L#1: If the candle crossed & stays above the “Buy Gen”, it is treated / considered as Bullish bias. Cfm=> Confirmation.
L#2: Possibility / Probability of REVERSAL near 🔕RL/TF1 & 🔔RL/TF2
L#3: If the candle stays above “Sell Gen” but below “Buy Gen”, it is treated / considered as Sidewise. Aggressive Traders can take Long position near “Sell Gen” either retesting or crossed from Below & vice-versa i.e. can take Short position near “Buy Gen” either retesting or crossed downward from Above.
L#4: If the candle crossed & stays below the “Sell Gen”, it is treated / considered a Bearish bias.
L#5: Possibility / Probability of REVERSAL near 🔕RL/TF1 & 🔔RL/TF2
HZB (Buy side) & HZS (Sell side) => Hurdle Zone,
✍🏻 *** Specialty of “HZB#1, HZB#2 HZS#1 & HZS#2” is Sidewise (behaviour in Nature)
Rest Plotted and Mentioned on Chart
Color code Used:
Green, BLUE =. Positive bias.
Safron, RED =. Negative bias.
RED in Between Green means Trend Finder / Momentum Change
/ CYCLE Change and Vice Versa.
Notice One thing: HOW LEVELS are Working.
Use any Momentum Indicator / Oscillator or as you "USED to" to Take entry.
━━━━━🟥🟧🟨🟩🟦🟪⬛━━━━━
⚠️ DISCLAIMER:
The information, views, and ideas shared here are purely for educational and informational purposes only. They are not intended as investment advice or a recommendation to buy, sell, or hold any financial instruments. I am not a SEBI-registered financial adviser.
Trading and investing in the stock market involves risk, and you should do your own research and analysis. You are solely responsible for any decisions made based on this research.
"🔔As HARD EARNED MONEY IS YOUR's, So DECISION SHOULD HAVE TO BE YOUR's".
━━━━━🟥🟧🟨🟩🟦🟪⬛━━━━━
❇️ Follow notification about periodical View
💥 Do Comment for Stock WEEKLY Level Analysis.🚀
📊 Do you agree with this view?
✈️ HIT THE PLANE ICON if this technical observation resonates with you. It will Motivate me.
━━━━━🟥🟧🟨🟩🟦🟪⬛━━━━━
💡 If You LOOKING any CHART & want for Level and ANALYZE?
Share your desired stock names in the comments below! I will try to analyze the chart Levels, patterns and share my technical view (so far my Knowledge).
If Viewers think It can identify meaningful setups. Looking forward to hearing from all of you — let's keep this discussion going and help each other make better trading decisions.
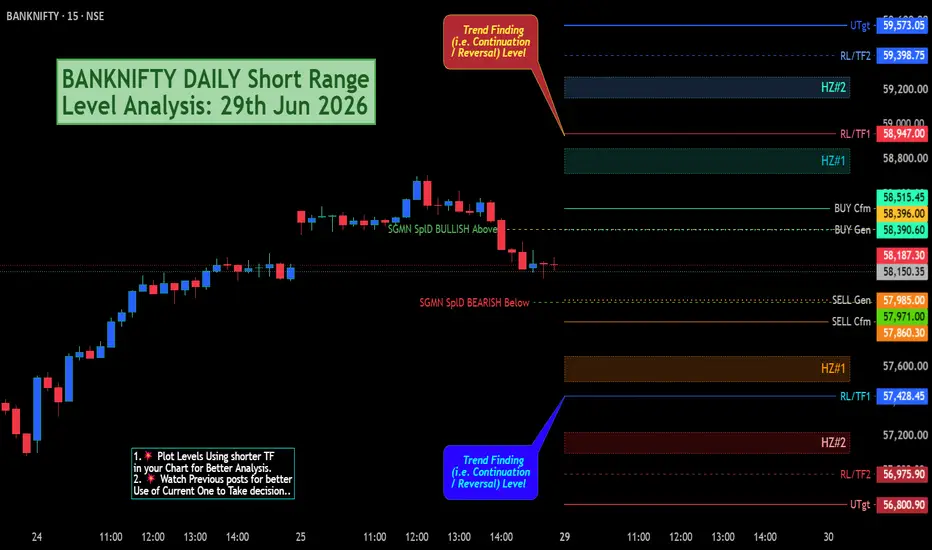
___________🔕^^^⚫⚪^🙏🏼🙏🏼🙏🏼^⚪⚫^^^🔔___________ BANKNIFTY DAILY Short Range Level Analysis: 29th Jun 2026🔕 SGMN SplD BULLISH Above => 58396.
🔕 SGMN SplD Bearish BELOW => 57971.
Mentioned analysis based on 2 consecutive candle close in 15 min Time Frame.
━━━━━🟥🟧🟨🟩🟦🟪⬛━━━━━
💥Level Interpretation / description:
✍🏻L#1: If the candle crossed & stays above the “Buy Gen”, it is treated / considered as Bullish bias. Cfm=> Confirmation.
L#2: Possibility / Probability of REVERSAL near 🔕RL/TF1 & 🔔RL/TF2
L#3: If the candle stays above “Sell Gen” but below “Buy Gen”, it is treated / considered as Sidewise. Aggressive Traders can take Long position near “Sell Gen” either retesting or crossed from Below & vice-versa i.e. can take Short position near “Buy Gen” either retesting or crossed downward from Above.
L#4: If the candle crossed & stays below the “Sell Gen”, it is treated / considered a Bearish bias.
L#5: Possibility / Probability of REVERSAL near 🔕RL/TF1 & 🔔RL/TF2
HZB (Buy side) & HZS (Sell side) => Hurdle Zone,
✍🏻 *** Specialty of “HZB#1, HZB#2 HZS#1 & HZS#2” is Sidewise (behaviour in Nature)
Rest Plotted and Mentioned on Chart
Color code Used:
Green, BLUE =. Positive bias.
Safron, RED =. Negative bias.
RED in Between Green means Trend Finder / Momentum Change
/ CYCLE Change and Vice Versa.
Notice One thing: HOW LEVELS are Working.
Use any Momentum Indicator / Oscillator or as you "USED to" to Take entry.
━━━━━🟥🟧🟨🟩🟦🟪⬛━━━━━
⚠️ DISCLAIMER:
The information, views, and ideas shared here are purely for educational and informational purposes only. They are not intended as investment advice or a recommendation to buy, sell, or hold any financial instruments. I am not a SEBI-registered financial adviser.
Trading and investing in the stock market involves risk, and you should do your own research and analysis. You are solely responsible for any decisions made based on this research.
"🔔As HARD EARNED MONEY IS YOUR's, So DECISION SHOULD HAVE TO BE YOUR's".
━━━━━🟥🟧🟨🟩🟦🟪⬛━━━━━
❇️ Follow notification about periodical View
💥 Do Comment for Stock WEEKLY Level Analysis.🚀
📊 Do you agree with this view?
✈️ HIT THE PLANE ICON if this technical observation resonates with you. It will Motivate me.
━━━━━🟥🟧🟨🟩🟦🟪⬛━━━━━
💡 If You LOOKING any CHART & want for Level and ANALYZE?
Share your desired stock names in the comments below! I will try to analyze the chart Levels, patterns and share my technical view (so far my Knowledge).
If Viewers think It can identify meaningful setups. Looking forward to hearing from all of you — let's keep this discussion going and help each other make better trading decisions.
___________🔕^^^⚫⚪^🙏🏼🙏🏼🙏🏼^⚪⚫^^^🔔___________ Reading Between the Tools: Fibonacci, Flip Zones and moreFibonacci Retracement
A tool that measures key levels (like 38.2%, 50%, 61.8%) between a significant high and low to identify where price may pause, react, or reverse during a pullback. It doesn't predict direction — it simply highlights mathematically significant zones traders watch.
Orange Zone — Supply/Demand Conversion
This marks a major flip zone, where a level that once acted as supply (resistance) has converted into demand (support), or vice versa. These zones often carry weight because they represent a shift in who's in control — sellers handing over to buyers, or the reverse.
Pattern Formations
Chart patterns are repeatable price structures — triangles, channels, flags, and similar shapes — that reflect how buyers and sellers are behaving over time. They help frame context, not certainty.
Counter-Trend Lines
These are trendlines drawn against the prevailing direction of the broader trend, used to track corrective moves or temporary pullbacks within a larger structure. They help separate noise from the main trend.
Trapped Trading
This refers to areas where a breakout or breakdown initially looks valid, draws in traders, and then reverses — leaving those traders "trapped" on the wrong side. Recognizing these zones helps explain why certain levels see outsized volume and volatility.
Disclaimer: This post is for educational and informational purposes only. It does not constitute financial advice, a forecast, or a recommendation to buy, sell, or hold any security. Please conduct your own research and consult a licensed financial advisor before making any investment decisions.  Long
Long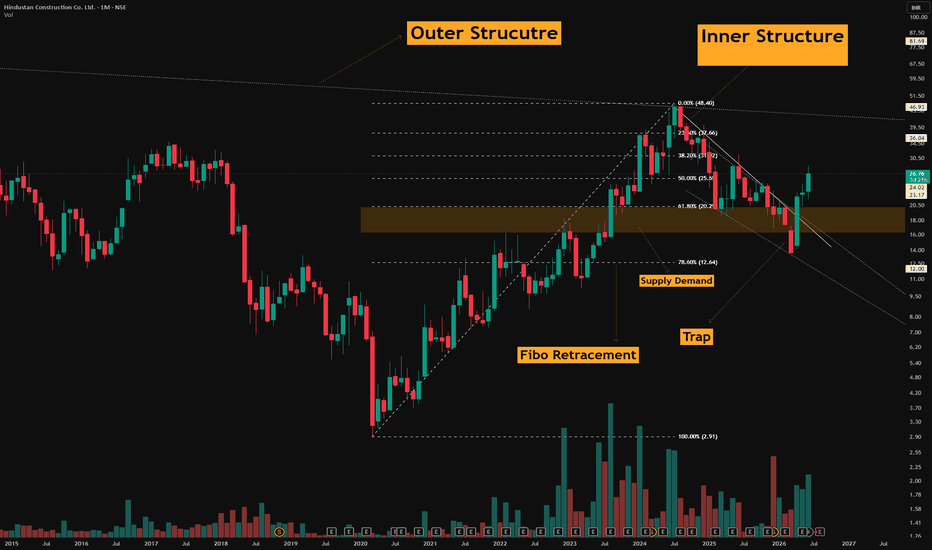
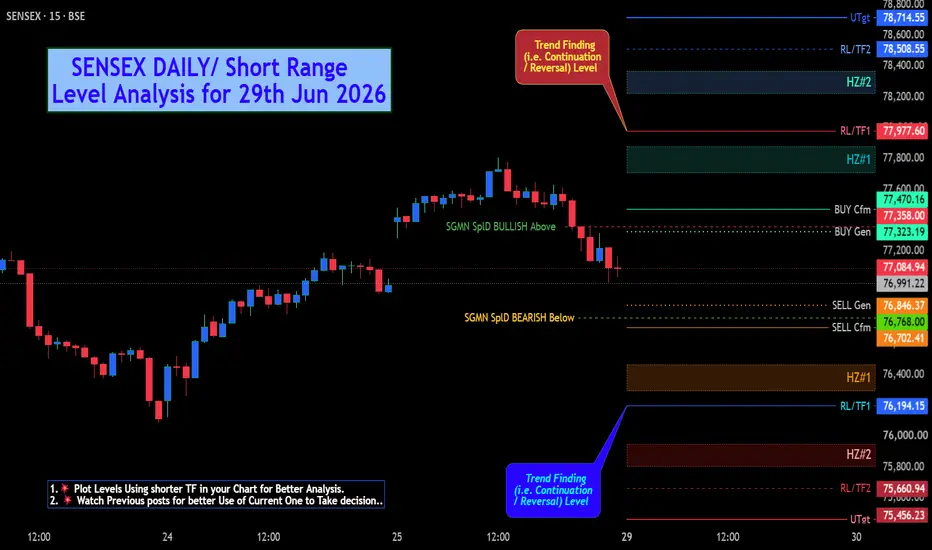
SENSEX DAILY/ Short Range Level Analysis for 29th Jun 2026🔕 SGMN SplD BULLISH Above => 77358.
🔕 SGMN SplD Bearish BELOW => 76768.
Mentioned analysis based on 2 consecutive candle close in 15 min Time Frame.
━━━━━🟥🟧🟨🟩🟦🟪⬛━━━━━
💥Level Interpretation / description:
✍🏻L#1: If the candle crossed & stays above the “Buy Gen”, it is treated / considered as Bullish bias. Cfm=> Confirmation.
L#2: Possibility / Probability of REVERSAL near 🔕RL/TF1 & 🔔RL/TF2
L#3: If the candle stays above “Sell Gen” but below “Buy Gen”, it is treated / considered as Sidewise. Aggressive Traders can take Long position near “Sell Gen” either retesting or crossed from Below & vice-versa i.e. can take Short position near “Buy Gen” either retesting or crossed downward from Above.
L#4: If the candle crossed & stays below the “Sell Gen”, it is treated / considered a Bearish bias.
L#5: Possibility / Probability of REVERSAL near 🔕RL/TF1 & 🔔RL/TF2
HZB (Buy side) & HZS (Sell side) => Hurdle Zone,
✍🏻 *** Specialty of “HZB#1, HZB#2 HZS#1 & HZS#2” is Sidewise (behaviour in Nature)
Rest Plotted and Mentioned on Chart
Color code Used:
Green, BLUE =. Positive bias.
Safron, RED =. Negative bias.
RED in Between Green means Trend Finder / Momentum Change
/ CYCLE Change and Vice Versa.
Notice One thing: HOW LEVELS are Working.
Use any Momentum Indicator / Oscillator or as you "USED to" to Take entry.
━━━━━🟥🟧🟨🟩🟦🟪⬛━━━━━
⚠️ DISCLAIMER:
The information, views, and ideas shared here are purely for educational and informational purposes only. They are not intended as investment advice or a recommendation to buy, sell, or hold any financial instruments. I am not a SEBI-registered financial adviser.
Trading and investing in the stock market involves risk, and you should do your own research and analysis. You are solely responsible for any decisions made based on this research.
"🔔As HARD EARNED MONEY IS YOUR's, So DECISION SHOULD HAVE TO BE YOUR's".
━━━━━🟥🟧🟨🟩🟦🟪⬛━━━━━
❇️ Follow notification about periodical View
💥 Do Comment for Stock WEEKLY Level Analysis.🚀
📊 Do you agree with this view?
✈️ HIT THE PLANE ICON if this technical observation resonates with you. It will Motivate me.
━━━━━🟥🟧🟨🟩🟦🟪⬛━━━━━
💡 If You LOOKING any CHART & want for Level and ANALYZE?
Share your desired stock names in the comments below! I will try to analyze the chart Levels, patterns and share my technical view (so far my Knowledge).
If Viewers think It can identify meaningful setups. Looking forward to hearing from all of you — let's keep this discussion going and help each other make better trading decisions.
___________🔕^^^⚫⚪^🙏🏼🙏🏼🙏🏼^⚪⚫^^^🔔___________ SENSEX WEEKLY/ Positional Level Analysis: 29th Jun-03rd Apr '26🔔 SGMN SplWP BULLISH Above => 77833
🔔 SGMN SplP BEARISH Below => 76217.
Mentioned analysis based on 2 consecutive candle close in 15 min Time Frame.
━━━━━🟥🟧🟨🟩🟦🟪⬛━━━━━
💥Level Interpretation / description:
✍🏻L#1: If the candle crossed & stays above the “Buy Gen”, it is treated / considered as Bullish bias. Cfm=> Confirmation.
L#2: Possibility / Probability of REVERSAL near 🔕RL/TF1 & 🔔RL/TF2
L#3: If the candle stays above “Sell Gen” but below “Buy Gen”, it is treated / considered as Sidewise. Aggressive Traders can take Long position near “Sell Gen” either retesting or crossed from Below & vice-versa i.e. can take Short position near “Buy Gen” either retesting or crossed downward from Above.
L#4: If the candle crossed & stays below the “Sell Gen”, it is treated / considered a Bearish bias.
L#5: Possibility / Probability of REVERSAL near 🔕RL/TF1 & 🔔RL/TF2
HZB (Buy side) & HZS (Sell side) => Hurdle Zone,
✍🏻 *** Specialty of “HZB#1, HZB#2 HZS#1 & HZS#2” is Sidewise (behaviour in Nature)
Rest Plotted and Mentioned on Chart
Color code Used:
Green, BLUE =. Positive bias.
Safron, RED =. Negative bias.
RED in Between Green means Trend Finder / Momentum Change
/ CYCLE Change and Vice Versa.
Notice One thing: HOW LEVELS are Working.
Use any Momentum Indicator / Oscillator or as you "USED to" to Take entry.
━━━━━🟥🟧🟨🟩🟦🟪⬛━━━━━
⚠️ DISCLAIMER:
The information, views, and ideas shared here are purely for educational and informational purposes only. They are not intended as investment advice or a recommendation to buy, sell, or hold any financial instruments. I am not a SEBI-registered financial adviser.
Trading and investing in the stock market involves risk, and you should do your own research and analysis. You are solely responsible for any decisions made based on this research.
"🔔As HARD EARNED MONEY IS YOUR's, So DECISION SHOULD HAVE TO BE YOUR's".
━━━━━🟥🟧🟨🟩🟦🟪⬛━━━━━
❇️ Follow notification about periodical View
💥 Do Comment for Stock WEEKLY Level Analysis.🚀
📊 Do you agree with this view?
✈️ HIT THE PLANE ICON if this technical observation resonates with you. It will Motivate me.
━━━━━🟥🟧🟨🟩🟦🟪⬛━━━━━
💡 If You LOOKING any CHART & want for Level and ANALYZE?
Share your desired stock names in the comments below! I will try to analyze the chart Levels, patterns and share my technical view (so far my Knowledge).
If Viewers think It can identify meaningful setups. Looking forward to hearing from all of you — let's keep this discussion going and help each other make better trading decisions.
___________🔕^^^⚫⚪^🙏🏼🙏🏼🙏🏼^⚪⚫^^^🔔___________
NIFTY DAILYY / Short Range Level Analysis for: 29th Jun 2026🔔 SGMN SplWP Above BULLISH BIAS => 24226
🔕 SGMN SplD BULLISH Above => 24131.
🔕 SGMN SplD Bearish BELOW => 23983.
🔔 SGMN SplWP BELOW Bearish BIAS => 23871.
Mentioned analysis based on 2 consecutive candle close in 15 min Time Frame.
━━━━━🟥🟧🟨🟩🟦🟪⬛━━━━━
💥Level Interpretation / description:
✍🏻L#1: If the candle crossed & stays above the “Buy Gen”, it is treated / considered as Bullish bias. Cfm=> Confirmation.
L#2: Possibility / Probability of REVERSAL near 🔕RL/TF1 & 🔔RL/TF2
L#3: If the candle stays above “Sell Gen” but below “Buy Gen”, it is treated / considered as Sidewise. Aggressive Traders can take Long position near “Sell Gen” either retesting or crossed from Below & vice-versa i.e. can take Short position near “Buy Gen” either retesting or crossed downward from Above.
L#4: If the candle crossed & stays below the “Sell Gen”, it is treated / considered a Bearish bias.
L#5: Possibility / Probability of REVERSAL near 🔕RL/TF1 & 🔔RL/TF2
HZB (Buy side) & HZS (Sell side) => Hurdle Zone,
✍🏻 *** Specialty of “HZB#1, HZB#2 HZS#1 & HZS#2” is Sidewise (behaviour in Nature)
Rest Plotted and Mentioned on Chart
Color code Used:
Green, BLUE =. Positive bias.
Safron, RED =. Negative bias.
RED in Between Green means Trend Finder / Momentum Change
/ CYCLE Change and Vice Versa.
Notice One thing: HOW LEVELS are Working.
Use any Momentum Indicator / Oscillator or as you "USED to" to Take entry.
━━━━━🟥🟧🟨🟩🟦🟪⬛━━━━━
⚠️ DISCLAIMER:
The information, views, and ideas shared here are purely for educational and informational purposes only. They are not intended as investment advice or a recommendation to buy, sell, or hold any financial instruments. I am not a SEBI-registered financial adviser.
Trading and investing in the stock market involves risk, and you should do your own research and analysis. You are solely responsible for any decisions made based on this research.
"🔔As HARD EARNED MONEY IS YOUR's, So DECISION SHOULD HAVE TO BE YOUR's".
━━━━━🟥🟧🟨🟩🟦🟪⬛━━━━━
❇️ Follow notification about periodical View
💥 Do Comment for Stock WEEKLY Level Analysis.🚀
📊 Do you agree with this view?
✈️ HIT THE PLANE ICON if this technical observation resonates with you. It will Motivate me.
━━━━━🟥🟧🟨🟩🟦🟪⬛━━━━━
💡 If You LOOKING any CHART & want for Level and ANALYZE?
Share your desired stock names in the comments below! I will try to analyze the chart Levels, patterns and share my technical view (so far my Knowledge).
If Viewers think It can identify meaningful setups. Looking forward to hearing from all of you — let's keep this discussion going and help each other make better trading decisions.
___________🔕^^^⚫⚪^🙏🏼🙏🏼🙏🏼^⚪⚫^^^🔔___________ NIFTY WEEKLY / Positional Level Analysis for: 29th Jun-03rd Apr 🔔 SGMN SplWP Above BULLISH BIAS => 24726.
🔔 SGMN SplWP BELOW Bearish BIAS => 23871.
Mentioned analysis based on 2 consecutive candle close in 15 min Time Frame.
━━━━━🟥🟧🟨🟩🟦🟪⬛━━━━━
💥Level Interpretation / description:
✍🏻L#1: If the candle crossed & stays above the “Buy Gen”, it is treated / considered as Bullish bias. Cfm=> Confirmation.
L#2: Possibility / Probability of REVERSAL near 🔕RL/TF1 & 🔔RL/TF2
L#3: If the candle stays above “Sell Gen” but below “Buy Gen”, it is treated / considered as Sidewise. Aggressive Traders can take Long position near “Sell Gen” either retesting or crossed from Below & vice-versa i.e. can take Short position near “Buy Gen” either retesting or crossed downward from Above.
L#4: If the candle crossed & stays below the “Sell Gen”, it is treated / considered a Bearish bias.
L#5: Possibility / Probability of REVERSAL near 🔕RL/TF1 & 🔔RL/TF2
HZB (Buy side) & HZS (Sell side) => Hurdle Zone,
✍🏻 *** Specialty of “HZB#1, HZB#2 HZS#1 & HZS#2” is Sidewise (behaviour in Nature)
Rest Plotted and Mentioned on Chart
Color code Used:
Green, BLUE =. Positive bias.
Safron, RED =. Negative bias.
RED in Between Green means Trend Finder / Momentum Change
/ CYCLE Change and Vice Versa.
Notice One thing: HOW LEVELS are Working.
Use any Momentum Indicator / Oscillator or as you "USED to" to Take entry.
━━━━━🟥🟧🟨🟩🟦🟪⬛━━━━━
⚠️ DISCLAIMER:
The information, views, and ideas shared here are purely for educational and informational purposes only. They are not intended as investment advice or a recommendation to buy, sell, or hold any financial instruments. I am not a SEBI-registered financial adviser.
Trading and investing in the stock market involves risk, and you should do your own research and analysis. You are solely responsible for any decisions made based on this research.
"🔔As HARD EARNED MONEY IS YOUR's, So DECISION SHOULD HAVE TO BE YOUR's".
━━━━━🟥🟧🟨🟩🟦🟪⬛━━━━━
❇️ Follow notification about periodical View
💥 Do Comment for Stock WEEKLY Level Analysis.🚀
📊 Do you agree with this view?
✈️ HIT THE PLANE ICON if this technical observation resonates with you. It will Motivate me.
━━━━━🟥🟧🟨🟩🟦🟪⬛━━━━━
💡 If You LOOKING any CHART & want for Level and ANALYZE?
Share your desired stock names in the comments below! I will try to analyze the chart Levels, patterns and share my technical view (so far my Knowledge).
If Viewers think It can identify meaningful setups. Looking forward to hearing from all of you — let's keep this discussion going and help each other make better trading decisions.
___________🔕^^^⚫⚪^🙏🏼🙏🏼🙏🏼^⚪⚫^^^🔔___________ The Psychology Behind FibonacciAsk ten traders how they identify potential reversal zones, and chances are several of them will mention the Fibonacci Retracement tool.
Whether they trade stocks, forex, cryptocurrencies, or commodities, Fibonacci levels appear on charts across every financial market.
This naturally raises an interesting question.
Why do Fibonacci levels seem to work?
Is there something magical about the numbers?
Or is something else happening beneath the surface?
The truth is that Fibonacci is less about mathematics and more about human behavior.
Markets don't react because of the tool itself. They react because thousands of traders around the world are watching the same levels and making decisions based on them.
Fibonacci Is a Framework, Not a Prediction
Many beginners believe Fibonacci can predict exactly where price will reverse.
It can't.
Instead, Fibonacci helps traders identify areas where buyers and sellers may become active.
Levels such as 38.2%, 50%, and 61.8% are not guarantees.
They are simply zones where market participants often pause, take profits, or look for new opportunities.
Thinking of Fibonacci as a decision-making framework rather than a prediction tool changes the way you use it.
Why Everyone Watches the Same Levels
Financial markets are driven by expectations.
When enough traders expect price to react near a particular level, many of them place orders around that area.
Some traders look for buying opportunities.
Others take profits.
Some reduce risk, while others prepare for reversals.
As more orders gather around the same price zone, the probability of a reaction naturally increases.
In many ways, Fibonacci becomes a self-fulfilling concept.
It works not because markets obey mathematics, but because traders collectively pay attention to it.
The Role of Fear and Greed
Imagine a strong bullish trend.
Price begins pulling back.
Some traders become nervous and close profitable positions.
Others patiently wait for a retracement before buying.
When price reaches a commonly watched Fibonacci level, both groups become active.
One side is taking profits.
The other is entering new trades.
This interaction between fear and opportunity often creates the reactions traders observe on their charts.
The same emotional process occurs during bearish markets.
Fibonacci Works Best with Market Context
One of the biggest mistakes traders make is drawing Fibonacci on every price swing they see.
Without context, the tool loses much of its value.
Experienced traders rarely use Fibonacci in isolation.
Instead, they combine it with:
* Support and resistance
* Trend analysis
* Market structure
* Candlestick confirmation
* Volume
* Price action
When multiple factors point to the same area, confidence in the setup naturally increases.
This is known as confluence.
The Importance of Patience
Another common misconception is that price must reverse the moment it touches a Fibonacci level.
Markets are rarely that precise.
Sometimes price reacts immediately.
Other times it moves slightly beyond the level before reversing.
This is why patient traders wait for confirmation instead of blindly placing trades.
The Fibonacci level identifies an area of interest.
Price action confirms whether buyers or sellers are actually taking control.
Fibonacci Reflects Crowd Behavior
Perhaps the greatest strength of Fibonacci is not the numbers themselves.
It is what those numbers represent.
They reveal where traders are likely to become interested.
Where profits may be taken.
Where emotions begin to change.
And where the balance between buyers and sellers may temporarily shift.
Understanding this psychological perspective helps traders avoid treating Fibonacci as a magical indicator.
Instead, it becomes a tool for understanding market behavior.
Final words:
Fibonacci is not a secret formula for predicting the future.
It is a way of identifying areas where human decisions are most likely to influence price.
The levels themselves are only part of the story.
The real story is the psychology behind them.
Because every retracement, every bounce, and every reversal begins with traders making decisions.
And in the financial markets, understanding people is often more valuable than memorizing numbers.
 Education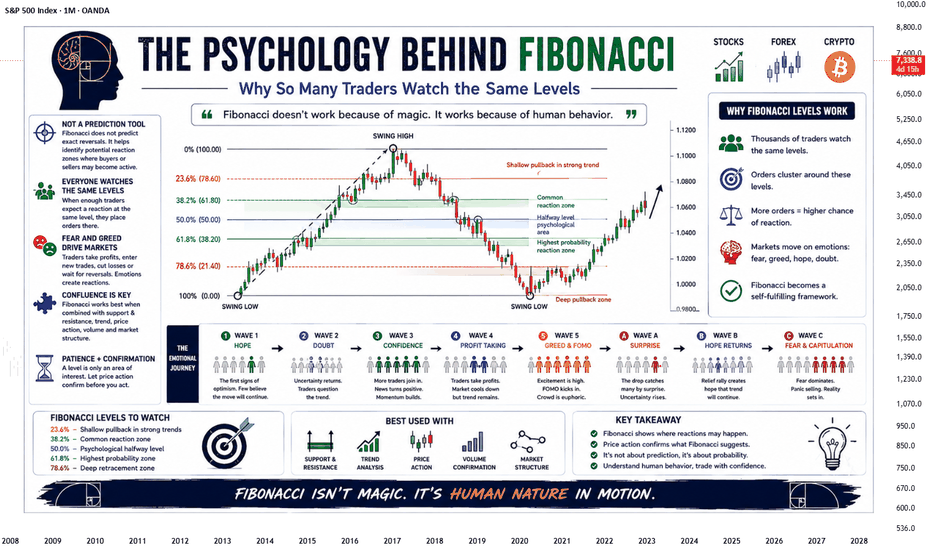
XAUUSD — EMA Downtrend, Waiting for a Value Pullback
Fundamental Analysis
Gold remains under bearish pressure as price continues to trade below the main EMA structure. Traders are still watching USD momentum, Treasury yields, and upcoming U.S. macro data.
For now, any short-term recovery should be treated as a technical pullback unless price can reclaim the EMA resistance zone with strong confirmation.
Technical Analysis
On the 2H chart, XAUUSD is still trading below EMA 34, EMA 89, and EMA 200. This confirms that the main trend remains bearish, with the EMA structure acting as dynamic resistance above price.
Price is currently around 4,003 after rejecting from the previous recovery area. The chart shows that gold may create a small corrective bounce toward the EMA value zone before continuing lower.
The first sell reaction area is around 4,045 - 4,060. A deeper pullback may reach the stronger sell swing zone around 4,078 - 4,088. If price rejects from these areas, sellers may continue to control the structure.
The main downside target is the psychological liquidity zone around 3,936 - 3,935.
Important Key Levels
Current price area: 4,003
EMA value zone: 4,045 - 4,060
Sell scalping zone: 4,059 - 4,078
Sell swing zone: 4,078 - 4,088
EMA resistance area: 4,044 - 4,126
Invalidation area: above 4,116 - 4,126
Main downside target: 3,936 - 3,935
Trading Scenario
Main Sell Scenario
Entry: 4,059 - 4,088
Stop Loss: 4,126
Take Profit 1: 4,003
Take Profit 2: 3,960
Take Profit 3: 3,936 - 3,935
Sell Condition
The preferred setup is to wait for gold to correct higher into the 4,059 - 4,088 value zone. This area aligns with the EMA reaction zone, Fibonacci structure, and previous sell pressure.
A sell setup becomes more valid if price forms bearish rejection from this zone, such as a long upper wick, bearish engulfing candle, failed breakout, or lower high below the EMA structure.
If price rejects from the sell zone and breaks back below 4,003, the bearish continuation view becomes stronger. The next downside focus would be 3,960, followed by the psychological liquidity target around 3,936 - 3,935.
Entry Conditions
Wait for price to pull back into 4,059 - 4,088.
Look for bearish rejection before entering sell.
Do not sell aggressively at the low without a pullback.
A break below 4,003 confirms stronger downside pressure.
If price breaks and holds above 4,126, the sell setup is invalid.
Overall, the main view remains bearish while XAUUSD trades below EMA 34, EMA 89, and EMA 200. Gold may create a light corrective bounce first, but the preferred plan is to wait for a reaction from the EMA value zone before looking for continuation toward 3,936 - 3,935.
Do you share the same bearish view on gold, or are you waiting for a cleaner pullback into the EMA value zone first?
Short 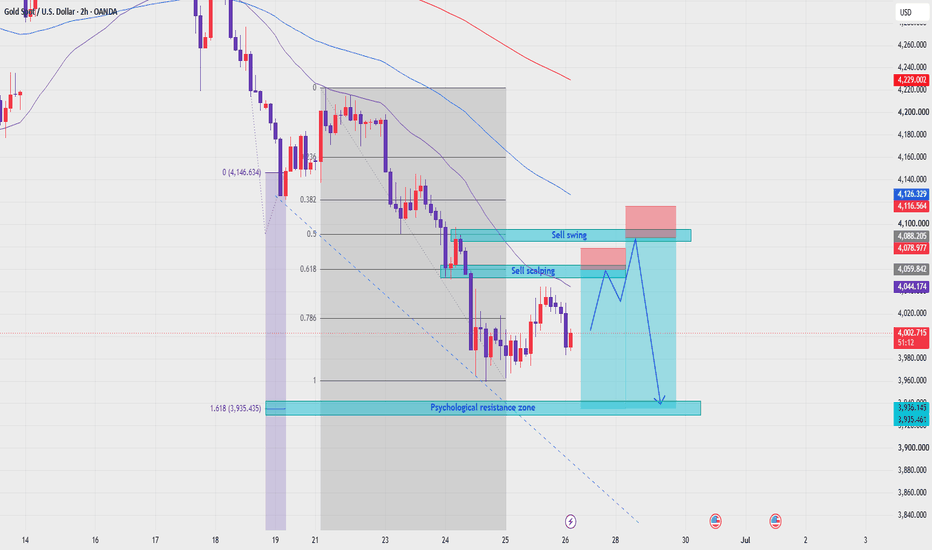
GBPUSD — EMA Bearish Trend, Sell From Fibonacci Confluence
Fundamental Analysis
GBPUSD remains under pressure as traders continue to watch USD momentum, U.K. data, and broader market risk sentiment.
For now, the technical structure still favours sellers while price trades below the main EMA range. Any recovery should be treated as a corrective pullback unless GBPUSD can reclaim the key resistance zone with strong confirmation.
Technical Analysis
On the 1H chart, GBPUSD is still trading below EMA 34, EMA 89, and EMA 200. This confirms that the short-term trend remains bearish, with the EMA structure acting as dynamic resistance above price.
Price is currently around 1.3178 after a short recovery from the lower area. However, this recovery is moving toward a key sell zone around 1.3206 - 1.3210.
This zone is important because it aligns with Fibonacci retracement, the descending trendline, previous structure, and the EMA bearish pressure. If price reaches this area and rejects, sellers may continue to control the next move.
The downside target is placed around the Fibonacci confluence zone near 1.3062 - 1.3058. This is the main bearish target shown on the chart if the sell continuation setup develops.
Important Key Levels
Current price area: 1.3178
Main sell zone: 1.3206 - 1.3210
Fibonacci + trendline confluence: 1.3206 - 1.3210
EMA resistance area: 1.3206 - 1.3260
Short-term resistance: 1.3260 - 1.3267
Near support: 1.3160 - 1.3170
Main Fibonacci target zone: 1.3062 - 1.3058
Invalidation area: above 1.3267
Trading Scenario
Main Sell Scenario
Entry: 1.3206 - 1.3210
Stop Loss: 1.3267
Take Profit 1: 1.3160
Take Profit 2: 1.3120
Take Profit 3: 1.3062 - 1.3058
Sell Condition
The preferred setup is to wait for GBPUSD to pull back into the 1.3206 - 1.3210 sell zone. This area combines Fibonacci retracement, trendline resistance, and EMA bearish pressure.
A sell setup becomes more valid if price forms bearish rejection from this zone, such as a long upper wick, bearish engulfing candle, failed breakout, or lower high below the EMA structure.
If price rejects from the sell zone and breaks below 1.3160, the bearish continuation view becomes stronger. The next downside focus would be 1.3120, followed by the Fibonacci confluence target around 1.3062 - 1.3058.
Entry Conditions
Wait for price to retest 1.3206 - 1.3210.
Look for bearish rejection before entering sell.
A break below 1.3160 confirms stronger downside pressure.
If price breaks and holds above 1.3267, the sell setup is invalid.
Overall, the main view remains bearish while GBPUSD trades below EMA 34, EMA 89, EMA 200, and the descending trendline. The preferred plan is to wait for a pullback into the Fibonacci and trendline confluence zone, then look for sell confirmation toward 1.3160, 1.3120, and 1.3062 - 1.3058.
Do you share the same bearish view on GBPUSD, or are you waiting for a cleaner rejection from the Fibonacci confluence zone?
EURUSD — EMA Bearish Trend, Sell From Value Zone
Fundamental Analysis
EURUSD remains under bearish pressure as price continues to trade below the main EMA structure. Traders are still watching USD momentum, Fed expectations, and upcoming macro data.
For now, the technical structure still favours sellers while recovery attempts remain limited below EMA resistance.
Technical Analysis
On the 2H chart, EURUSD is trading below EMA 34, EMA 89, and EMA 200. This shows that the short-term trend remains bearish, with the EMA structure acting as dynamic resistance above price.
Price is currently around 1.1352 after a strong bearish move. The market is now consolidating below the previous breakdown area, but this reaction has not confirmed a bullish reversal.
The key sell value zone is around 1.1384 - 1.1405. This area aligns with the Fibonacci retracement zone, high liquidity area, and previous short-term structure. If price pulls back into this zone and rejects, sellers may continue to defend the downtrend.
The key support level is around 1.1325. If price breaks below this area with strong bearish momentum, the next downside target is the lower liquidity zone around 1.1229.
Important Key Levels
Current price area: 1.1352
Sell value zone: 1.1384 - 1.1405
Fibonacci + High Liquidity zone: 1.1384 - 1.1405
EMA resistance area: 1.1445 - 1.1533
Key support: 1.1325
Main downside target: 1.1229
Invalidation area: above 1.1405
Trading Scenario
Main Sell Scenario
Entry: 1.1384 - 1.1405
Stop Loss: 1.1533
Take Profit 1: 1.1325
Take Profit 2: 1.1280
Take Profit 3: 1.1229
Sell Condition
The preferred setup is to wait for EURUSD to pull back into the 1.1384 - 1.1405 sell value zone. This area combines Fibonacci retracement, high liquidity, and previous structure.
A sell setup becomes more valid if price forms bearish rejection from this zone, such as a long upper wick, bearish engulfing candle, failed breakout, or lower high below the EMA structure.
If price rejects from the sell zone and breaks below 1.1325, the bearish continuation view becomes stronger. The next downside focus would be 1.1280, followed by the main target around 1.1229.
Entry Conditions
Wait for price to retest 1.1384 - 1.1405.
Look for bearish rejection before entering sell.
A break below 1.1325 confirms stronger downside pressure.
If price breaks and holds above 1.1405, the short-term sell setup becomes weaker.
Overall, the main view remains bearish while EURUSD trades below EMA 34, EMA 89, and EMA 200. The preferred plan is to wait for a pullback into the Fibonacci and high-liquidity value zone, then look for sell confirmation toward 1.1325 and 1.1229.
Do you share the same bearish view on EURUSD, or are you waiting for a cleaner rejection from the value zone first?