NIFTY WEEKLY Exp./ Short range Level Analysis for 23rd Jun 2026🔕 SGMN SplD BULLISH Above => 24167.
🔕 SGMN SplD Bearish BELOW => 24043.
Mentioned analysis based on 2 consecutive candle close in 15 min Time Frame.
━━━━━🟥🟧🟨🟩🟦🟪⬛━━━━━
💥Level Interpretation / description:
✍🏻L#1: If the candle crossed & stays above the “Buy Gen”, it is treated / considered as Bullish bias. Cfm=> Confirmation.
L#2: Possibility / Probability of REVERSAL near 🔕RL/TF1 & 🔔RL/TF2
L#3: If the candle stays above “Sell Gen” but below “Buy Gen”, it is treated / considered as Sidewise. Aggressive Traders can take Long position near “Sell Gen” either retesting or crossed from Below & vice-versa i.e. can take Short position near “Buy Gen” either retesting or crossed downward from Above.
L#4: If the candle crossed & stays below the “Sell Gen”, it is treated / considered a Bearish bias.
L#5: Possibility / Probability of REVERSAL near 🔕RL/TF1 & 🔔RL/TF2
HZB (Buy side) & HZS (Sell side) => Hurdle Zone,
✍🏻 *** Specialty of “HZB#1, HZB#2 HZS#1 & HZS#2” is Sidewise (behaviour in Nature)
Rest Plotted and Mentioned on Chart
Color code Used:
Green, BLUE =. Positive bias.
Safron, RED =. Negative bias.
RED in Between Green means Trend Finder / Momentum Change
/ CYCLE Change and Vice Versa.
Notice One thing: HOW LEVELS are Working.
Use any Momentum Indicator / Oscillator or as you "USED to" to Take entry.
━━━━━🟥🟧🟨🟩🟦🟪⬛━━━━━
⚠️ DISCLAIMER:
The information, views, and ideas shared here are purely for educational and informational purposes only. They are not intended as investment advice or a recommendation to buy, sell, or hold any financial instruments. I am not a SEBI-registered financial adviser.
Trading and investing in the stock market involves risk, and you should do your own research and analysis. You are solely responsible for any decisions made based on this research.
"🔔As HARD EARNED MONEY IS YOUR's, So DECISION SHOULD HAVE TO BE YOUR's".
━━━━━🟥🟧🟨🟩🟦🟪⬛━━━━━
❇️ Follow notification about periodical View
💥 Do Comment for Stock WEEKLY Level Analysis.🚀
📊 Do you agree with this view?
✈️ HIT THE PLANE ICON if this technical observation resonates with you. It will Motivate me.
━━━━━🟥🟧🟨🟩🟦🟪⬛━━━━━
💡 If You LOOKING any CHART & want for Level and ANALYZE?
Share your desired stock names in the comments below! I will try to analyze the chart Levels, patterns and share my technical view (so far my Knowledge).
If Viewers think It can identify meaningful setups. Looking forward to hearing from all of you — let's keep this discussion going and help each other make better trading decisions.
___________🔕^^^⚫⚪^🙏🏼🙏🏼🙏🏼^⚪⚫^^^🔔___________ Fibonacci: Nature Wrote These Levels. Markets Obey ThemFibonacci: Nature Wrote These Levels 800 Years Ago. Markets Have Been Obeying Them Ever Since.
The same mathematical ratio that governs sunflowers, seashells, and galaxies also governs how far stock prices pull back before continuing. This is not a coincidence.
In the 13th century, an Italian mathematician named Leonardo Fibonacci described a number sequence: 1, 1, 2, 3, 5, 8, 13, 21, 34, 55, 89... Each number is the sum of the two before it. And the ratio between consecutive numbers approaches 1.618 — known as the Golden Ratio or Phi.
This ratio appears everywhere in nature:
The spiral of a nautilus shell
The arrangement of seeds in a sunflower
The branching of trees
The proportions of the human body
The structure of DNA
And when traders started applying these ratios to financial markets in the early 20th century — they found, astonishingly, that markets obeyed them too.
Fibonacci Retracement: The Practical Tool
When a market makes a significant move (say from 100 to 200), it rarely continues straight upward forever. It pauses and pulls back. The question every trader faces is: how far will it pull back before resuming?
Fibonacci retracement gives you the exact levels to watch:
23.6% retracement:
A very shallow pullback. Indicates an extremely strong, fast-moving trend. Less commonly used as an entry.
38.2% retracement:
The first significant pullback level. If the trend is strong, price often bounces here. Entry for aggressive traders.
50% retracement:
Not technically a Fibonacci number but included because markets consistently respect the halfway point. Strong psychological level.
61.8% retracement (The Golden Ratio level):
The most important and most respected Fibonacci level in all of trading. More reversals happen here than anywhere else. Called the "Golden Ratio" level. When this level is at a support zone or moving average — it is the highest probability entry available in technical analysis.
78.6% retracement:
Deep pullback. If price reaches here, the original trend is struggling. Only valid as entry if major structural support is present.
Why Do These Levels Work?
There are two schools of thought:
The mathematical view: These ratios represent natural proportions of growth and decay in complex systems. Markets, being the aggregated behavior of millions of human decisions, follow the same mathematical patterns as other natural systems.
The self-fulfilling prophecy view: Because millions of traders globally use the same Fibonacci levels, they all place their buy orders at 61.8%, their stop losses below 78.6%. When everyone is watching the same level and acting on it, the level becomes real by definition.
The truth is likely both. And for a trader, the reason does not matter — the effect does.
The Fibonacci Confluence Setup: The Holy Grail of Technical Analysis
A Fibonacci level alone has moderate reliability. What makes it powerful is confluence — when multiple different tools agree on the same level.
The strongest setups occur when:
61.8% Fibonacci retracement is at the same level as...
A previous support/resistance zone, AND...
A key moving average (50 EMA or 200 SMA), AND...
Volume is drying up on the pullback (sellers losing strength)
When three or four independent tools point to the same price level as significant — that level is not just significant. It is a high-conviction trade setup.
let's learn together.
This content is for educational purposes only. It does not constitute investment advice or a recommendation to buy or sell any security. Please consult a qualified financial advisor before making investment decisions.
 Education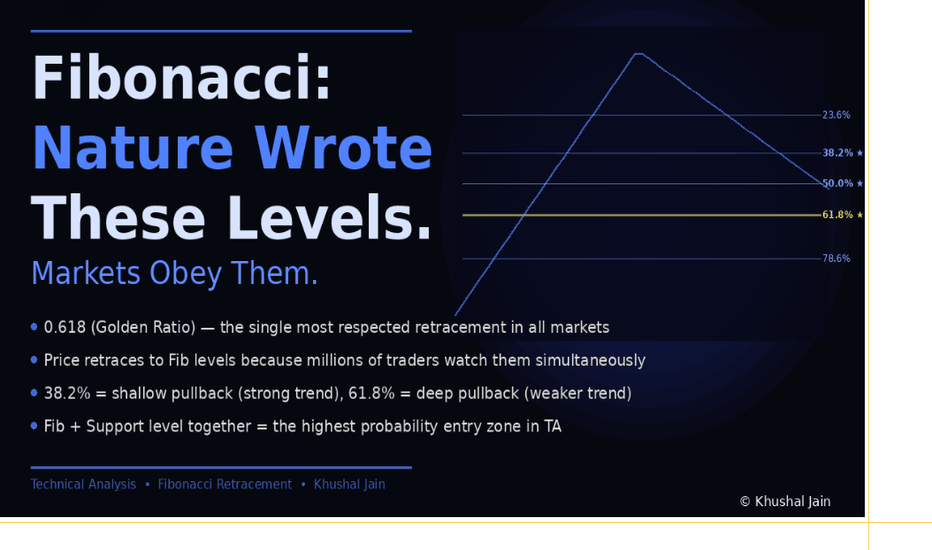
NIFTY MIDCAP SELECT DAILYY Level Analysis: 22nd Jun 2026NIFTY MIDCAP SELECT DAILYY Level Analysis: 22nd Jun 2026.
🔕 SGMN SplD BULLISH Above => 14683.
🔕 SGMN SplD Bearish BELOW =>14558.
Mentioned analysis based on 2 consecutive candle close in 15 min Time Frame.
━━━━━🟥🟧🟨🟩🟦🟪⬛━━━━━
💥Level Interpretation / description:
✍🏻L#1: If the candle crossed & stays above the “Buy Gen”, it is treated / considered as Bullish bias. Cfm=> Confirmation.
L#2: Possibility / Probability of REVERSAL near 🔕RL/TF1 & 🔔RL/TF2
L#3: If the candle stays above “Sell Gen” but below “Buy Gen”, it is treated / considered as Sidewise. Aggressive Traders can take Long position near “Sell Gen” either retesting or crossed from Below & vice-versa i.e. can take Short position near “Buy Gen” either retesting or crossed downward from Above.
L#4: If the candle crossed & stays below the “Sell Gen”, it is treated / considered a Bearish bias.
L#5: Possibility / Probability of REVERSAL near 🔕RL/TF1 & 🔔RL/TF2
HZB (Buy side) & HZS (Sell side) => Hurdle Zone,
✍🏻 *** Specialty of “HZB#1, HZB#2 HZS#1 & HZS#2” is Sidewise (behaviour in Nature)
Rest Plotted and Mentioned on Chart
Color code Used:
Green, BLUE =. Positive bias.
Safron, RED =. Negative bias.
RED in Between Green means Trend Finder / Momentum Change
/ CYCLE Change and Vice Versa.
Notice One thing: HOW LEVELS are Working.
Use any Momentum Indicator / Oscillator or as you "USED to" to Take entry.
━━━━━🟥🟧🟨🟩🟦🟪⬛━━━━━
⚠️ DISCLAIMER:
The information, views, and ideas shared here are purely for educational and informational purposes only. They are not intended as investment advice or a recommendation to buy, sell, or hold any financial instruments. I am not a SEBI-registered financial adviser.
Trading and investing in the stock market involves risk, and you should do your own research and analysis. You are solely responsible for any decisions made based on this research.
"🔔As HARD EARNED MONEY IS YOUR's, So DECISION SHOULD HAVE TO BE YOUR's".
━━━━━🟥🟧🟨🟩🟦🟪⬛━━━━━
❇️ Follow notification about periodical View
💥 Do Comment for Stock WEEKLY Level Analysis.🚀
📊 Do you agree with this view?
✈️ HIT THE PLANE ICON if this technical observation resonates with you. It will Motivate me.
━━━━━🟥🟧🟨🟩🟦🟪⬛━━━━━
💡 If You LOOKING any CHART & want for Level and ANALYZE?
Share your desired stock names in the comments below! I will try to analyze the chart Levels, patterns and share my technical view (so far my Knowledge).
If Viewers think It can identify meaningful setups. Looking forward to hearing from all of you — let's keep this discussion going and help each other make better trading decisions.
___________🔕^^^⚫⚪^🙏🏼🙏🏼🙏🏼^⚪⚫^^^🔔___________ NIFTY MIDCAP SELECT WEEKLY Level Analysis: 22nd-25th Jun 2026🔔 SGMN SplWP Above BULLISH BIAS => 14684.
🔔 SGMN SplWP BELOW Bearish BIAS => 14432.
Mentioned analysis based on 2 consecutive candle close in 15 min Time Frame.
━━━━━🟥🟧🟨🟩🟦🟪⬛━━━━━
💥Level Interpretation / description:
✍🏻L#1: If the candle crossed & stays above the “Buy Gen”, it is treated / considered as Bullish bias. Cfm=> Confirmation.
L#2: Possibility / Probability of REVERSAL near 🔕RL/TF1 & 🔔RL/TF2
L#3: If the candle stays above “Sell Gen” but below “Buy Gen”, it is treated / considered as Sidewise. Aggressive Traders can take Long position near “Sell Gen” either retesting or crossed from Below & vice-versa i.e. can take Short position near “Buy Gen” either retesting or crossed downward from Above.
L#4: If the candle crossed & stays below the “Sell Gen”, it is treated / considered a Bearish bias.
L#5: Possibility / Probability of REVERSAL near 🔕RL/TF1 & 🔔RL/TF2
HZB (Buy side) & HZS (Sell side) => Hurdle Zone,
✍🏻 *** Specialty of “HZB#1, HZB#2 HZS#1 & HZS#2” is Sidewise (behaviour in Nature)
Rest Plotted and Mentioned on Chart
Color code Used:
Green, BLUE =. Positive bias.
Safron, RED =. Negative bias.
RED in Between Green means Trend Finder / Momentum Change
/ CYCLE Change and Vice Versa.
Notice One thing: HOW LEVELS are Working.
Use any Momentum Indicator / Oscillator or as you "USED to" to Take entry.
━━━━━🟥🟧🟨🟩🟦🟪⬛━━━━━
⚠️ DISCLAIMER:
The information, views, and ideas shared here are purely for educational and informational purposes only. They are not intended as investment advice or a recommendation to buy, sell, or hold any financial instruments. I am not a SEBI-registered financial adviser.
Trading and investing in the stock market involves risk, and you should do your own research and analysis. You are solely responsible for any decisions made based on this research.
"🔔As HARD EARNED MONEY IS YOUR's, So DECISION SHOULD HAVE TO BE YOUR's".
━━━━━🟥🟧🟨🟩🟦🟪⬛━━━━━
❇️ Follow notification about periodical View
💥 Do Comment for Stock WEEKLY Level Analysis.🚀
📊 Do you agree with this view?
✈️ HIT THE PLANE ICON if this technical observation resonates with you. It will Motivate me.
━━━━━🟥🟧🟨🟩🟦🟪⬛━━━━━
💡 If You LOOKING any CHART & want for Level and ANALYZE?
Share your desired stock names in the comments below! I will try to analyze the chart Levels, patterns and share my technical view (so far my Knowledge).
If Viewers think It can identify meaningful setups. Looking forward to hearing from all of you — let's keep this discussion going and help each other make better trading decisions.
___________🔕^^^⚫⚪^🙏🏼🙏🏼🙏🏼^⚪⚫^^^🔔___________ SENSEX WEEKLY / POSITIONAL Level Analysis: 22nd-25th Jun 2026🔔 SGMN SplWP BULLISH Above => 77541
🔔 SGMN SplP BEARISH Below => 76163.
Mentioned analysis based on 2 consecutive candle close in 15 min Time Frame.
━━━━━🟥🟧🟨🟩🟦🟪⬛━━━━━
💥Level Interpretation / description:
✍🏻L#1: If the candle crossed & stays above the “Buy Gen”, it is treated / considered as Bullish bias. Cfm=> Confirmation.
L#2: Possibility / Probability of REVERSAL near 🔕RL/TF1 & 🔔RL/TF2
L#3: If the candle stays above “Sell Gen” but below “Buy Gen”, it is treated / considered as Sidewise. Aggressive Traders can take Long position near “Sell Gen” either retesting or crossed from Below & vice-versa i.e. can take Short position near “Buy Gen” either retesting or crossed downward from Above.
L#4: If the candle crossed & stays below the “Sell Gen”, it is treated / considered a Bearish bias.
L#5: Possibility / Probability of REVERSAL near 🔕RL/TF1 & 🔔RL/TF2
HZB (Buy side) & HZS (Sell side) => Hurdle Zone,
✍🏻 *** Specialty of “HZB#1, HZB#2 HZS#1 & HZS#2” is Sidewise (behaviour in Nature)
Rest Plotted and Mentioned on Chart
Color code Used:
Green, BLUE =. Positive bias.
Safron, RED =. Negative bias.
RED in Between Green means Trend Finder / Momentum Change
/ CYCLE Change and Vice Versa.
Notice One thing: HOW LEVELS are Working.
Use any Momentum Indicator / Oscillator or as you "USED to" to Take entry.
━━━━━🟥🟧🟨🟩🟦🟪⬛━━━━━
⚠️ DISCLAIMER:
The information, views, and ideas shared here are purely for educational and informational purposes only. They are not intended as investment advice or a recommendation to buy, sell, or hold any financial instruments. I am not a SEBI-registered financial adviser.
Trading and investing in the stock market involves risk, and you should do your own research and analysis. You are solely responsible for any decisions made based on this research.
"🔔As HARD EARNED MONEY IS YOUR's, So DECISION SHOULD HAVE TO BE YOUR's".
━━━━━🟥🟧🟨🟩🟦🟪⬛━━━━━
❇️ Follow notification about periodical View
💥 Do Comment for Stock WEEKLY Level Analysis.🚀
📊 Do you agree with this view?
✈️ HIT THE PLANE ICON if this technical observation resonates with you. It will Motivate me.
━━━━━🟥🟧🟨🟩🟦🟪⬛━━━━━
💡 If You LOOKING any CHART & want for Level and ANALYZE?
Share your desired stock names in the comments below! I will try to analyze the chart Levels, patterns and share my technical view (so far my Knowledge).
If Viewers think It can identify meaningful setups. Looking forward to hearing from all of you — let's keep this discussion going and help each other make better trading decisions.
___________🔕^^^⚫⚪^🙏🏼🙏🏼🙏🏼^⚪⚫^^^🔔___________ EURUSD — Bearish Continuation From Fibonacci Value Zones
Fundamental Analysis
EURUSD remains under pressure as price trades below the main EMA structure. For next week, traders should continue watching USD momentum, Fed expectations, and upcoming U.S. data, as these factors may drive volatility around key Fibonacci zones.
For now, the technical structure still favours sellers while recovery attempts remain capped below EMA resistance.
Technical Analysis
On the 4H chart, EURUSD is still moving inside a descending structure. EMA 34, EMA 89, and EMA 200 remain above price, confirming that the broader trend is still bearish.
Price is currently around 1.1465 after a strong bearish move below the previous support area. The recovery has not confirmed a bullish reversal yet, and the chart shows clear sell zones above price.
The first key sell area is around 1.1490 - 1.1505, near the 0.618 Fibonacci reaction zone. This area may act as the first resistance if price creates a short-term pullback.
The stronger Fibonacci value sell zone is around 1.1518 - 1.1531. This zone aligns with the golden ratio area, previous support turned resistance, and the EMA pressure.
The higher sell swing zone is around 1.1565 - 1.1582. This is the stronger resistance zone on the chart and may offer another sell opportunity if price retraces deeper.
The main downside target for next week is around 1.1372, which aligns with the lower channel area and bearish projection on the chart.
Important Key Levels
Current price area: 1.1465
Sell zone 1: 1.1490 - 1.1505
Fibonacci golden ratio sell zone: 1.1518 - 1.1531
Sell swing resistance: 1.1565 - 1.1582
EMA resistance area: 1.1525 - 1.1582
Short-term downside target: 1.1481
Main weekly bearish target: 1.1372
Invalidation area: above 1.1582
Trading Scenario
Main Sell Scenario 1 — Fibonacci 0.618 Retest
Entry: 1.1490 - 1.1505
Stop Loss: 1.1535
Take Profit 1: 1.1465
Take Profit 2: 1.1418
Take Profit 3: 1.1372
Sell Condition
The first sell setup is to wait for EURUSD to pull back into 1.1490 - 1.1505. This zone aligns with the 0.618 Fibonacci reaction area and short-term broken structure.
A sell setup becomes more valid if price forms bearish rejection from this zone, such as a long upper wick, bearish engulfing candle, failed breakout, or lower high below the EMA structure.
Main Sell Scenario 2 — Golden Ratio Value Zone
Entry: 1.1518 - 1.1531
Stop Loss: 1.1582
Take Profit 1: 1.1481
Take Profit 2: 1.1418
Take Profit 3: 1.1372
Sell Condition
The second sell setup is stronger if EURUSD retraces deeper into 1.1518 - 1.1531. This is the main Fibonacci golden ratio zone and also aligns with the previous support/resistance area.
If price rejects from this zone and fails to reclaim the EMA range, sellers may regain control and continue the bearish move toward 1.1481, then 1.1372.
Entry Conditions
Wait for price to retest one of the Fibonacci sell zones.
Look for bearish rejection before entering sell.
A break below 1.1465 strengthens the bearish continuation view.
If price breaks and holds above 1.1582, the sell setup is invalid.
Overall, the main view for next week remains bearish while EURUSD stays below EMA 34, EMA 89, EMA 200, and the descending trendline. The preferred plan is to wait for a pullback into the Fibonacci value zones, then look for sell confirmation toward 1.1481 and the weekly target around 1.1372.
Do you share the same bearish view on EURUSD for next week, or are you waiting for a cleaner retest of the Fibonacci value zone?
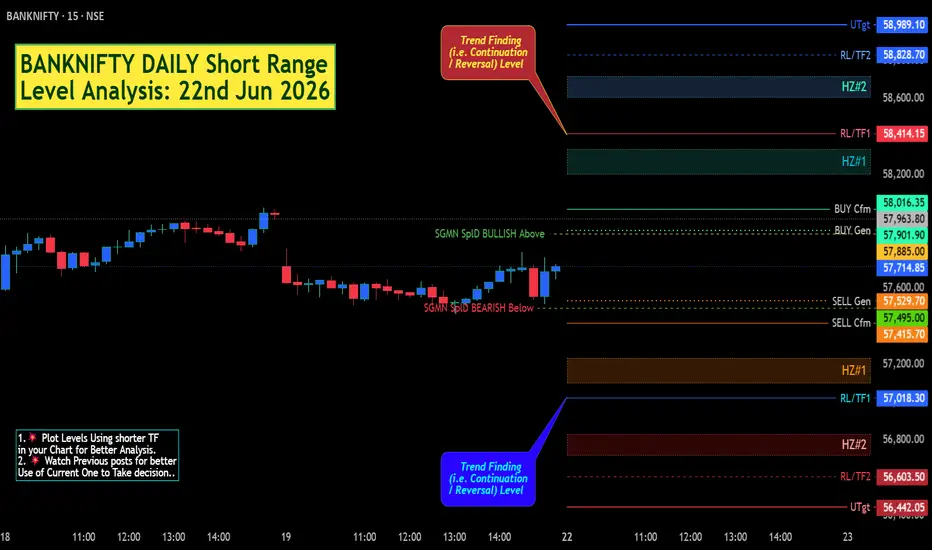
BANKNIFTY DAILY Short Range Level Analysis: 22nd Jun 2026🔕 SGMN SplD BULLISH Above => 57885.
🔕 SGMN SplD Bearish BELOW => 57495.
Mentioned analysis based on 2 consecutive candle close in 15 min Time Frame.
━━━━━🟥🟧🟨🟩🟦🟪⬛━━━━━
💥Level Interpretation / description:
✍🏻L#1: If the candle crossed & stays above the “Buy Gen”, it is treated / considered as Bullish bias. Cfm=> Confirmation.
L#2: Possibility / Probability of REVERSAL near 🔕RL/TF1 & 🔔RL/TF2
L#3: If the candle stays above “Sell Gen” but below “Buy Gen”, it is treated / considered as Sidewise. Aggressive Traders can take Long position near “Sell Gen” either retesting or crossed from Below & vice-versa i.e. can take Short position near “Buy Gen” either retesting or crossed downward from Above.
L#4: If the candle crossed & stays below the “Sell Gen”, it is treated / considered a Bearish bias.
L#5: Possibility / Probability of REVERSAL near 🔕RL/TF1 & 🔔RL/TF2
HZB (Buy side) & HZS (Sell side) => Hurdle Zone,
✍🏻 *** Specialty of “HZB#1, HZB#2 HZS#1 & HZS#2” is Sidewise (behaviour in Nature)
Rest Plotted and Mentioned on Chart
Color code Used:
Green, BLUE =. Positive bias.
Safron, RED =. Negative bias.
RED in Between Green means Trend Finder / Momentum Change
/ CYCLE Change and Vice Versa.
Notice One thing: HOW LEVELS are Working.
Use any Momentum Indicator / Oscillator or as you "USED to" to Take entry.
━━━━━🟥🟧🟨🟩🟦🟪⬛━━━━━
⚠️ DISCLAIMER:
The information, views, and ideas shared here are purely for educational and informational purposes only. They are not intended as investment advice or a recommendation to buy, sell, or hold any financial instruments. I am not a SEBI-registered financial adviser.
Trading and investing in the stock market involves risk, and you should do your own research and analysis. You are solely responsible for any decisions made based on this research.
"🔔As HARD EARNED MONEY IS YOUR's, So DECISION SHOULD HAVE TO BE YOUR's".
━━━━━🟥🟧🟨🟩🟦🟪⬛━━━━━
❇️ Follow notification about periodical View
💥 Do Comment for Stock WEEKLY Level Analysis.🚀
📊 Do you agree with this view?
✈️ HIT THE PLANE ICON if this technical observation resonates with you. It will Motivate me.
━━━━━🟥🟧🟨🟩🟦🟪⬛━━━━━
💡 If You LOOKING any CHART & want for Level and ANALYZE?
Share your desired stock names in the comments below! I will try to analyze the chart Levels, patterns and share my technical view (so far my Knowledge).
If Viewers think It can identify meaningful setups. Looking forward to hearing from all of you — let's keep this discussion going and help each other make better trading decisions.
___________🔕^^^⚫⚪^🙏🏼🙏🏼🙏🏼^⚪⚫^^^🔔___________ BANKNIFTY WEEKLYY/ Positional Level Analysis: 22nd-25th Jun 2026🔔 SGMN SplW Above BULLISH BIAS => 58512.
🔔 SGMN SplW BELOW Bearish BIAS => 56719.
Mentioned analysis based on 2 consecutive candle close in 15 min Time Frame.
━━━━━🟥🟧🟨🟩🟦🟪⬛━━━━━
💥Level Interpretation / description:
✍🏻L#1: If the candle crossed & stays above the “Buy Gen”, it is treated / considered as Bullish bias. Cfm=> Confirmation.
L#2: Possibility / Probability of REVERSAL near 🔕RL/TF1 & 🔔RL/TF2
L#3: If the candle stays above “Sell Gen” but below “Buy Gen”, it is treated / considered as Sidewise. Aggressive Traders can take Long position near “Sell Gen” either retesting or crossed from Below & vice-versa i.e. can take Short position near “Buy Gen” either retesting or crossed downward from Above.
L#4: If the candle crossed & stays below the “Sell Gen”, it is treated / considered a Bearish bias.
L#5: Possibility / Probability of REVERSAL near 🔕RL/TF1 & 🔔RL/TF2
HZB (Buy side) & HZS (Sell side) => Hurdle Zone,
✍🏻 *** Specialty of “HZB#1, HZB#2 HZS#1 & HZS#2” is Sidewise (behaviour in Nature)
Rest Plotted and Mentioned on Chart
Color code Used:
Green, BLUE =. Positive bias.
Safron, RED =. Negative bias.
RED in Between Green means Trend Finder / Momentum Change
/ CYCLE Change and Vice Versa.
Notice One thing: HOW LEVELS are Working.
Use any Momentum Indicator / Oscillator or as you "USED to" to Take entry.
━━━━━🟥🟧🟨🟩🟦🟪⬛━━━━━
⚠️ DISCLAIMER:
The information, views, and ideas shared here are purely for educational and informational purposes only. They are not intended as investment advice or a recommendation to buy, sell, or hold any financial instruments. I am not a SEBI-registered financial adviser.
Trading and investing in the stock market involves risk, and you should do your own research and analysis. You are solely responsible for any decisions made based on this research.
"🔔As HARD EARNED MONEY IS YOUR's, So DECISION SHOULD HAVE TO BE YOUR's".
━━━━━🟥🟧🟨🟩🟦🟪⬛━━━━━
❇️ Follow notification about periodical View
💥 Do Comment for Stock WEEKLY Level Analysis.🚀
📊 Do you agree with this view?
✈️ HIT THE PLANE ICON if this technical observation resonates with you. It will Motivate me.
━━━━━🟥🟧🟨🟩🟦🟪⬛━━━━━
💡 If You LOOKING any CHART & want for Level and ANALYZE?
Share your desired stock names in the comments below! I will try to analyze the chart Levels, patterns and share my technical view (so far my Knowledge).
If Viewers think It can identify meaningful setups. Looking forward to hearing from all of you — let's keep this discussion going and help each other make better trading decisions.
___________🔕^^^⚫⚪^🙏🏼🙏🏼🙏🏼^⚪⚫^^^🔔___________ NIFTY Daily / Short range Level Analysis for 22nd Jun 2026NIFTY Daily / Short range Level Analysis for 22nd Jun 2026.
🔕 SGMN SplD BULLISH Above => 24084.
🔕 SGMN SplD Bearish BELOW => 23944.
Mentioned analysis based on 2 consecutive candle close in 15 min Time Frame.
━━━━━🟥🟧🟨🟩🟦🟪⬛━━━━━
💥Level Interpretation / description:
✍🏻L#1: If the candle crossed & stays above the “Buy Gen”, it is treated / considered as Bullish bias. Cfm=> Confirmation.
L#2: Possibility / Probability of REVERSAL near 🔕RL/TF1 & 🔔RL/TF2
L#3: If the candle stays above “Sell Gen” but below “Buy Gen”, it is treated / considered as Sidewise. Aggressive Traders can take Long position near “Sell Gen” either retesting or crossed from Below & vice-versa i.e. can take Short position near “Buy Gen” either retesting or crossed downward from Above.
L#4: If the candle crossed & stays below the “Sell Gen”, it is treated / considered a Bearish bias.
L#5: Possibility / Probability of REVERSAL near 🔕RL/TF1 & 🔔RL/TF2
HZB (Buy side) & HZS (Sell side) => Hurdle Zone,
✍🏻 *** Specialty of “HZB#1, HZB#2 HZS#1 & HZS#2” is Sidewise (behaviour in Nature)
Rest Plotted and Mentioned on Chart
Color code Used:
Green, BLUE =. Positive bias.
Safron, RED =. Negative bias.
RED in Between Green means Trend Finder / Momentum Change
/ CYCLE Change and Vice Versa.
Notice One thing: HOW LEVELS are Working.
Use any Momentum Indicator / Oscillator or as you "USED to" to Take entry.
━━━━━🟥🟧🟨🟩🟦🟪⬛━━━━━
⚠️ DISCLAIMER:
The information, views, and ideas shared here are purely for educational and informational purposes only. They are not intended as investment advice or a recommendation to buy, sell, or hold any financial instruments. I am not a SEBI-registered financial adviser.
Trading and investing in the stock market involves risk, and you should do your own research and analysis. You are solely responsible for any decisions made based on this research.
"🔔As HARD EARNED MONEY IS YOUR's, So DECISION SHOULD HAVE TO BE YOUR's".
━━━━━🟥🟧🟨🟩🟦🟪⬛━━━━━
❇️ Follow notification about periodical View
💥 Do Comment for Stock WEEKLY Level Analysis.🚀
📊 Do you agree with this view?
✈️ HIT THE PLANE ICON if this technical observation resonates with you. It will Motivate me.
━━━━━🟥🟧🟨🟩🟦🟪⬛━━━━━
💡 If You LOOKING any CHART & want for Level and ANALYZE?
Share your desired stock names in the comments below! I will try to analyze the chart Levels, patterns and share my technical view (so far my Knowledge).
If Viewers think It can identify meaningful setups. Looking forward to hearing from all of you — let's keep this discussion going and help each other make better trading decisions.
___________🔕^^^⚫⚪^🙏🏼🙏🏼🙏🏼^⚪⚫^^^🔔___________ XAUUSD Weekly Plan — Is Gold Walking Into Another Seller Test?
Gold is entering a very important week.
Price is trying to hold above the lower structure, but the bigger picture still shows one clear thing:
The descending trendline is still controlling the market.
THE SIMPLE READ
Gold is still moving under a major bearish trendline.
That means every recovery needs to be tested carefully, especially when price is approaching a short-term Order Sell zone.
Right now, gold is trading around the 4,155 area. The market is not too far from the 4,180 - 4,220 resistance zone, where sellers may start watching again.
For beginners, this is not a place to guess.
This is a place to wait and see whether gold can break the trendline — or reject from it again.
WHAT I SEE
The first key area is 4,180 - 4,220.
This is the short-term Order Sell zone. It also sits near the falling trendline, so if gold reacts here, sellers may try to protect the bearish structure.
Below price, the next important area is around 4,000.
This zone matters because it sits near the lower support line. If gold loses this area, the bearish move may become cleaner.
The next larger zone is 3,850 - 3,900.
This is a POC area, where price may react because the market has shown strong volume interest there before.
The deeper support is around 3,600 - 3,670.
This is marked as the POC - Order Buy zone. If gold continues lower into this area, buyers may start watching for a stronger reaction.
THE WEEKLY PLAN
📉 IF gold rejects from 4,180 - 4,220 and stays below the descending trendline:
→ Sellers may keep control of the weekly structure
→ Price could move back toward 4,000 first
→ If 4,000 breaks, the next downside area is 3,850 - 3,900
→ A deeper move could open toward 3,600 - 3,670
→ Possible sell idea: after bearish confirmation near resistance
→ Invalidation: clear break and hold above the trendline
📈 IF gold breaks and holds above 4,220:
→ The short-term bearish pressure may slow down
→ Buyers may try to build a recovery structure
→ But the breakout needs confirmation, not just one fast candle
→ Possible buy idea: only after breakout and retest confirmation
→ First upside area: 4,300 - 4,350
⏳ No confirmation = no trade.
💡 Tiara’s Tip:
A market can bounce and still remain bearish.
That is why I never judge gold only by one green candle.
The real question is:
Can price break the trendline and hold above it?
If not, the bounce may only be a retest before another move lower.
For this week, I’m watching 4,180 - 4,220 as the seller test zone.
If sellers defend it, gold may continue lower toward the POC zones.
If buyers break it clearly, the market may start showing early recovery signs.
YOUR TURN
💬 What do you see for gold this week — will sellers defend 4,180 - 4,220, or will buyers finally break the trendline?
Drop a 🔴 for seller rejection or 🟢 for breakout recovery below 👇
 Short
Short
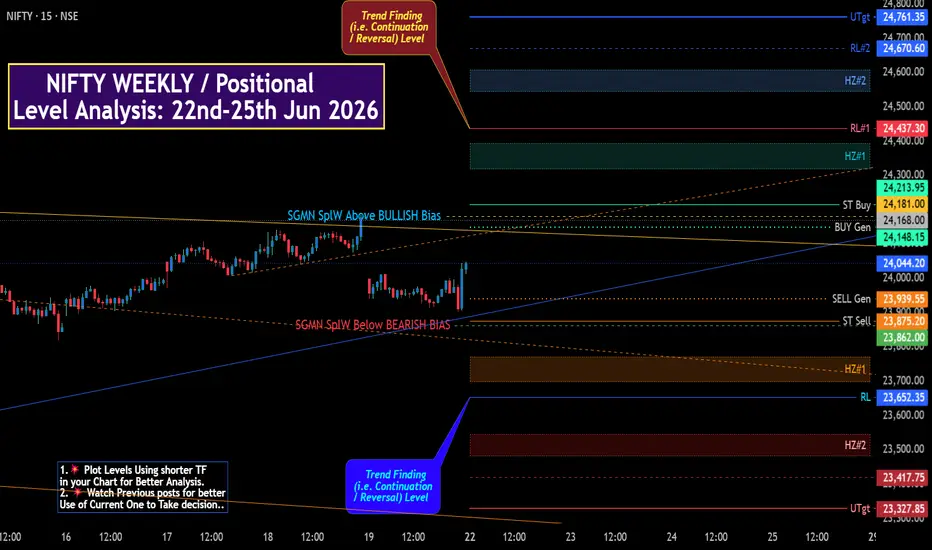
NIFTY WEEKLY / Positional Level Analysis: 22nd - 25th Jun 2026🔔 SGMN SplWP Above BULLISH BIAS => 24181
🔔 SGMN SplWP BELOW Bearish BIAS => 23862.
Mentioned analysis based on 2 consecutive candle close in 15 min Time Frame.
━━━━━🟥🟧🟨🟩🟦🟪⬛━━━━━
💥Level Interpretation / description:
✍🏻L#1: If the candle crossed & stays above the “Buy Gen”, it is treated / considered as Bullish bias. Cfm=> Confirmation.
L#2: Possibility / Probability of REVERSAL near 🔕RL/TF1 & 🔔RL/TF2
L#3: If the candle stays above “Sell Gen” but below “Buy Gen”, it is treated / considered as Sidewise. Aggressive Traders can take Long position near “Sell Gen” either retesting or crossed from Below & vice-versa i.e. can take Short position near “Buy Gen” either retesting or crossed downward from Above.
L#4: If the candle crossed & stays below the “Sell Gen”, it is treated / considered a Bearish bias.
L#5: Possibility / Probability of REVERSAL near 🔕RL/TF1 & 🔔RL/TF2
HZB (Buy side) & HZS (Sell side) => Hurdle Zone,
✍🏻 *** Specialty of “HZB#1, HZB#2 HZS#1 & HZS#2” is Sidewise (behaviour in Nature)
Rest Plotted and Mentioned on Chart
Color code Used:
Green, BLUE =. Positive bias.
Safron, RED =. Negative bias.
RED in Between Green means Trend Finder / Momentum Change
/ CYCLE Change and Vice Versa.
Notice One thing: HOW LEVELS are Working.
Use any Momentum Indicator / Oscillator or as you "USED to" to Take entry.
━━━━━🟥🟧🟨🟩🟦🟪⬛━━━━━
⚠️ DISCLAIMER:
The information, views, and ideas shared here are purely for educational and informational purposes only. They are not intended as investment advice or a recommendation to buy, sell, or hold any financial instruments. I am not a SEBI-registered financial adviser.
Trading and investing in the stock market involves risk, and you should do your own research and analysis. You are solely responsible for any decisions made based on this research.
"🔔As HARD EARNED MONEY IS YOUR's, So DECISION SHOULD HAVE TO BE YOUR's".
━━━━━🟥🟧🟨🟩🟦🟪⬛━━━━━
❇️ Follow notification about periodical View
💥 Do Comment for Stock WEEKLY Level Analysis.🚀
📊 Do you agree with this view?
✈️ HIT THE PLANE ICON if this technical observation resonates with you. It will Motivate me.
━━━━━🟥🟧🟨🟩🟦🟪⬛━━━━━
💡 If You LOOKING any CHART & want for Level and ANALYZE?
Share your desired stock names in the comments below! I will try to analyze the chart Levels, patterns and share my technical view (so far my Knowledge).
If Viewers think It can identify meaningful setups. Looking forward to hearing from all of you — let's keep this discussion going and help each other make better trading decisions.
___________🔕^^^⚫⚪^🙏🏼🙏🏼🙏🏼^⚪⚫^^^🔔___________ SENSEX DAILY / Short Range Level Analysis for 22nd Jun 2026🔕 SGMN SplD BULLISH Above => 77047.
🔕 SGMN SplD Bearish BELOW => 76571.
Mentioned analysis based on 2 consecutive candle close in 15 min Time Frame.
M ━━━━━🟥🟧🟨🟩🟦🟪⬛━━━━━
💥Level Interpretation / description:
✍🏻L#1: If the candle crossed & stays above the “Buy Gen”, it is treated / considered as Bullish bias. Cfm=> Confirmation.
L#2: Possibility / Probability of REVERSAL near 🔕RL/TF1 & 🔔RL/TF2
L#3: If the candle stays above “Sell Gen” but below “Buy Gen”, it is treated / considered as Sidewise. Aggressive Traders can take Long position near “Sell Gen” either retesting or crossed from Below & vice-versa i.e. can take Short position near “Buy Gen” either retesting or crossed downward from Above.
L#4: If the candle crossed & stays below the “Sell Gen”, it is treated / considered a Bearish bias.
L#5: Possibility / Probability of REVERSAL near 🔕RL/TF1 & 🔔RL/TF2
HZB (Buy side) & HZS (Sell side) => Hurdle Zone,
✍🏻 *** Specialty of “HZB#1, HZB#2 HZS#1 & HZS#2” is Sidewise (behaviour in Nature)
Rest Plotted and Mentioned on Chart
Color code Used:
Green, BLUE =. Positive bias.
Safron, RED =. Negative bias.
RED in Between Green means Trend Finder / Momentum Change
/ CYCLE Change and Vice Versa.
Notice One thing: HOW LEVELS are Working.
Use any Momentum Indicator / Oscillator or as you "USED to" to Take entry.
━━━━━🟥🟧🟨🟩🟦🟪⬛━━━━━
⚠️ DISCLAIMER:
The information, views, and ideas shared here are purely for educational and informational purposes only. They are not intended as investment advice or a recommendation to buy, sell, or hold any financial instruments. I am not a SEBI-registered financial adviser.
Trading and investing in the stock market involves risk, and you should do your own research and analysis. You are solely responsible for any decisions made based on this research.
"🔔As HARD EARNED MONEY IS YOUR's, So DECISION SHOULD HAVE TO BE YOUR's".
━━━━━🟥🟧🟨🟩🟦🟪⬛━━━━━
❇️ Follow notification about periodical View
💥 Do Comment for Stock WEEKLY Level Analysis.🚀
📊 Do you agree with this view?
✈️ HIT THE PLANE ICON if this technical observation resonates with you. It will Motivate me.
━━━━━🟥🟧🟨🟩🟦🟪⬛━━━━━
💡 If You LOOKING any CHART & want for Level and ANALYZE?
Share your desired stock names in the comments below! I will try to analyze the chart Levels, patterns and share my technical view (so far my Knowledge).
If Viewers think It can identify meaningful setups. Looking forward to hearing from all of you — let's keep this discussion going and help each other make better trading decisions.
___________🔕^^^⚫⚪^🙏🏼🙏🏼🙏🏼^⚪⚫^^^🔔___________
entioned analysis based on 2 consecutive candle close in 15 min Time Frame. XAUUSD Is Gold Preparing Another Trap Before the Next Big Move ?Gold is sitting at a very sensitive area again — right between a short-term reaction zone and a bigger bearish trendline pressure.
THE SIMPLE READ
Gold is still trading under the main descending trendline.
That means buyers may create short-term bounces, but the bigger structure has not fully turned bullish yet.
Right now, price is reacting near the 4,138 area. This is marked as a short-term reaction zone, so a small bounce from here would not be surprising.
But the important question is not:
“Can gold bounce?”
The better question is:
“Where will that bounce fail?”
WHAT I SEE
The first level I’m watching is 4,138.
This area matters because price is reacting here now. If buyers defend it, gold may try to recover in the short term.
Above price, 4,228 is the next important zone.
This is the Order Sell area. If gold bounces into this level and slows down, sellers may return again.
Higher above, 4,313 is the stronger resistance area.
This level is important because it sits closer to the upper structure and trendline pressure. If gold reaches this zone, it may become a bigger decision point for the market.
Below price, 4,053 is the main support zone.
If gold breaks below 4,138 and fails to reclaim it, price may search for this lower support area.
The deeper reaction zone is around 3,945.
This is the stronger Fibonacci reaction area where buyers may start watching for a larger response.
THE PLAN
📉 IF gold loses 4,138 and fails to reclaim it:
→ Sellers may keep short-term control
→ Price could move toward 4,053 first
→ If 4,053 cannot hold, the deeper zone is around 3,945
→ Possible sell idea: after bearish confirmation below 4,138
→ Invalidation: back above the broken reaction zone
→ Target 1: 4,053
→ Target 2: 3,945
📈 IF gold holds 4,138 and creates a clean bullish reaction:
→ Buyers may try to recover toward 4,228
→ 4,228 is still the first area where sellers may react
→ If gold breaks and holds above 4,228, the next upside area is 4,313
→ Possible buy idea: only after clear confirmation from support
→ Invalidation: back below 4,138
→ Target 1: 4,228
→ Target 2: 4,313
⏳ No confirmation = no trade.
💡 Tiara’s Tip:
When price is below a major descending trendline, every bounce should be treated carefully.
A bounce from support can be real, but it does not become a bullish reversal until price breaks resistance and holds above it.
For beginners, this is the simple rule:
Support can create a reaction.
Resistance decides if the reaction can continue.
That is why 4,138 and 4,228 are the two key levels for me today.
YOUR TURN
💬 What do you see on gold now — will buyers defend 4,138, or will sellers push price toward 4,053 first?
Drop a 🟢 for support bounce or 🔴 for bearish continuation below 👇 Short 
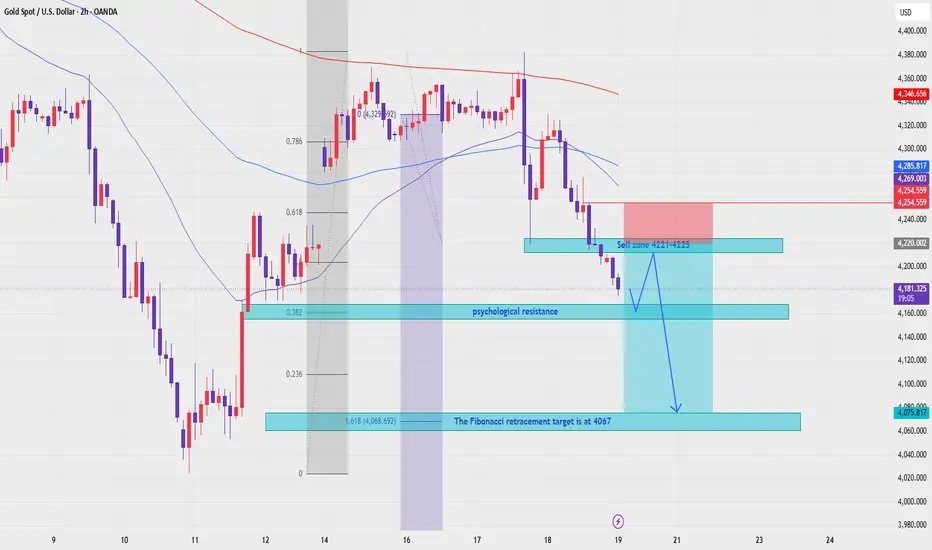
XAUUSD — EMA Bearish Trend, Fibonacci Target in Focus
Fundamental Analysis
Gold remains under pressure as traders continue to watch USD strength, Treasury yields, and upcoming U.S. macro data.
For now, the structure still favours sellers while XAUUSD trades below the main EMA range. Any recovery should be treated as a technical pullback unless price can reclaim the EMA resistance zone with strong confirmation.
Technical Analysis
On the 2H chart, XAUUSD is trading below EMA 34, EMA 89, and EMA 200. This confirms that the current trend remains bearish, with the EMA structure acting as dynamic resistance above price.
Price has already rejected from the higher area and is now trading around 4,179. The current move shows strong bearish pressure, and the chart highlights a key sell zone around 4,221 - 4,225.
This sell zone is important because it aligns with the broken structure, previous reaction area, and EMA trend pressure. If gold pulls back into this zone and fails to break higher, sellers may regain control.
The psychological resistance zone around 4,160 - 4,170 is also important. If price stays below this area after a failed recovery, the bearish continuation scenario remains active.
The medium-term downside target is the Fibonacci level around 4,067, marked as the main retracement target on the chart.
Important Key Levels
Current price area: 4,179
Main sell zone: 4,221 - 4,225
EMA resistance area: 4,254 - 4,285
Psychological resistance: 4,160 - 4,170
Short-term bearish trigger: below 4,160
Fibonacci medium-term target: 4,067
Extended liquidity target: 4,075 - 4,067
Invalidation area: above 4,254
Trading Scenario
Main Sell Scenario
Entry: 4,221 - 4,225
Stop Loss: 4,254
Take Profit 1: 4,160
Take Profit 2: 4,075
Take Profit 3: 4,067
Sell Condition
The preferred setup is to wait for gold to pull back into the 4,221 - 4,225 sell zone. This area is the key resistance zone on the chart and aligns with the bearish EMA structure.
A sell setup becomes more valid if price forms bearish rejection from this zone, such as a long upper wick, bearish engulfing candle, failed breakout, or lower high below the EMA range.
If price rejects from 4,221 - 4,225 and breaks below 4,160, the bearish continuation view becomes stronger. The next target would be 4,075, followed by the Fibonacci medium-term target around 4,067.
Entry Conditions
Wait for price to retest 4,221 - 4,225.
Look for bearish rejection before entering sell.
A break below 4,160 confirms stronger downside pressure.
If price breaks and holds above 4,254, the sell setup is invalid.
Overall, the main view remains bearish while XAUUSD trades below EMA 34, EMA 89, and EMA 200. The preferred plan is to wait for a pullback into the 4,221 - 4,225 sell zone, then look for bearish confirmation toward 4,160, 4,075, and the Fibonacci target around 4,067.
Do you share the same bearish view on gold, or are you waiting for a cleaner pullback into the sell zone first?
Short 
NIFTY DAILY / Short Range Level Analysis for 19th Jun 2026🔕 SGMN SplD BULLISH Above => 24136.
🔕 SGMN SplD Bearish BELOW => 24104.
Mentioned analysis based on 2 consecutive candle close in 15 min Time Frame.
━━━━━🟥🟧🟨🟩🟦🟪⬛━━━━━
💥Level Interpretation / description:
✍🏻L#1: If the candle crossed & stays above the “Buy Gen”, it is treated / considered as Bullish bias. Cfm=> Confirmation.
L#2: Possibility / Probability of REVERSAL near 🔕RL/TF1 & 🔔RL/TF2
L#3: If the candle stays above “Sell Gen” but below “Buy Gen”, it is treated / considered as Sidewise. Aggressive Traders can take Long position near “Sell Gen” either retesting or crossed from Below & vice-versa i.e. can take Short position near “Buy Gen” either retesting or crossed downward from Above.
L#4: If the candle crossed & stays below the “Sell Gen”, it is treated / considered a Bearish bias.
L#5: Possibility / Probability of REVERSAL near 🔕RL/TF1 & 🔔RL/TF2
HZB (Buy side) & HZS (Sell side) => Hurdle Zone,
✍🏻 *** Specialty of “HZB#1, HZB#2 HZS#1 & HZS#2” is Sidewise (behaviour in Nature)
Rest Plotted and Mentioned on Chart
Color code Used:
Green, BLUE =. Positive bias.
Safron, RED =. Negative bias.
RED in Between Green means Trend Finder / Momentum Change
/ CYCLE Change and Vice Versa.
Notice One thing: HOW LEVELS are Working.
Use any Momentum Indicator / Oscillator or as you "USED to" to Take entry.
━━━━━🟥🟧🟨🟩🟦🟪⬛━━━━━
⚠️ DISCLAIMER:
The information, views, and ideas shared here are purely for educational and informational purposes only. They are not intended as investment advice or a recommendation to buy, sell, or hold any financial instruments. I am not a SEBI-registered financial adviser.
Trading and investing in the stock market involves risk, and you should do your own research and analysis. You are solely responsible for any decisions made based on this research.
"🔔As HARD EARNED MONEY IS YOUR's, So DECISION SHOULD HAVE TO BE YOUR's".
━━━━━🟥🟧🟨🟩🟦🟪⬛━━━━━
❇️ Follow notification about periodical View
💥 Do Comment for Stock WEEKLY Level Analysis.🚀
📊 Do you agree with this view?
✈️ HIT THE PLANE ICON if this technical observation resonates with you. It will Motivate me.
━━━━━🟥🟧🟨🟩🟦🟪⬛━━━━━
💡 If You LOOKING any CHART & want for Level and ANALYZE?
Share your desired stock names in the comments below! I will try to analyze the chart Levels, patterns and share my technical view (so far my Knowledge).
If Viewers think It can identify meaningful setups. Looking forward to hearing from all of you — let's keep this discussion going and help each other make better trading decisions.
___________🔕^^^⚫⚪^🙏🏼🙏🏼🙏🏼^⚪⚫^^^🔔___________ Will Gold Break Higher or Retest Support First?Gold has recovered from the lower support, but now price is testing a very important reaction area. This is where the next move can become much clearer.
THE SIMPLE READ
Gold bounced strongly from the 4,226 area and is now trading near 4,320.
This looks positive, but price is also sitting close to a resistance and volume reaction zone. That means buyers are active, but they still need to prove strength above the next level.
For beginners, this is a simple lesson:
A bounce is good, but a confirmed breakout is stronger.
WHAT I SEE
The key area right now is 4,320 - 4,332.
This zone matters because it combines volume reaction, Fibonacci level, and short-term resistance. If buyers can break and hold above 4,332, the recovery may continue higher.
Above that, 4,380 is the next resistance zone.
This is the area where gold may slow down again if the bullish move continues.
Below the market, 4,274 is the first clean support zone.
If gold cannot break above 4,332, price may pull back toward 4,274 first. This zone is important because buyers may use it as a place to defend the recovery.
The deeper support is 4,226.
If 4,274 fails, gold may return toward this lower support before finding balance again.
THE PLAN
📈 IF gold breaks and holds above 4,332:
→ Buyers may gain more control
→ Price may continue toward the next resistance zone
→ Possible entry idea: after confirmation above 4,332
→ Invalidation: back below 4,320
→ Target 1: 4,350
→ Target 2: 4,380
📉 IF gold rejects from 4,320 - 4,332:
→ A pullback may come first
→ Price may retest the 4,274 Order Buy zone
→ If buyers react well there, gold may try another recovery
→ Possible entry idea: wait for bullish reaction around 4,274
→ Invalidation: below 4,226
→ Target 1: 4,320
→ Target 2: 4,332
⏳ No confirmation = no trade.
💡 Tiara’s Tip:
When price reaches resistance after a strong bounce, do not rush to buy just because the candles look bullish.
A clean setup usually comes from one of two things:
Price breaks resistance and holds above it.
Or price pulls back to support and buyers defend it.
Both are better than chasing in the middle.
YOUR TURN
💬 What’s your view on gold today — breakout above 4,332 or pullback to 4,274 first?
Drop a 🟢 for breakout or 🔴 for pullback below 👇 Long 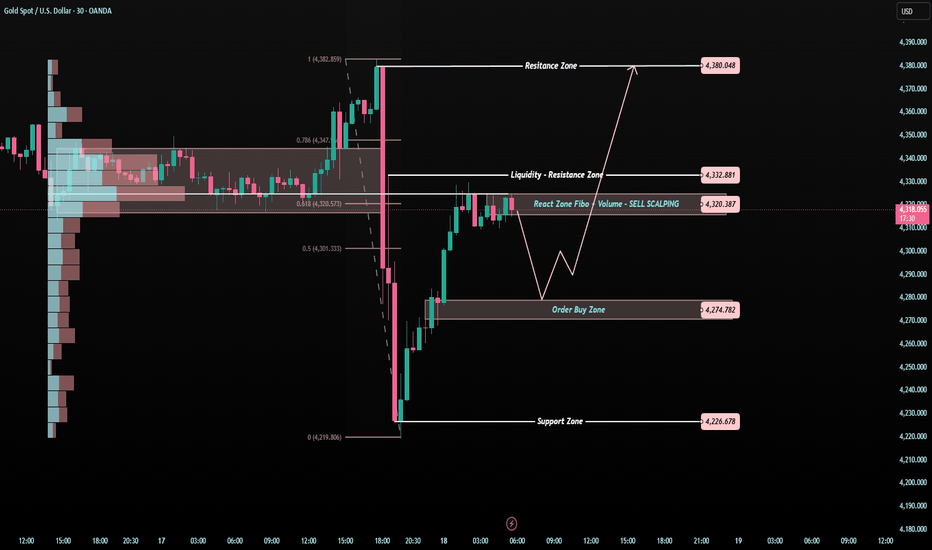
EURUSD — EMA Bearish Trend, Sell From Value Zone
Fundamental Analysis
EURUSD remains under pressure as the market continues to watch USD momentum, Fed expectations, and upcoming U.S. macro data. If the dollar stays supported, recovery attempts on EURUSD may remain limited.
For next week, the main focus is whether price can retest the value zone above before continuing lower in line with the EMA trend.
Technical Analysis
On the 4H chart, EURUSD is still trading inside a descending channel. EMA 34, EMA 89, and EMA 200 remain above price, showing that the main structure is still bearish.
Price is currently around 1.1565 after reacting from the lower support area. However, this recovery is moving toward the Fibonacci value zone and EMA resistance area near 1.1615.
The main sell zone is around 1.1612 - 1.1627. This area aligns with the 0.382 - 0.5 Fibonacci retracement, EMA resistance, previous broken structure, and liquidity above price.
The key bearish confirmation level is around 1.1500 - 1.1510. If price rejects from the value zone and breaks back below this support, the bearish continuation scenario becomes stronger.
The weekly downside target is the Fibonacci 1.618 extension around 1.1387.
Important Key Levels
Current price area: 1.1565
Main sell zone: 1.1612 - 1.1627
Value zone / Fibonacci area: 1.1612 - 1.1627
Liquidity above: 1.1644 - 1.1646
EMA resistance area: 1.1592 - 1.1646
Key support zone: 1.1500 - 1.1510
Weekly Fibonacci target: 1.1387
Invalidation area: above 1.1646
Trading Scenario
Main Sell Scenario
Entry: 1.1612 - 1.1627
Stop Loss: 1.1646
Take Profit 1: 1.1510
Take Profit 2: 1.1450
Take Profit 3: 1.1387
Sell Condition
The preferred setup is to wait for EURUSD to pull back into the 1.1612 - 1.1627 sell zone. This area is the main value zone on the chart and also aligns with EMA resistance, Fibonacci retracement, and previous broken structure.
A sell setup becomes more valid if price forms bearish rejection from this zone, such as a long upper wick, bearish engulfing candle, failed breakout, or lower high below the EMA structure.
If price rejects from the sell zone and breaks below 1.1500 - 1.1510, the bearish continuation view becomes stronger. The next downside focus would be 1.1450, followed by the weekly Fibonacci target around 1.1387.
Entry Conditions
Wait for price to retest 1.1612 - 1.1627.
Look for bearish rejection before entering sell.
A break below 1.1500 - 1.1510 confirms stronger downside pressure.
If price breaks and holds above 1.1646, the sell setup is invalid.
Overall, the main view for next week remains bearish while EURUSD trades below the EMA structure and inside the descending channel. The preferred plan is to wait for a pullback into the Fibonacci value zone, then look for sell confirmation toward 1.1510, 1.1450, and the weekly Fibonacci target at 1.1387.
Do you share the same bearish view on EURUSD, or are you waiting for a cleaner rejection from the 1.1615 value zone first?
 Long
Long
Cipla (2H): Corrective Channel and Critical Support LevelsCipla has been cooling off after a strong upward move. On the 2-hour chart, this pullback is contained within a well-defined downward parallel channel. Looking at the chart data objectively helps pinpoint where the key structural inflection levels sit.
The Primary Wave Count: A Controlled Pullback
The chart tracks a completed 5-wave upward structure that started from the structural low of 1,165.70 and peaked at 1,444.50 .
Wave 1 and Wave 2 formed the early base near 1,203.20 .
Wave 3 extended up to 1,379.50 with clear sub-waves.
Wave 4 retraced to 1,274.70 .
Wave 5 completed the whole cycle at 1,444.50 .
Since hitting that peak, the price action has trended lower in a choppy, overlapping manner. In Elliott Wave terms, this parallel channel frames a minor degree complex W-X-Y correction. Because the price remains strictly inside these parallel trendlines, the structure represents a corrective phase rather than an aggressive trend reversal.
Key Support Levels to Monitor
The final leg of this downward pattern, known as Wave Y , is moving toward a specific cluster of technical support. This area is marked by the green box on the chart:
1,315.60 : This is the 100% Fibonacci extension level, where the current downward leg equals the exact length of the first downward leg (Wave W = Y).
1,272.20 : This matches the 61.8% Fibonacci retracement level of the previous upward cycle.
If buyers step in to stabilize the price within this 1,272.20 – 1,315.60 zone, the correction may conclude. A clear breakout above the upper line of the descending channel would provide the initial signal that the primary uptrend is ready to resume.
The Structural Invalidation Level
Every technical setup requires a precise level where the idea no longer works. For this corrective layout, that line in the sand is 1,259.65 .
A decisive close below 1,259.65 completely invalidates the bullish outlook.
Falling below this point proves that the selling pressure has broken out of the corrective channel and is no longer a simple pullback.
The Alternative Count: Deeper Structural Retracement
If the market breaks past the invalidation mark, the alternative scenario takes over:
The drop from the peak turns into a new dominant downward trend rather than a correction.
In this bearish alternative case, the price would be expected to extend lower to test older primary support blocks located between 1,203.20 and 1,239.00 before a steady floor can form.
Disclaimer: This post is for educational purposes only and is not financial advice. I am not a SEBI-registered analyst. Please do your own research and manage your risk carefully. NIFTY DAILY / Short Range Level Analysis for 18th Jun 2026🔕 SGMN SplD BULLISH Above => 24153.
🔕 SGMN SplD Bearish BELOW => 24021.
Mentioned analysis based on 2 consecutive candle close in 15 min Time Frame.
━━━━━🟥🟧🟨🟩🟦🟪⬛━━━━━
💥Level Interpretation / description:
✍🏻L#1: If the candle crossed & stays above the “Buy Gen”, it is treated / considered as Bullish bias. Cfm=> Confirmation.
L#2: Possibility / Probability of REVERSAL near 🔕RL/TF1 & 🔔RL/TF2
L#3: If the candle stays above “Sell Gen” but below “Buy Gen”, it is treated / considered as Sidewise. Aggressive Traders can take Long position near “Sell Gen” either retesting or crossed from Below & vice-versa i.e. can take Short position near “Buy Gen” either retesting or crossed downward from Above.
L#4: If the candle crossed & stays below the “Sell Gen”, it is treated / considered a Bearish bias.
L#5: Possibility / Probability of REVERSAL near 🔕RL/TF1 & 🔔RL/TF2
HZB (Buy side) & HZS (Sell side) => Hurdle Zone,
✍🏻 *** Specialty of “HZB#1, HZB#2 HZS#1 & HZS#2” is Sidewise (behaviour in Nature)
Rest Plotted and Mentioned on Chart
Color code Used:
Green, BLUE =. Positive bias.
Safron, RED =. Negative bias.
RED in Between Green means Trend Finder / Momentum Change
/ CYCLE Change and Vice Versa.
Notice One thing: HOW LEVELS are Working.
Use any Momentum Indicator / Oscillator or as you "USED to" to Take entry.
━━━━━🟥🟧🟨🟩🟦🟪⬛━━━━━
⚠️ DISCLAIMER:
The information, views, and ideas shared here are purely for educational and informational purposes only. They are not intended as investment advice or a recommendation to buy, sell, or hold any financial instruments. I am not a SEBI-registered financial adviser.
Trading and investing in the stock market involves risk, and you should do your own research and analysis. You are solely responsible for any decisions made based on this research.
"🔔As HARD EARNED MONEY IS YOUR's, So DECISION SHOULD HAVE TO BE YOUR's".
━━━━━🟥🟧🟨🟩🟦🟪⬛━━━━━
❇️ Follow notification about periodical View
💥 Do Comment for Stock WEEKLY Level Analysis.🚀
📊 Do you agree with this view?
✈️ HIT THE PLANE ICON if this technical observation resonates with you. It will Motivate me.
━━━━━🟥🟧🟨🟩🟦🟪⬛━━━━━
💡 If You LOOKING any CHART & want for Level and ANALYZE?
Share your desired stock names in the comments below! I will try to analyze the chart Levels, patterns and share my technical view (so far my Knowledge).
If Viewers think It can identify meaningful setups. Looking forward to hearing from all of you — let's keep this discussion going and help each other make better trading decisions.
___________🔕^^^⚫⚪^🙏🏼🙏🏼🙏🏼^⚪⚫^^^🔔___________  Long
Long
 Long
Long