NFP Incoming - Will SPX Smash 6100?NFP Incoming – Will SPX Smash 6100? | SPX Market Analysis 7 Feb 2025
The bulls keep charging as SPX edges closer to 6100. But with the NFP report dropping pre-market, things could get lively.
Will we blast through resistance or bounce back down? Expect some whipsaw chaos before the market settles – but with a bullish trend already in play, we should at least get one more push toward target exits before the dust settles.
---
SPX Deeper Dive Analysis:
📈 Bullish Move On Track
SPX has ridde
Fibonacci Confluence
$BTC/USD We'll need some Bulls to step up here...I'm seeing this Green Daily candle push it's way up and out of the "Demand Zone", while running into some expected resistance from a recent downtrend line (Red), a couple High Volume Shelves, and some Fib levels that coincided with recent price action & short-term reversals (Within the Red Circle or Elipse, and Horizontal shaded Rectangle slightly above)...
What do you think... Will we follow the Blue Arrow to the upside? Or does it need some more "Timeout" at these levels, or perhaps down towa
Fibonacci Retracements: Finding Key Levels the Easy WayIn this video, I’ll walk you through how I use Fibonacci retracements to spot those key pullback levels where price might bounce and keep trending. It all comes from an old-school math genius named Leonardo of Pisa (aka Fibonacci), but don’t worry – no crazy math here, just practical trading tools.
The main levels I focus on? 38.2%, 50%, and 61.8%. IF price holds at one of these levels, THEN it’s a good sign the trend could keep going. IF NOT, THEN I stay ready for a deeper pullback. Using this
(BTC) bitcoin "BB Trend - long range view"Here is another look at the BollingerBand Trend indicator with a greater reach in view. As seen in the graph with correlated indicator BTC reached a red zone at the time when the price was at its highest this year before falling and as the price fell the indicator began to rise once more. Being in a red, or under 0, with the BBTrend indicator right now and what does it mean is a good question to try to answer. There are too many indicators and all of them cannot be laid on top of one another to
BTC : Fibonacci Grid
Time and Space only exist between two points.
You can build an entire grid system using only two points, and multiples of the distances between those two points.
On a price and time scale, this can be useful in establishing critical levels used to assist us with trading.
Which two points you choose can unfold entirely different results.
In this example,
two relatively recent points were chosen to maximize accuracy and effectiveness of the grid in relation to the most current candles.
This
DAX (GER40) Is Still BrearishDax has taken a little different route. It has been consolidating but last week, it created a massive bearish engulfing candle. Which can push the price to the FCP zones below. If the first one fails we have an M pattern completion at the second FCP zone. Beware of a gap around 17200 level.
If you found this interesting please consider supporting this analysis by liking, commenting, and sharing with friends, colleagues, traders, and trading communities. Thanks👍🙂
Before:
EURNZD Trade PlanEURNZD has completed a W FCP pattern but did not reverse. It is now at a structure resistance level which can make it fall. Wait for sell confirmation. If that comes this can be a good short opportunity.
If the price breaks and confirms the previous high, we will go long based on the confirmation.
If you found this interesting please consider supporting this analysis by liking, commenting, and sharing with friends, colleagues, traders, and trading communities. Thanks👍🙂
EURCAD Can Fall Fall Further DownThe last standard W pattern had failed. EURCAD completed an extended W pattern. It showed some rejection from the top. We have a support level in there. If this support levels is broken and confirmed with a bearish signal, we can see a good short opportunity. Targets are on the screen:
If you found this interesting please consider supporting this analysis by liking, commenting, and sharing with friends, colleagues, traders, and trading communities. Thanks👍🙂
AUDCHF Possible BUY AreaAUDCHF completed a W FCP pattern. This made the price fall. It has fallen hard and could possible be going towards the area where we have confluence of an FCP zone and 2 trend lines. This can be a good Buy area for a possible bounce up.
As always wait for the confirmation on the smaller time frame.
If you found this interesting please consider supporting this analysis by liking, commenting, and sharing with friends, colleagues, traders, and trading communities. Thanks👍🙂
USDCHF Zone To Watch Out ForUSDCHF is at a resistance zone. If the market make it a support zone and gives a bullish confirmation above it, it can be a good buying opportunity.
At the moment it is at resistance level so if you want to go long, you must wait for a proper confirmation. Remember Buy at support and Sell at resistance :)
If you found this interesting please consider supporting this analysis by liking, commenting, and sharing with friends, colleagues, traders, and trading communities. Thanks👍🙂
NZDUSD Can Rise From The FCP Zone & M PatternNZDUSD Can Rise From The FCP Zone & M Pattern
As the chart indicates, we have an M pattern completion along with and FCP zone on the daily time frame. Wait for a confirmation based entry on smaller time frames. This can be a good day trade or swing trade opportunity depending on your trading plan.
If you found this interesting please consider supporting this analysis by liking, commenting, and sharing with friends, colleagues, traders, and trading communities. Thanks👍🙂
Potential Buy OrderSummary
The analysis reveals an upward trend in the exchange rate. The recent drop was expected due to overbought conditions, with prices now recovering towards the resistance level at 163.25. The Fibonacci analysis indicates significant support levels at 157.35, while resistance is identified at 162.00. Technical indicators suggest that it is too early to place safe buy orders.
Trend Determination
The direction of the exchange rate in recent times is depicted by the primary upward trend cha
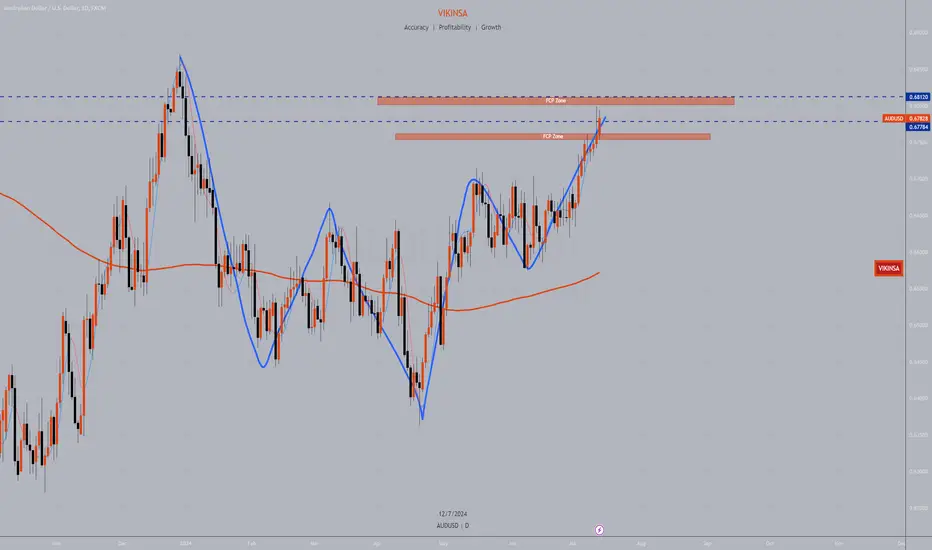
AUDUSD W pattern completion - Can FallAUDUSD has reached an area where it has completed a complex W pattern. There are a few levels and zones (as on the chart) to be watched.
When W pattern completes, a correction comes. This idea is on the daily time frame, so wait for a confirmation on smaller time frame to execute trades.
If you found this interesting please consider supporting this analysis by liking, commenting, and sharing with friends, colleagues, traders, and trading communities. Thanks👍🙂
USDJPY Higher Time Frame AnalysisJapanese Yen collapse continues with its lowest closing price in 34 years. If it falls through 160, it will be the lowest level against the U.S. Dollar since the 1980s. It can get even worse. Let's look at some charts:
1. We are currently sitting at 160 resistance level where a W FCP pattern is completed which can give us a correction. This is the last level which is preventing the USDJPY from slingshotting upwards.
2. A CUP formation is happening at the moment (rounding bottom). So if the cor
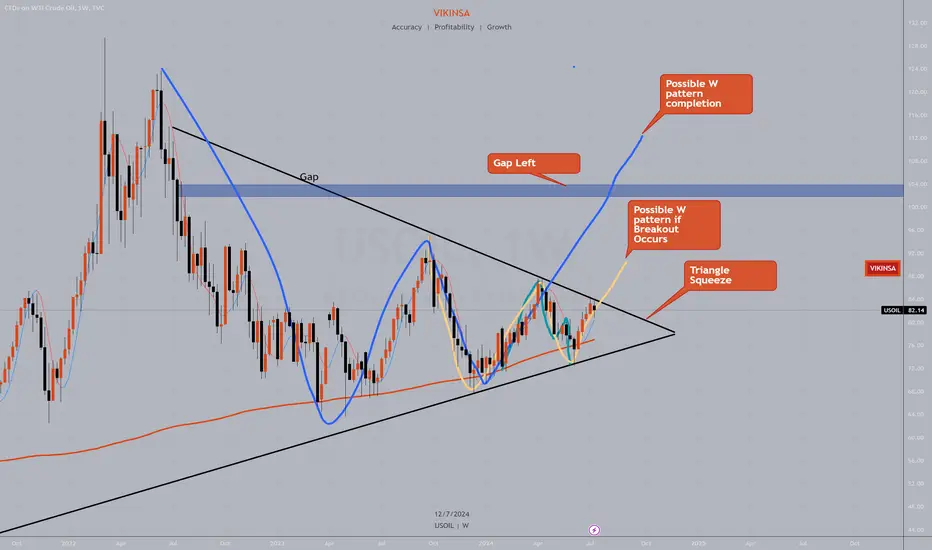
USOIL Higher Time Frame Possible Bullish ScenarioThis is higher time frame bullish scenario on USOIL (WTI). This is only applicable if a bullish breakout occurs.
1. The price is inside a triangle which is getting squeezed and reaching its apex. That means we are going to have a breakout very soon.
2. Recently the price completed and M pattern and jumped higher. When M pattern completes the market goes higher.
3. If we get a bullish breakout from this triangle and if this breakout confirms, we can have formation of a potential W pattern. T
GBPUSD - Watch 1.3 round number and LevelsGBPUSD had an explosive move last week. This was mainly due to a fall in USDJPY from a resistance level that I shared. See the attached chart. This made DXY fall and most of the USD based pairs felt the impact of that. Now GBP use is back in a possible resistance area. Watch out for a W pattern and these levels.
If you found this post useful or information please support this analysis by liking and sharing. 👍✔ Also us for more.
5ADR - Average Range of Last 5 CandlesticksAverage Daily Range (ADR) Indicator for the Last 5 Days
This script calculates the Average Daily Range (ADR) for the last 5 trading days. It helps traders to understand the average movement in pips, providing insights into potential price movements.
How to Use:
Set Chart to Daily Timeframe : Ensure your chart is set to the daily timeframe.
Hover Over Previous Day : To see the ADR for today, hover your mouse over the previous trading day.
For example, if today is Tuesday, hover over Mond
Indicator
From Leonardo to Trading: The Evolution of Fibonacci LevelsIn the labyrinthine landscape of financial markets, where volatility reigns supreme and uncertainty lurks around every corner, traders seek reliable navigational tools to steer through the tumultuous waters of price movements. Among the myriad techniques at their disposal, Fibonacci analysis emerges as a stalwart companion, offering a nuanced understanding of market dynamics rooted in mathematical precision. In this comprehensive exploration, we delve deep into the multifaceted realm of Fibonacc
Divergence into a Reversal?? - AUHere I have AUD/USD on the 1Hr Chart!
Our two current Lows @ ( .9498 ) on Wed. April 10th and ( .9456 ) on Fri. April 12th show an interesting underlying story when it comes to our indicators!
1) Looking to the RSI and comparing the Lows to Price on the chart, we can see that the RSI is showing a STRONG Divergence meaning Price could potentially be looking to move up now!
2) Our Momentum & Volatility indicators are showing Consolidation or Sideways movement meaning there is really no more tre
BKNG may reverse SHORTBKNG is an expensive stock; it id not get that way being a slouch. Summer travel is sixty days
away. The 2H chart shows the highs of February followed by a paradoxical fall with good
earnings. Traders wanted better. Price fell past the Fibonacci support zone and into
the lower VWAP band lines.
Fundamentally German regulators are suing BKNG for some issues with deceptive advertising
and promotions with partners. In the past week price again rose this time to stall in that same
Fibonacci
Bitcoin: Bull Run Targets through FibonacciLet me explain. These are all Fibonacci Extensions. The Market Maker is officially done imo so I am very comfortable posting these finished schematics. Many Extensions reach the exact ATH at 69k as you can clearly see...
The Schematics are numbered Chronologically.
#1-#8 are placed in the order they were created.
#3 are the SUPPORT Schematics that are highlighted in RED.
#1 and #2 are monthlies because they are considered longer term.
HOWEVER, every single schematic can affect any timefra
How to Find a High Probability Trade in an Uptrend Hey Traders,
We'll show you how you can find an easy trade with a high risk-to-reward ratio using some basic concepts.
- Step One: Spot an uptrend where you have higher highs and higher lows.
- Step two: Spot the last break of structure.
- Step three: Use the Fibonacci tool and connect it from the recent lows to the recent highs.
- Step Four: Watch prices coming back to the broken structure that lines up with any Fibonacci level. ( Focus on the 50% - 61.8% - 78.6% Levels )
- Step Fiv
Inventing the "Growth" Story of Inventure "Growth & Securities"Inventure - A leading provider of investment advisory service and distributes financial products like mutual funds, insurance products, etc.
The stock turned Multi-bagged when it multipled from 0.80 / Share to 6.75 / share in a matter of 22 months. Now - after a perfect 0.786 retracement on the Fibonacci scale - it is all set to beat its earlier bull run.
Here are the Technicals:
Fib 0.786 Retracement on Monthly
Perfectly following a Parallel Channel on monthly since 10 years
A beautiful