Nifty next moves After a weak session today, nifty is ready to head towards 14000, if nifty goes below 14412-15, next target would be 14340-14230-14100 as shown the fibonacci levels. Break of these levels are necessary for next target and pullback will be there for shorting opportunity.
But overall after 14412-15 break 14100-13900 doors will be open with both hands.
On the upside to move towards 15000 again nifty need to break 14725 level and sustain to go towards 15000-15300
Fibonacci Extension
Nifty to start 5th Wave towards 15100This is internal move of nifty we can call iii of 3 completed at 15044.
Wave ii was shallow and complex
Wave iv is zig zag retraced nearly 0.618 Fibonacci
Reversal expected near 14605
Stop loss is top of wave i which is 14557
wave v of 3 is expected to go towards 15120 levels
DISCLAIMER:There is no guarantee of profits nor exceptions from losses.
Technical analysis provided on the chart is solely the personal views of my research.
You are advised to rely on your own judgments while taking an
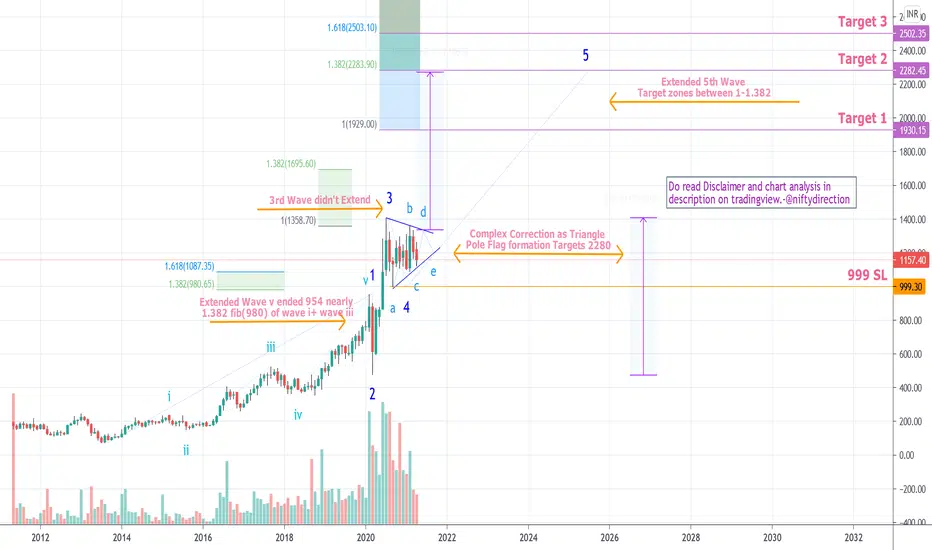
Muthooth Finance Extened 5th Wave and Pole Flag FormationAll analysis visible in chart.
DISCLAIMER:There is no guarantee of profits nor exceptions from losses.
Technical analysis provided on the chart is solely the personal views of my research.
You are advised to rely on your own judgments while taking any investing/Trading decisions.
Past performance is not an indicator of future returns. Investment/trading is subject to market risks.
Seek help of your financial advisors before investing/trading.
Not recommended to take FnO positions based on this
Cup 'n' Handle lift OXT to BOn the 4hr, calling it a cup and handle ready to take OXT to B. Closing bag at 0.70, then retrace to jump back in around 0.65 at C. Closing 0.80 to finish D. I was trying to make out a large head and shoulders on the 1D but not sure if that is lining up right. What are your thoughts?
Information stated here is not financial advice. Your own research is recommended. Happy trading!
Kiri Industries New Impulse wave start850 minimum target of wave 3
1100 is most probable target which is near 1.618 fibonacci levels.
Long with Stop-loss given on chart.
DISCLAIMER:There is no guarantee of profits or no exceptions from losses. The study provided is solely the personal views of my research. You are advised to rely on your judgment while investing/Trading decisions. Past performance is not an indicator of future returns. Investment is subject to market risks. Seek help of your financial advisors before investing/tra
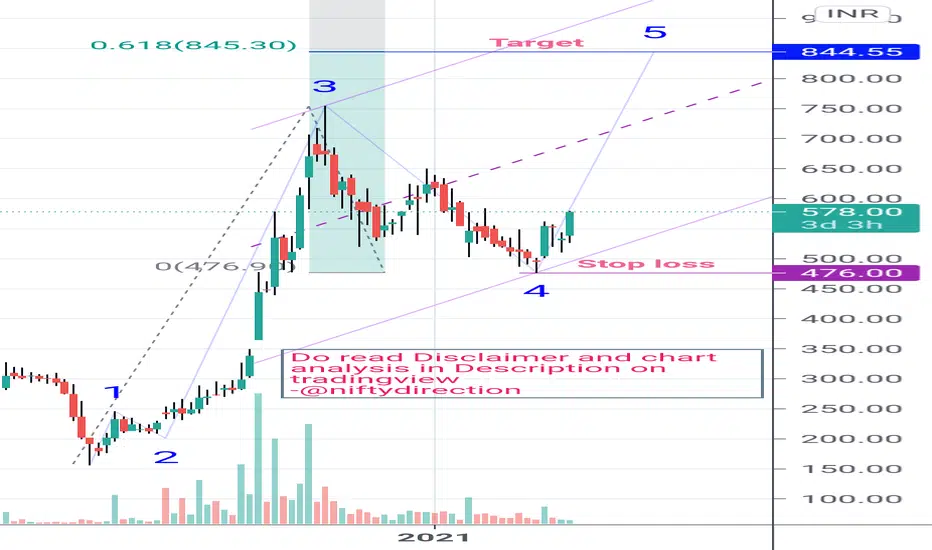
Nucleus Software Exports 5th waveLong near 550-60 SL 476 tgt 840+
DISCLAIMER:There is no guarantee of profits or no exceptions from losses. The study provided is solely the personal views of my research. You are advised to rely on your judgment while investing/Trading decisions. Past performance is not an indicator of future returns. Investment is subject to market risks. Seek help of your financial advisors before investing/trading.
I may or may not trade this analysis
--------------------------(((((LIKE)))))---------------
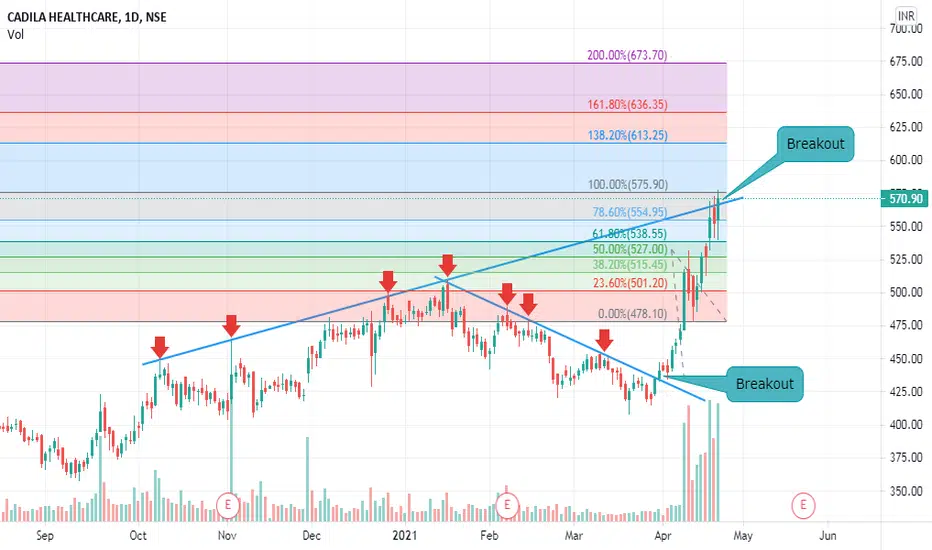
Cadila Healthcare: Fibonacci ExtensionAll levels are marked in the chart only.
Cadila Healthcare can begin a new bull run on technical levels......analysis is also backed by news of Virafin(an antiviral produced by Cadila Healthcare) being given emergency approval for treatment of moderate COVID-19 patients.
Volume has also increased drastically.
Cadila has also given closing above a trendline which was previously acting as resistance for the price to move up.
CLong
Cadila Healthcare: Fibonacci ExtensionCadila Healthcare perfectly retraced from 0.618 Fibonacci level. With the increase in volume as price moved up and the news of Virafin getting approval for treatment of moderate COVID-19 patients Cadila seems to be in a very strong up move.
On Fib Extension 1.618 level(Rs. 640) can be reached very shortly.
Cadila has also given closing near a long term trendline resistance.
CLong
ICICI Prudential Life Insurance Wave 3 startedEasy target 600-50 channel top.
Potential targets 730+, 1.618 fibonacci extensions comes 900+
Agressive targets with SL 432.
DISCLAIMER:There is no guarantee of profits or no exceptions from losses. The study provided is solely the personal views of my research. You are advised to rely on your judgment while investing/Trading decisions. Past performance is not an indicator of future returns. Investment is subject to market risks. Seek help of your financial advisors before investing/trading.
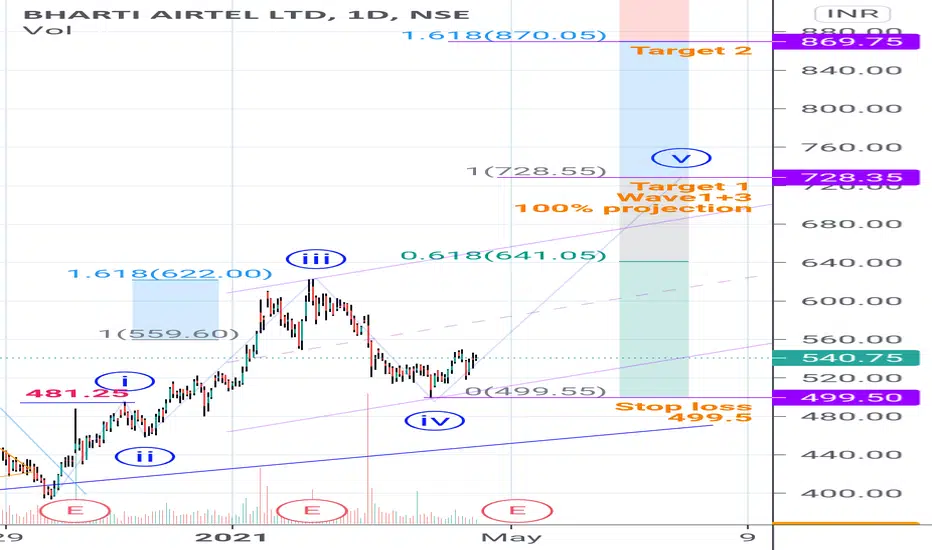
Airtel to start 5th WaveAirtel 2nd wave was shallow but 4th is deep zig zag and 3rd wave is normal went upto 1.618 that is 622. 5th wave minimal target 0.618 is 641 but would get extended 100% or beyond as well. Signs of extension will be 641 break and channel drawn 3-4 break.
Long on any dip towards 530-515 with stop loss 499.5
Top of wave 1 is 481 ideally that should be stop loss.
DISCLAIMER:There is no guarantee of profits or no exceptions from losses. The study provided is solely the personal views of my resear
Bajaj Finance forming Weekly Hammer and to start 5th WaveBajaj Finance in wave 4 made double zig zag(wxy) and took support in zones 0.5 and 0.618 fibonacci level wave 2-3.
On weekly chart hammer is geeting formed which is trend reversal sign still one day left to complete week.
3rd Wave didn't went above 1.618 so its not extended so as one (sometimes two) of the wave five waves gets extended.
5th Wave least target new high which is equal to Wave 1 6400 or bit more 0.618 fibonacci extension of wave1-3 viz 6900.
Most like 5th would get extended t
Gujarat Alkalies Flag formation and start of Wave 3Stock in flag consolidation since long time and on verge of breakout.
Long near 360-70 with Stop loss 302
Minimal target 512-15 of Wave 3 or C.
Agressive targets posted as Wave iii can be possible as consolidation is quite high
DISCLAIMER:There is no guarantee of profits or no exceptions from losses. The study provided is solely the personal views of my research. You are advised to rely on your judgment while investing/Trading decisions. Past performance is not an indicator of future retur
Ashok Leyland Eyeing New All Time highAshok Leyland has completed wave 4 and looking to head towards new all time high 170+
Long near 120 with stop loss 107
DISCLAIMER:There is no guarantee of profits or no exceptions from losses. The study provided is solely the personal views of my research. You are advised to rely on your judgment while investing/Trading decisions. Past performance is not an indicator of future returns. Investment is subject to market risks. Seek help of your financial advisors before investing/trading.
I may
PHILIPCARD | BUYPHILIPCARB has shown a good entry point today.
Trend based indicators show:-
Crossover of 10EMA over 20EMA (BUY)
Crossover of +DI over -DI (BUY)
MACD line entering bullish zone (BUY)
Volume based indicators:-
CMF showing convergence since 3rd of March (BUY)
Ichimoku cloud strategy:-
Price crossover above cloud (BUY)
Tenkan sen crosses above kijun sen
Targets:-
1st target:- 224
2nd target:- 227
3rd target:- 232
Notes:-
I am currently using the a free account and so i cannot attach
P
Nifty C wave Pending of FallNifty short near 14730-40 zone where 2 of C is expected to complete with SL 14780.
Or on confirmation fall 14649 break for downside target 143360-200-100
3-4-5 waves are imaginary and can change
DISCLAIMER:There is no guarantee of profits or no exceptions from losses. The study provided is solely the personal views of my research. You are advised to rely on your judgment while investing/Trading decisions. Past performance is not an indicator of future returns. Investment is subject to market r
Astrazeneca starting 5th WaveStock moved 14% last session with 2931 stop loss we can ride 5th wave for given targets on chart
DISCLAIMER:There is no guarantee of profits or no exceptions from losses. The study provided is solely the personal views of my research. You are advised to rely on your judgment while investing/Trading decisions. Past performance is not an indicator of future returns. Investment is subject to market risks. Seek help of your financial advisors before investing/trading.
I may or may not trade this
Adani Enterprises 5th of Wave ASell on 977 break for 947. Stop loss will be high of previous candle breaking 977.
DISCLAIMER:There is no guarantee of profits or no exceptions from losses. The study provided is solely the personal views of my research. You are advised to rely on your judgment while investing/Trading decisions. Past performance is not an indicator of future returns. Investment is subject to market risks. Seek help of your financial advisors before investing/trading.
I may or may not trade this analysis
----
Tata Steel Ending diagonal in 5th WaveTata Steel started fresh impulse post march 2020 lows. It had retraced deep from previous high 748 to 250 levels.
Currently 5th of Impulse is ending diagonal with upside range towards 893 and all time high 902.
If breaks 902 which is tough if will head towards 1100 chart may be re posted with updated targets
DISCLAIMER:There is no guarantee of profits nor exceptions from losses.
Technical analysis provided on the chart is solely the personal views of my research.
You are advised to rely on yo
JSW Steel Extended 3rd and 5th Waves and Channel ResistanceStock has spectacular rally after March 2020 lows due to extended 3rd and 5th Waves.
The channel has been drawn between mar 2020 lows and previous all time high.
Now V of 5th is ending diagonal and Negative divergence seen on MACD.
Break of lower channel line of ending diagonal would confirm downside which is expected to go 0.618 or more.
Alternative to this analysis If stock moves past 460 it can head towards next Fibonacci extension points 485/524
DISCLAIMER:There is no guarantee of profi
Asian Paints 5th wave startingLong zones 2500-2400 stop loss 225
Target 3100-3150
DISCLAIMER:There is no guarantee of profits or no exceptions from losses. The study provided is solely the personal views of my research. You are advised to rely on your judgment while investing/Trading decisions. Past performance is not an indicator of future returns. Investment is subject to market risks. Seek help of your financial advisors before investing/trading.
I may or may not trade this analysis
--------------------------(((((LIKE)