LiamTrading – GOLD Weekly Plan ..GOLD Weekly Plan: Prepare for a Breakthrough to a New ATH
The new trading week opens with extremely complex sentiments — many traders are confused, and even the “big players” are cautious.
But if you look closely at the price structure, everything becomes clear: gold is still in a sustainable uptrend.
🧠 Psychological & Trend Analysis
Gold has just closed the week with a strong upward momentum, confirming the continuation of the medium-term uptrend.
At this stage, “Selling at the peak” is almo
Fibonacci Extension
Gold Outlook: Eyeing $4,000 – Fibo Expansion Zones in PlayGold continues to benefit from safe-haven demand as political risks in Washington and mixed U.S. data keep investors cautious. The metal is trading inside a clear bullish channel, with Fibonacci projections suggesting further upside before any major correction.
📊 Technical Deep Dive – H4 Structure
🔹 Fibonacci Confluence
The current rally respects 0.618 retracement at $3,820 and 0.786 retracement near $3,872, confirming algorithmic order flow.
Next expansion points are sitting at Fibo 1.5 – 1
Gold Trading Plan | Limited Downside, Key Fibo Zones in Play🌍 Market Context
Gold is facing renewed selling pressure after yesterday’s bounce from the $3,820 area.
Risk-on sentiment and fresh USD buying are weighing on XAU/USD.
However, expectations of Fed rate cuts later this year and geopolitical tensions remain supportive, limiting deeper downside moves.
📊 Technical Analysis – Fibo Matrix Setup
🔴 SELL Reaction Zones
386x – 388x (Fibo retracement 0.5 – 0.618 + 0.786 confluence)
→ Intraday SELL scalp zone with strong rejection probability.
3881 – 3
XAUUSD Daily Plan – Gold’s Pullback Before the Next Leg Higher📊 Market Overview
Gold has pulled back from its fresh record highs but the move looks more like healthy accumulation than a reversal. The 3,800 zone has acted as a strong support, absorbing selling pressure and keeping the broader bullish trend intact. Immediate rebounds confirm that buyers are still in control, preparing for the next breakout.
📍 Key Levels to Watch
🔴 SELL Reaction Zone
3,871 – 3,872 → First resistance level, possible short-term rejection.
3,915 – 3,920 (Fibo Liquidity Zone) →
XAUUSD – Gold Daily Plan | Sharp Drop, What’s Next?Gold printed a sudden 70+ point drop from 388x to 380x, leaving traders questioning:
– Was this a big player manipulation?
– Or simply institutional profit taking?
Key reaction zones will define if Gold holds above 3800 or dives deeper.
📍 Critical Levels
🔴 SELL Reaction Zone
387x → Strong resistance where sellers may step in.
🟢 BUY Zones
3780 (Retest Breakout + Trendline) → First demand zone.
375x (Fibo Support Zone) → Strong liquidity pocket, potential reversal.
🎯 Trading Scenarios
1️⃣ SE
Gold Bulls in Control: Buy Zones Lined Up for the Breakout!📊 Market Context
Gold is trading near record highs around $3,850, heading toward its best month in 14 years. With Q3 2025 and September closing, gold has surged nearly 12% this month, driven by rising safe-haven demand amid the looming U.S. government shutdown and weaker USD sentiment.
The bullish structure remains intact, and dips continue to attract aggressive buyers.
📍 Key Trading Levels
🟢 BUY Zones
3846 – 3843 → Intraday BUY scalp zone
SL: 3836
TP: 1R → 2R → 3R → 4R (hold longer if above
XAUUSD – Gold Bulls Eye New Highs | Francis FiboMatrix Plan📊 Market Outlook
Gold keeps climbing with momentum, now approaching the 3,800$ zone. The market is fuelled by expectations of more Fed rate cuts and rising demand for safe-haven assets as global uncertainties stay elevated.
Silver is also breaking higher, heading toward its historic $50 target, confirming the broader strength in precious metals.
📍 Trading Levels
✅ BUY Zone: 3782 – 3780
🛑 Stop Loss: 3772
🎯 Take Profits:
TP1 → 3800
TP2 → 3829
TP3 → 3848
TP4 → 3885+ (long-term hold if 377x holds
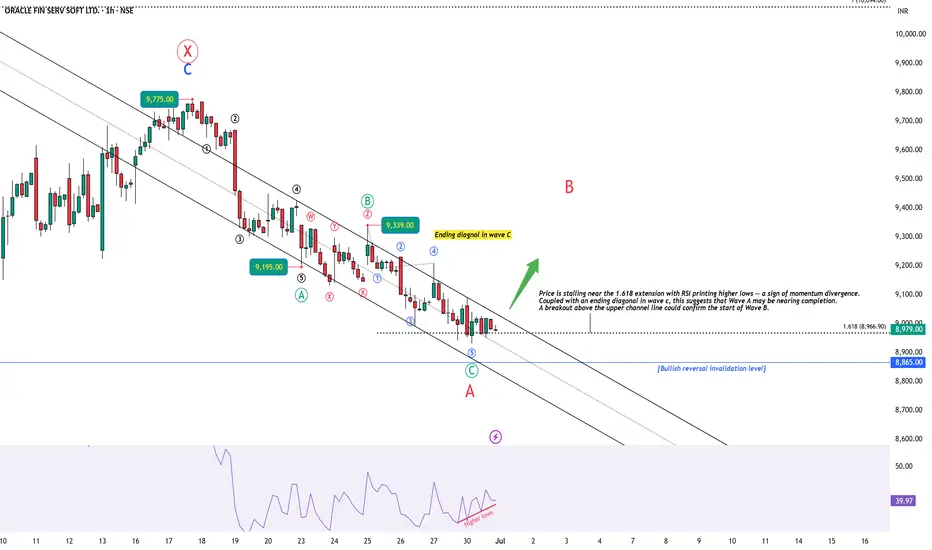
OFSS: Setting Up for a Relief Rally?🔍 Introduction
This analysis starts from the 1-hour timeframe, where price action shows signs of exhaustion at the tail end of a 5-wave decline. A classic ending diagonal in wave c, along with bullish RSI divergence, points toward a potential short-term reversal — possibly the start of Wave B in a larger A-B-C corrective structure. We then zoom out to place this setup within a broader W-X-Y correction that began from the 13,220 high.
🕐 1H Chart: Ending Diagonal + RSI Divergence into Key Zone
AU Small Finance: Final Push or Start of a Pause?AU Small Finance Bank has delivered a impulsive rally over the last few months. Starting from the March lows near 478, price unfolded into a clean 5-wave structure that carries all the classical Elliott Wave characteristics. Each leg followed the rules beautifully — with Wave 3 extending nicely, Wave 4 forming a triangle, and Wave 5 launching higher from there.
At present, Wave 5 has already reached 808, which satisfies the minimum Fibonacci projection of 1.0 (792) measured from Waves 1 through
BEL hits key level, a cool off ahead before next leg up?Bharat Electronics is unfolding a clean impulse. After completing Wave ii at 304.80, price surged into Wave iii, which has now reached the 1.618 Fibonacci extension near 410. Interestingly, while price made new highs, RSI is showing early signs of bearish divergence, hinting at a possible Wave iv pullback. The retracement zone between 385 and 370 may act as support before the uptrend resumes. As long as price holds above 319, the bullish structure remains valid.
Disclaimer:
This analysis is fo
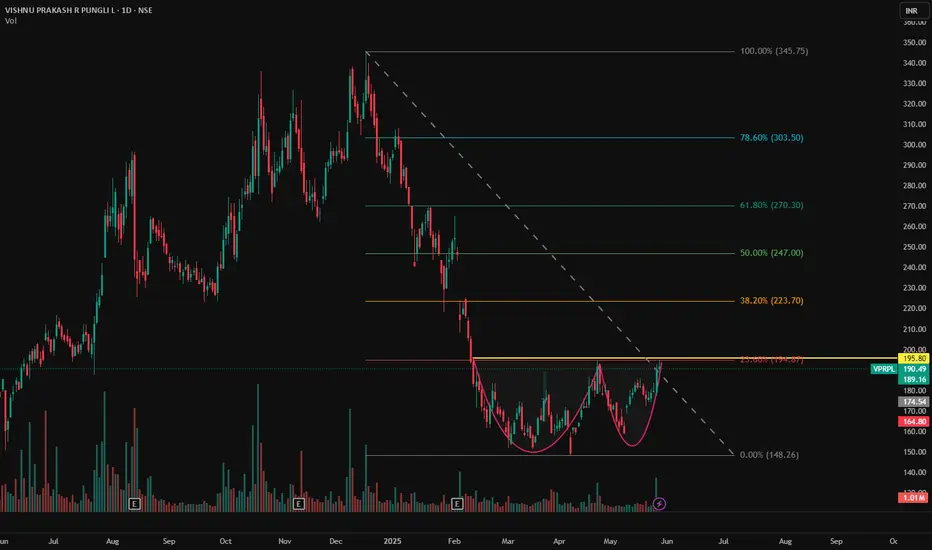
VPRPL - NSE | Daily Timeframe📊 VISHNU PRAKASH R PUNGLIA LTD (VPRPL) – NSE | Daily Timeframe
📅 Date: May 29, 2025
📈 CMP: ₹190.49 (−0.41%)
📌 Ticker: NSE:VPRPL
🧠 Technical Overview
✅ Cup & Handle Pattern in Formation 🍵
Price action is carving out a clean Cup & Handle base near the ₹195.80 resistance zone. A breakout above this neckline could ignite a fresh upside rally. The symmetry, volume spike, and recent bullish structure are all supporting potential continuation.
🧪 Volume Analysis
Noticeable volume increase as the price
DIVISLAB - Cup Pattern Breakout with Bullish Flag Consolidation📊 DIVISLAB – Cup Pattern Breakout with Bullish Flag Consolidation
🕰️ Timeframe: 1W | 🔍 Pattern: Cup Formation + Bullish Flag | 🚀 Long-Term Breakout Potential
📈 Technical Breakdown:
DIVISLAB has formed a massive Cup pattern on the weekly timeframe and is currently consolidating inside a Bullish Flag after hitting the neckline breakout. This is a classic continuation setup following a long accumulation.
Post breakout, the price tested the upper region and is now preparing for a potential next le
Shocked by Nifty50's sharp correction? Don't worry!Today NIFTY has crashed by 350+ points and reached 23165, a correction from 23800 levels .
Let me explain, This Nifty Daily chart is a classic example of how many fundamentals of Technical Analysis are satisfied.
1) Old resistances in 2024 at 22800 will now become Support levels
2) If it goes to 23000 and stops at 22800 levels it also fulfils the Wave 4 criteria, which says that Wave 4 never gets in Wave 1 territory
3) If this happens, the chart also completes an Inverse Head and Shoulder's Ri
USD/INR - Where the rupee is heading, Will it reach the 90s?FX_IDC:USDINR
Looking at the daily chart of USD/INR we can see a breakout at 86.68 level. And now there is a retracement from 87.95 levels. The question is whether it will make a new high or not, should we remain bullish on USD?
Let's refer the history to find a high probability answer.
From Oct'18 prices consolidation for 1.5 years. During this period there was cup and handle (C&H) formation followed by a breakout in Feb-20 @72.5 INR.
Note that the base of the handle was at 70.55 INR.
Nifty50 - November 2024 viewIn my October view, I had mentioned that it is time to be cautious as Nifty was near an important zone of 26240-26270 and we have seen more than 2000 points fall since then.
FIIs have sold more than 1.3 lakh crore of equity in last 40 days.
Let's analyze what can be expected in this month. We have seen nearly 10% correction from ATH in Nifty50. 23900 is acting as a support currently which is also its 78.6 % fib extension.
On the downside:-
Below 23900, I am expecting at least 23300 which is n
Nifty 50 - Portfolio Colour similar to color of Christmas?Year endings have historically been famous for a big correction and 2024 is no different.
As I had mentioned in my previous idea, 23900, 23300 are crucial support to Nifty and 24300, 24800 are strong resistances
We had seen a good bounce from 23300 to 24780 and then a good fall once 24300 was broken again.
23200-23300 will be a key level to understand next trend for Nifty.
As we can see, there is a confluence of trendlines and demand zone around 23200.
If we see a bear trap forming at this zon
ZOMATO A CHANNEL CONSOLIDATION WILL IT BREAKOUT OR FIZZLE OUT ?Zomato Ltd. is an interesting chart in momentum with following
1. RSI on all time frames (D/W/M) above 60
2. Narrowing Bollinger Bands on daily chart with price walking near Upper Band
3. Four months long consolidation in range of 240 to 295 zone
4. ABCD pattern under formation on weekly chart
5. Major Price Supports as under:
20 SMA (daily ) 263
50 EMA (daily ) 264
20 SMA (weekly) 261
with cluster of supports in range of 260-26
ZLong
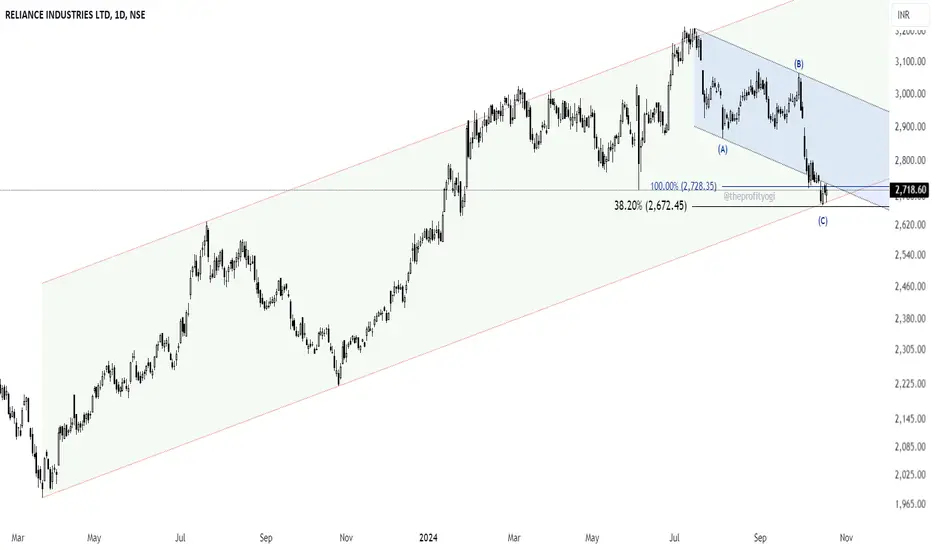
Low risk buying in RELIANCEA low-risk high probability buying setup is forming in RELIANCE.
Price is taking support at the cluster of 38.2% retracement, 100% extension of Flat correction, and trendline in red.
If the price enters and sustains in the blue channel, showing bullish pressure, it will provide a good buying opportunity with a stop loss below the recent low.
Is HDFC Bank aiming to hit 2200+ in the coming months?Reason for going long on HDFC:
Ichimoku:
HDFC stock has been sideways for years but is slowly turning bullish after hitting strong Ichimoku cloud support at 1350. It is now crossing the Tenkan-sen (TS) and Kijun-sen (KS) on the monthly chart.
Fibonacci + Fib Channel:
When we draw the Fibonacci channel and Fibonacci extension of swings, it looks like HDFC is set to hit 2200 in the coming months.
Buy on Dip:
The current market price (CMP) is 1604. Any good dip near 1450-1520 presents a gr
"Bank Nifty has broken all hurdles. Real breakout or fake?" Bank Nifty Monthly Chart Wave Analysis:
June Candle: 2 more days left for the candle to close.
Current Market Price: ₹51,575
We drew all possible resistance trendlines and channels, and Bank Nifty has clearly broken out above everything(just 3 days left for June candle to close), with the wave extending.
Elliot Wave Analysis : Initially, we counted the October 2021 high as wave 3 in our past charts. However, the current momentum and breakouts suggest it could be wave 1, and we are possibly
Is IEX ready for a 100% upmove? Charts says YESIs Indian Energy Exchange (IEX) all set to fire up?
We are expecting big targets based on the following key technical points:
Great Correction (Fib):
The price underwent a deep correction of more than 61.8%, almost reaching the 0.786 Fibonacci retracement level from the top.
Price Action Structure Change:
The price has changed structure since it broke the previous high on the monthly time frame and sustained weekly candle.
Ichimoku Confirmation:
There is a strong TS & KS breakout, and