FASP levels for Bank Nifty 09/04/2024The FASP for BankNifty is listed for 09-04-2024. You can add this levels to your trade setup for better results. This should not be the only indicator but an additional tool to increase your winning possibilities.
What is Fibolysis Anchor SupRes Points(FASP)?
It is a unique level arrived by using Fibonacci Retracement , Fibonacci Extension , Standard Pivot levels under various Timeframes. It is an extensively analyzed level to draw the support and resistance levels for the next day. You can use
Fibonacci Extension
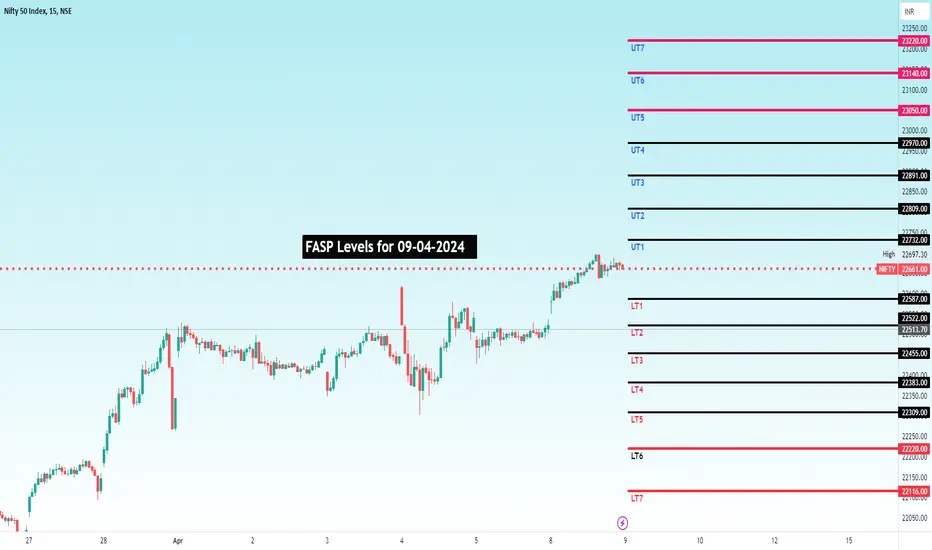
FASP levels for Nifty 09/04/2024The FASP for Nifty is listed for 09-04-2024. You can add this levels to your trade setup for better results. This should not be the only indicator but an additional tool to increase your winning possibilities.
What is Fibolysis Anchor SupRes Points(FASP)?
It is a unique level arrived by using Fibonacci Retracement , Fibonacci Extension , Standard Pivot levels under various Timeframes. It is an extensively analyzed level to draw the support and resistance levels for the next day. You can use the
FASP levels for Bank Nifty 05/04/2024The FASP for BankNifty is listed for 05-04-2024. You can add this levels to your trade setup for better results. This should not be the only indicator but an additional tool to increase your winning possibilities.
What is Fibolysis Anchor SupRes Points(FASP)?
It is a unique level arrived by using Fibonacci Retracement , Fibonacci Extension , Standard Pivot levels under various Timeframes. It is an extensively analyzed level to draw the support and resistance levels for the next day. You can use
FASP levels for Nifty 05/04/2024The FASP for Nifty is listed for 05-04-2024. You can add this levels to your trade setup for better results. This should not be the only indicator but an additional tool to increase your winning possibilities.
What is Fibolysis Anchor SupRes Points(FASP)?
It is a unique level arrived by using Fibonacci Retracement , Fibonacci Extension , Standard Pivot levels under various Timeframes. It is an extensively analyzed level to draw the support and resistance levels for the next day. You can use the
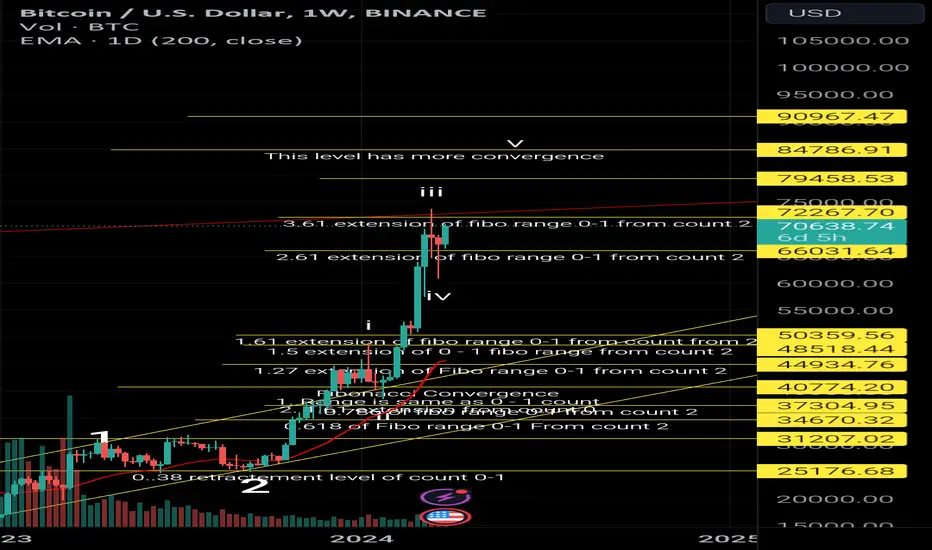
Fibo levels - BTC - 84800Considering the convergence level & wave count, have drawn few important support & resistance levels.
At current price structure, the prices could extend upto 84700 -84800 levels, this level has more convergence or going to be the area of confluence.
& price movement also stiff & it has expended more than 1.5X of 200 EMA.
T1: 79450
T2: 84800
T3: 90800
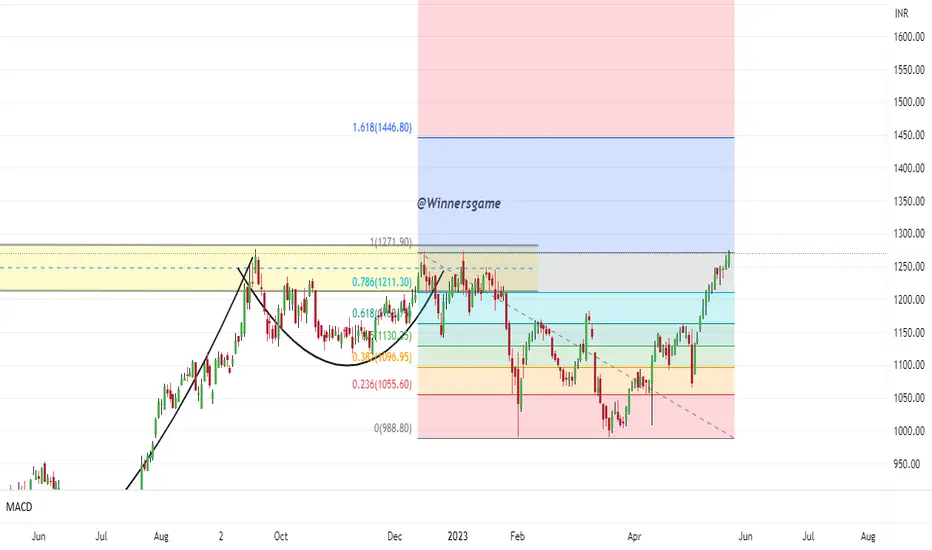
ABFRL Outlook...I've applied the Fibonacci retracement tool to ABFRL stock's recent uptrend to identify potential support and resistance levels.
Analysis:
Starting Point: Mentioned on the chart
Ending Point: Mentioned on the chart
Disclaimer: This is for educational purposes only. Conduct your own research and consider your risk tolerance before trading.
FASP levels for Nifty 06/03/2024The FASP for Nifty is listed for 06-03-2024. You can add this levels to your trade setup for better results. This should not be the only indicator but an additional tool to increase your winning possibilities.
What is Fibolysis Anchor SupRes Points(FASP)?
It is a unique level arrived by using Fibonacci Retracement , Fibonacci Extension , Standard Pivot levels under various Timeframes. It is an extensively analyzed level to draw the support and resistance levels for the next day. You can use the
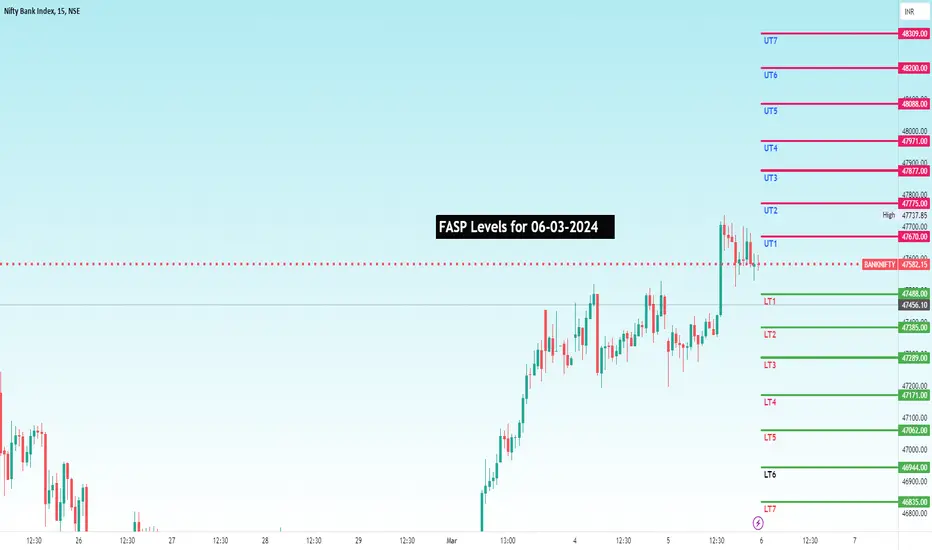
FASP levels for Bank Nifty 06/03/2024The FASP for BankNifty is listed for 06-03-2024. You can add this levels to your trade setup for better results. This should not be the only indicator but an additional tool to increase your winning possibilities.
What is Fibolysis Anchor SupRes Points(FASP)?
It is a unique level arrived by using Fibonacci Retracement , Fibonacci Extension , Standard Pivot levels under various Timeframes. It is an extensively analyzed level to draw the support and resistance levels for the next day. You can use
FASP levels for Bank Nifty 05/03/2024The FASP for BankNifty is listed for 05-03-2024. You can add this levels to your trade setup for better results. This should not be the only indicator but an additional tool to increase your winning possibilities.
What is Fibolysis Anchor SupRes Points(FASP)?
It is a unique level arrived by using Fibonacci Retracement , Fibonacci Extension , Standard Pivot levels under various Timeframes. It is an extensively analyzed level to draw the support and resistance levels for the next day. You can use
EPIGRAL - Swing Trade - 18th February #stocksEPIGRAL (1W TF) - Swing Trade Analysis given on 18th Feb, 2024
Pattern: SYMMETRICAL TRIANGLE
- Volume buildup at Resistance - Done ✓
- Resistance Breakout - In Progress
- Retest & Consolidation - In Progress
#stocks #swingtrade #chartanalysis #priceaction #traderyte #EPIGRAL #stockmarket #sharemarket #viral #sharemarketindia #StockMarketindia
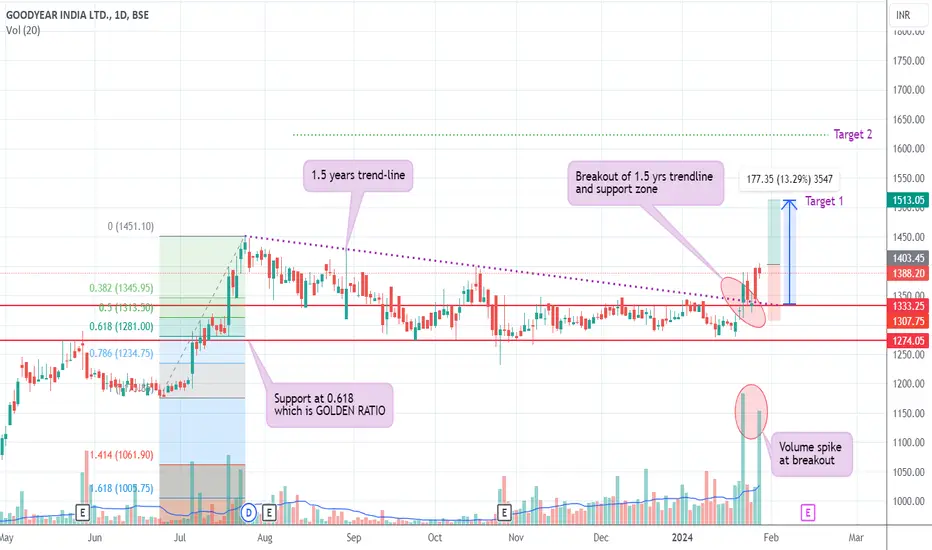
GOODYEAR | Daily Chart | Golden ratio pullbackChart analysis:
Pattern: Symmetric triangle pattern BO happened and re-testing of BO is happening.
Breakout: BO of 1.5 years trend line and support is taken at 0.618 which is Golden Ratio .
Volume: Volume action is clearly visible near breakout zone.
Trade setup:
Entry price: Close of 1400 price break candle.
Stop loss: Below 1320.
Target 1: 1512.5
Target 2: 1623.8
Disclaimer:- Please always do your own analysis or consult with your financial advisor before taking any kind o
EXIDEIND | Weekly Chart | 5.5years Multiyear BO | ATH BOChart analysis in Weekly time frame:
Pattern: Basing pattern is formed in 5.5 years.
Breakout: BO of ATH and Basing pattern and re-test of breakout is also performed.
Volume: Volume spike is there during BO and the volume is above Moving Average.
Trade setup:
Entry price: 345.7
Stop loss: Below previous ATH 304.7
Target 1: 369.3
Target 2: 407.55
Target 3: 469.4
Disclaimer:- Please always do your own analysis or consult with your financial advisor before taking any kind of t
NATIONALUM | Multiyear BO | 16-years BO | Monthly ChartChart analysis:
Pattern: Basing pattern is formed. Consolidation might happen near breakout zone after a big rally.
Breakout: Basing pattern is broke the All Time High (ATH) price after 16 years.
Volume: Volume action is clearly visible near breakout zone.
Trade setup:
Entry price: Close of 148.40 price break candle.
Stop loss: Below Low of price breaking candle or previous candle.
Target 1: 226.35
Target 2: 257.5
Disclaimer:- Please always do your own analysis or consult wit
GANDHITUBE | Weekly Chart | Rectangle Chart pattern | ATHChart analysis:
Pattern: Rectangle pattern is formed when the consolidation takes place.
Breakout: Rectangle pattern is breakout happened on 24-Jan-2024. Price might comes to 770 for re-test of the BO.
Volume: Spike in volume in BO candle indicating big players are interested.
Trade setup:
Entry price: Between 769.45 and 802.85
Stop loss: Below rectangle pattern i.e., 654.95
Target 1: 957.80
Target 2: 1260.65
Disclaimer:- Please always do your own analysis or consult with yo
GAIL | Monthly Chart | 6 years ATH BO | Basing patternChart analysis:
Pattern: Basing pattern is formed and breakout happened in Dec 2023.
Breakout: Basing pattern is broke the All Time High (ATH) price after 6 years.
Volume: Volume spike is there during BO and the volume is above Moving Average.
Target of BO: 223.2
Disclaimer:- Please always do your own analysis or consult with your financial advisor before taking any kind of trades
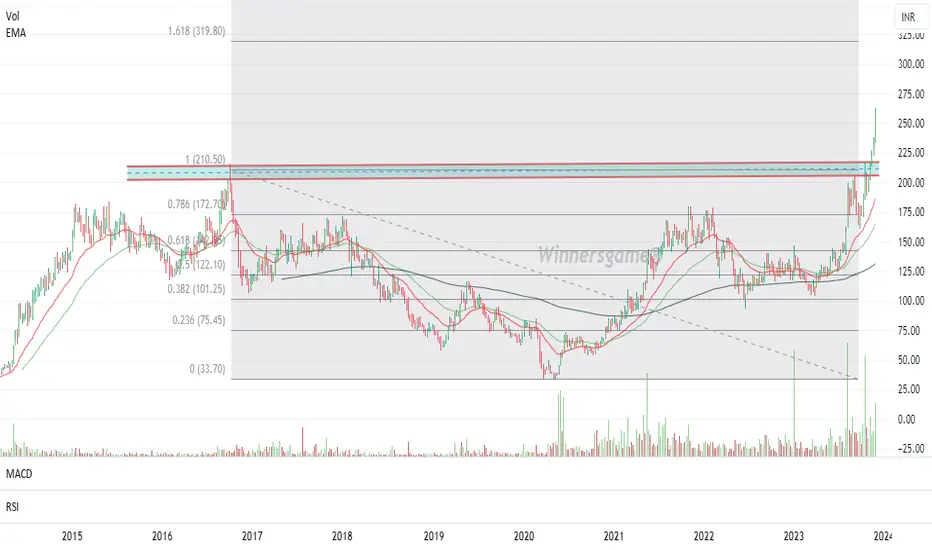
Biocon might surprise Warning! Stop loss is deep 15-20%
Biocon reported 3x profit in Sept23 quarter. As per charts its could have ended long drop from all time high.
Elliott wave count added on charts.
DISCLAIMER:
There is no guarantee of profits or no exceptions from losses.
The stock and its levels discussed are solely the personal views of my research.
You are advised to rely on your judgement while investing/Trading decisions.
Seek help of your financial advisor before investing/tradin
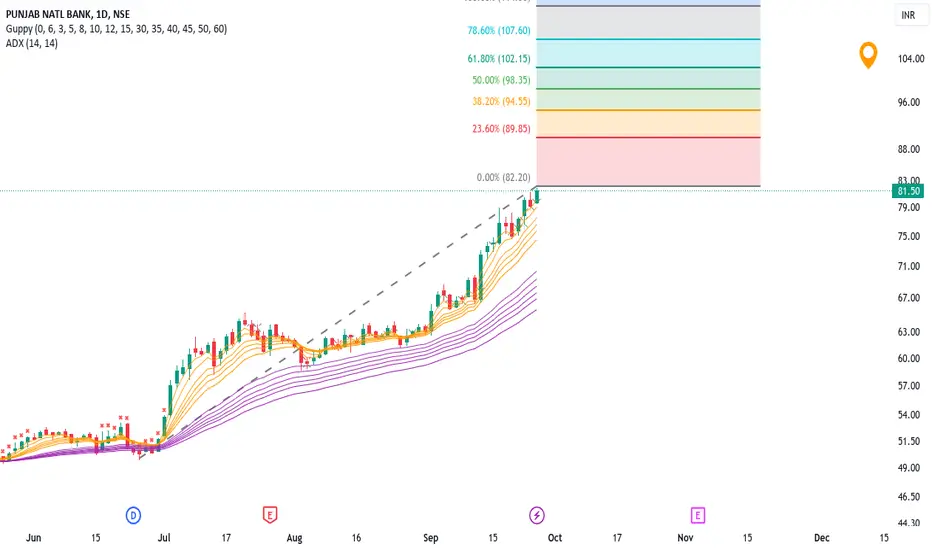
PNB next Potential Target according to Fibonaaci Chart Type : Candlestick
Time frame : Daily
Tool Used: Fibonacci Extension
Please note that this analysis is based on the geometry of the chart, it is not a data based analysis.
From March 2023 the price has moved 85%. But for analysis we consider a strong swing of 65% which is from July2023 to today's candle and the Fibonacci extension is not drawn on the log scale.
According to this setup the next potential target is at 89.85 which is a 23.60% level of Fib extension.
Thanks
Er. Simranji