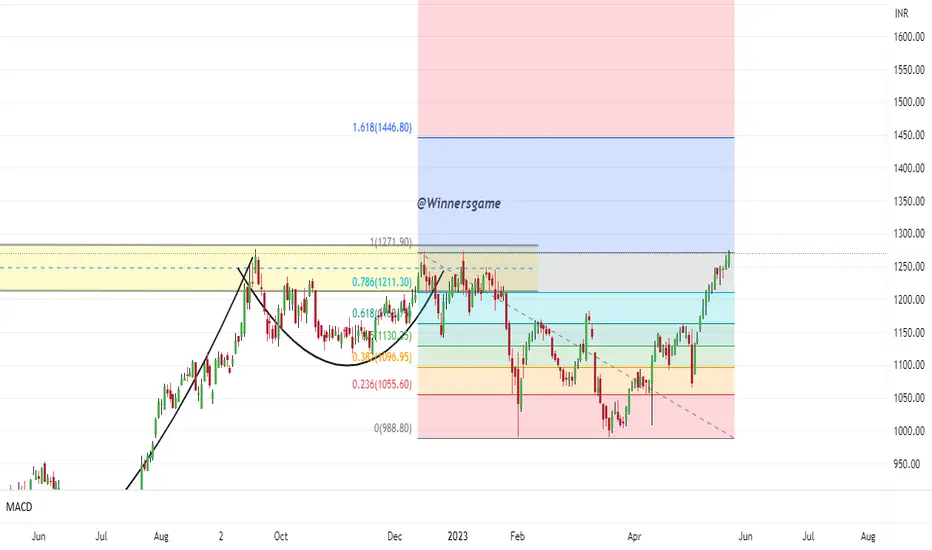
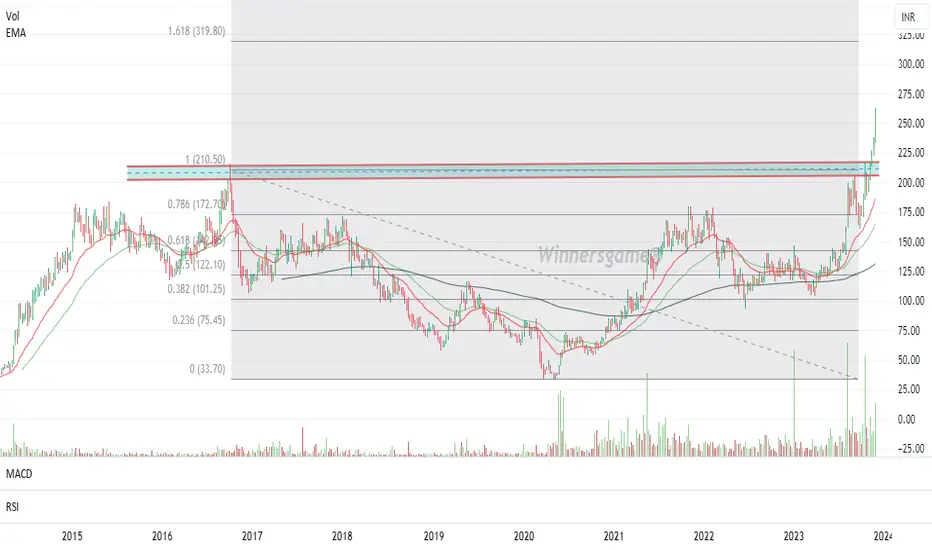
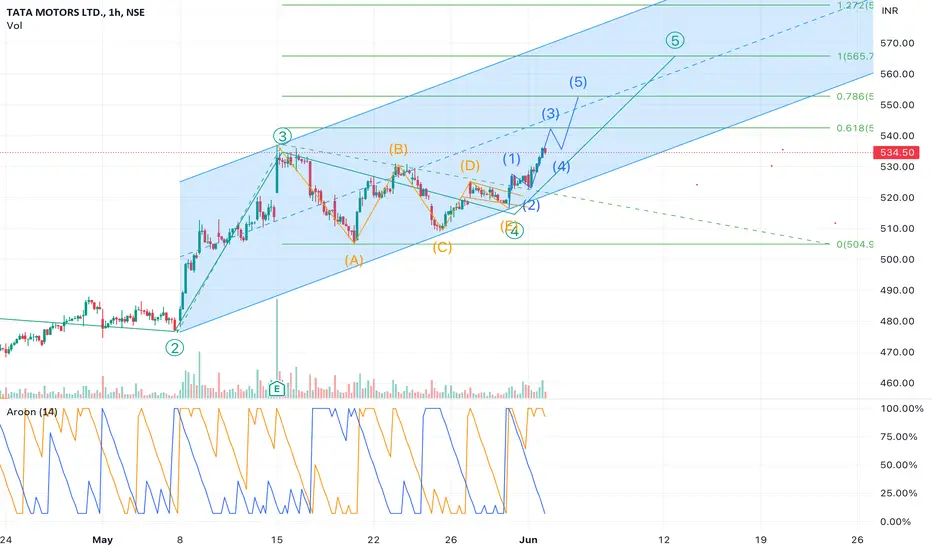
Fibonacci Extension
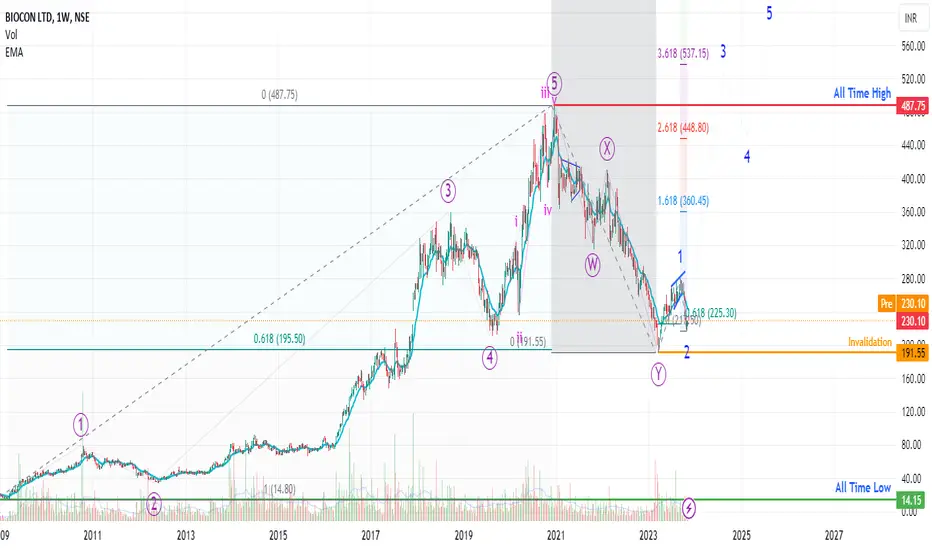
Biocon might surprise Warning! Stop loss is deep 15-20%
Biocon reported 3x profit in Sept23 quarter. As per charts its could have ended long drop from all time high.
Elliott wave count added on charts.
DISCLAIMER:
There is no guarantee of profits or no exceptions from losses.
The stock and its levels discussed are solely the personal views of my research.
You are advised to rely on your judgement while investing/Trading decisions.
Seek help of your financial advisor before investing/tradin
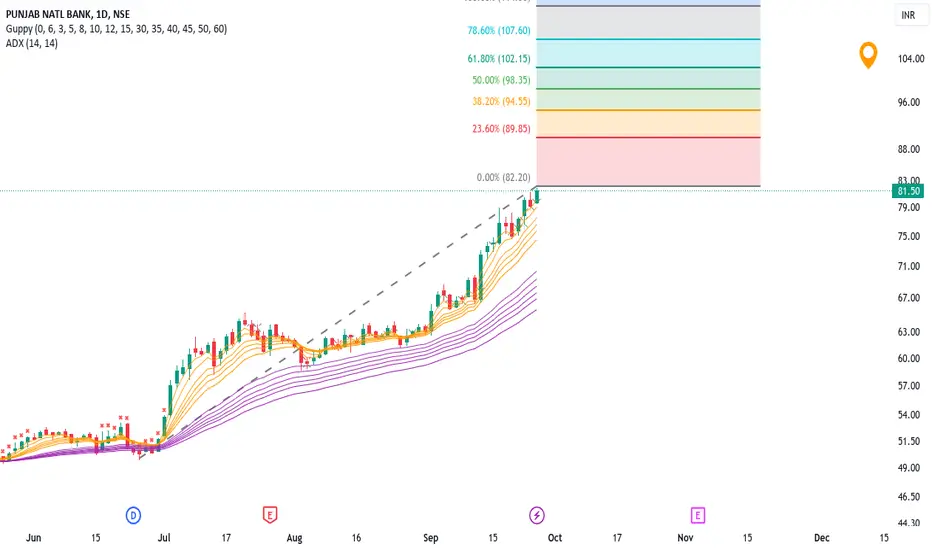
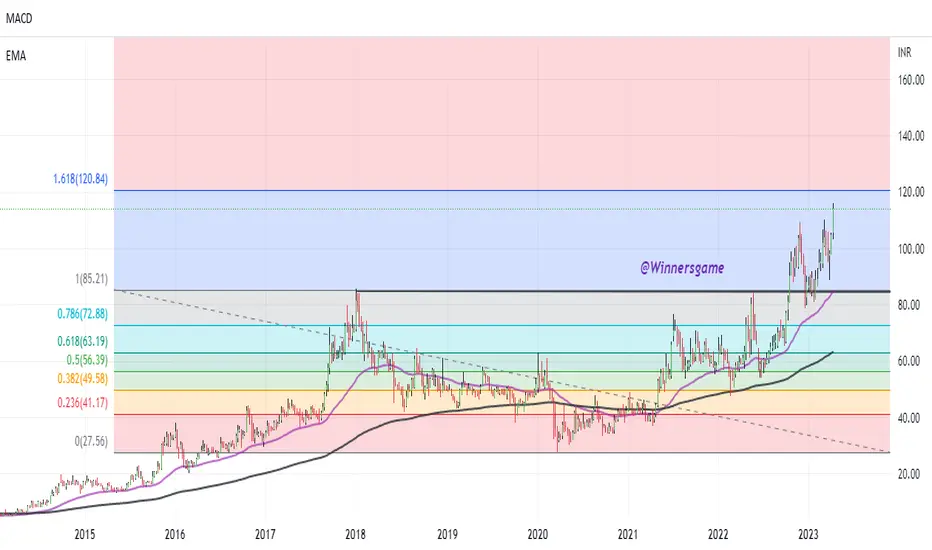
PNB next Potential Target according to Fibonaaci Chart Type : Candlestick
Time frame : Daily
Tool Used: Fibonacci Extension
Please note that this analysis is based on the geometry of the chart, it is not a data based analysis.
From March 2023 the price has moved 85%. But for analysis we consider a strong swing of 65% which is from July2023 to today's candle and the Fibonacci extension is not drawn on the log scale.
According to this setup the next potential target is at 89.85 which is a 23.60% level of Fib extension.
Thanks
Er. Simranji
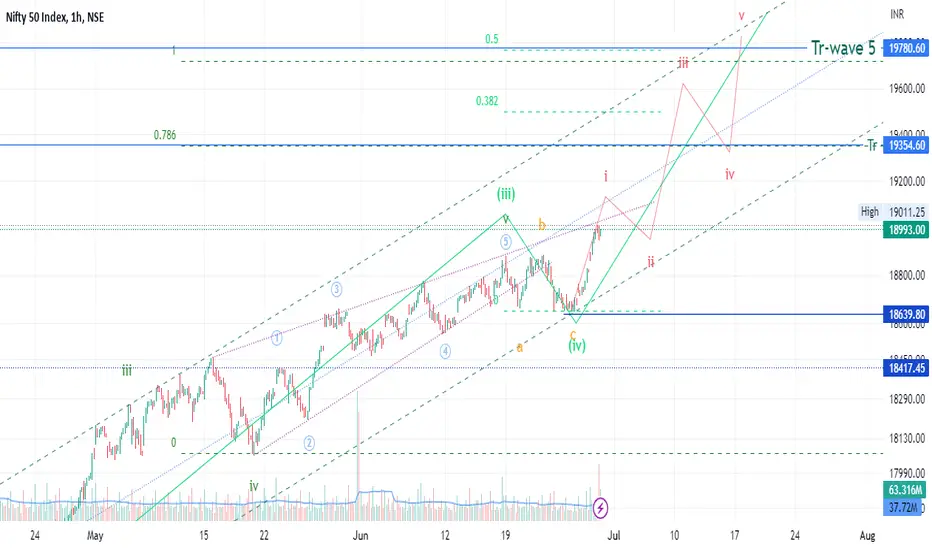
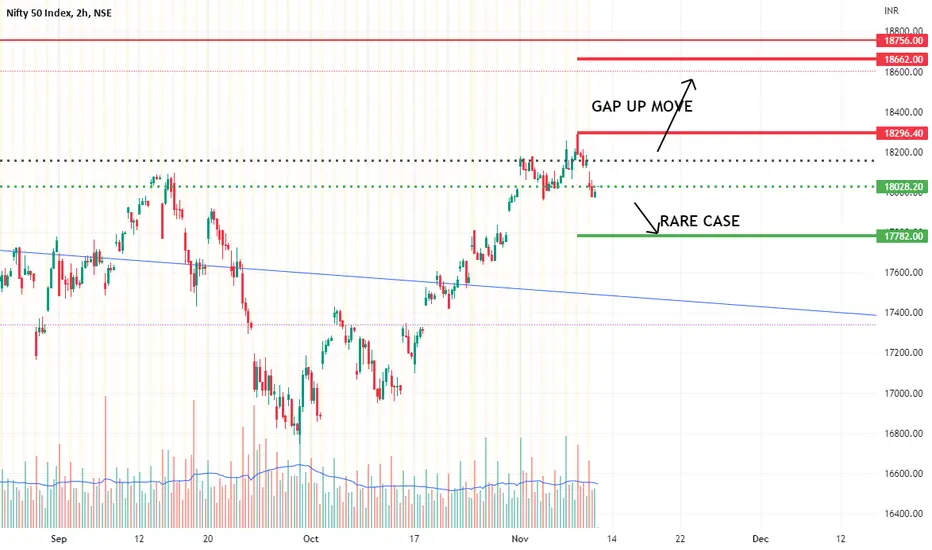
Nifty - near ATH, what's next?NSE:NIFTY reached near its All Time High 19000, peoples are talking about big fall but here the view seems different to me, As per my Elliott wave study and my counting on it which can differ with every EWT user above is my shared view, please look carefully & have a happy trading
here are some points to take in consideration.
1] Price is still in channel. also there is reverse breakout from wedge.
2] Wave 4 correction was not clear until the breakout happened.
3] VIX is near 11. So, volatilit
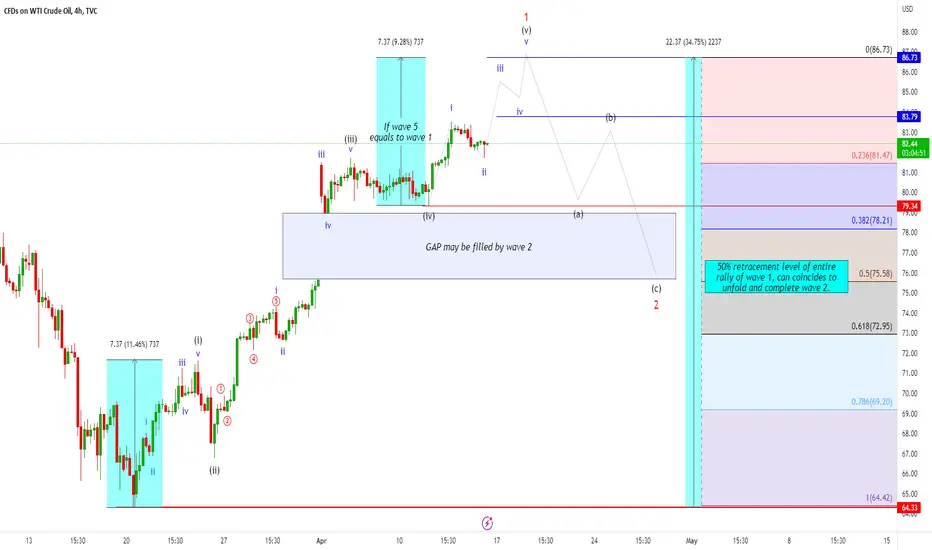
Elliott wave counts of USOIL and Fibonacci levels (up, down, up)Hello Friends, here we had shared possible Elliott wave counts of USOIL CRUDEOIL chart on hourly time frame, which is suggesting we are currently in impulse wave of some degree, in which we had completed (i)-(ii)-(iii)-(iv) and now possibly we are unfolding wave (v) of bigger degree wave 1, in this scenario we had seen that wave (iii) has been extended and clearly showing subdivisions inside it and also shown gap up as its nature, so we can assume that wave (v) can go up to equality of wave (i)
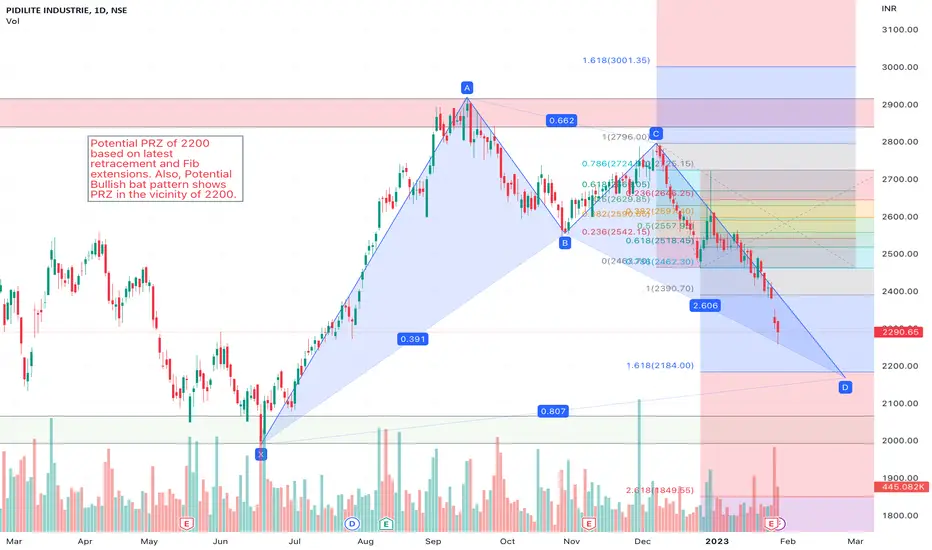
Trade Idea on SRF with Bird Eye View and Notes Following is the bird-eye view of SRF point-wise:
1 and 2) I see two patterns here on a Weekly time frame; 1 is a parallel channel, and 2 is a symmetrical triangle
( Note: Both can be bullish or bearish patterns depending on their previous more significant wave, here it was bullish )
( Note 2: Currently sitting at the support of bottom parallel channel making a W pattern and sitting at bottom support of symmetrical pattern too )
3) It's a Fibonacci extension, made for the consolidation zone
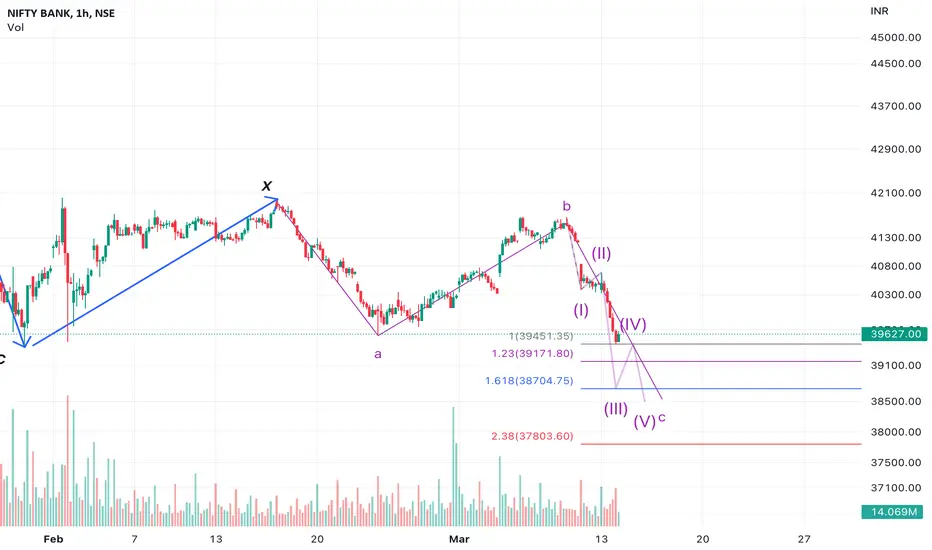
BNF - 1 HR TF - Elliott waveHere is the Elliott wave analysis of BNF on 1 Hr TF, the following are the inferences.
1. Major correction in C wave going on on higher degree.
2. Internally, subordinate waves form the XABC pattern.
3. Potential Projection/Targets of C wave marked as fib retracements.
Views are personal, only for educational purposes!
Please don't treat this as trading advice.
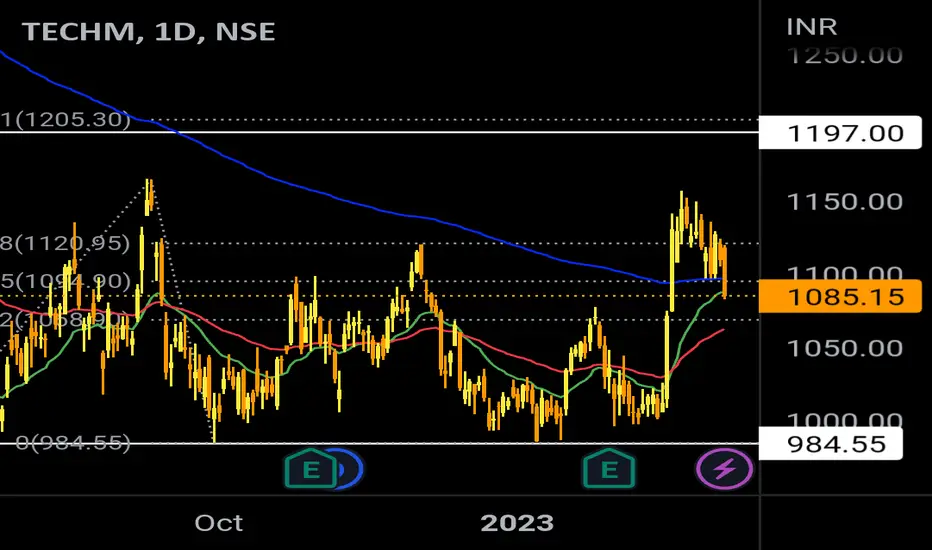
Predictive analysis of TECHM in dcb.TECHM now Trading above 21 & 55 emas, successfully crossed 200 ema and retested now in dcb chart. As per drawn Fibonacci Extension, short term Target would be 1195-1205 and mid term target would be 1340-1370. Those mentioned zones are vital resistance zones also.
Disclaimer - this chart analysis is only for educational purpose. Do proper study before taking trade/invest or consult with your financial advisor.
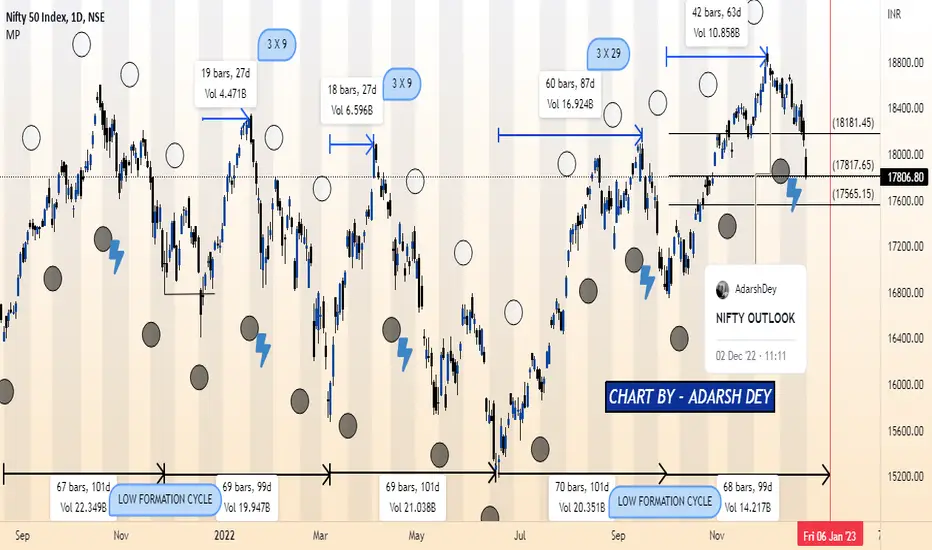
NIFTY (TIME & LUNAR CYCLE)The very word “lunacy” dates back to the 15th century when it was believed the moon and its phases could make people become more or less aggressive, depending on its place in the lunar cycle
Several studies found a connection between full and new Moons and stock market performance. Generally, stocks tend to perform better in the days around the New Moon, while price weakness is more frequently seen in the days around Full Moon. It was also observed that major market crashes have a history of h
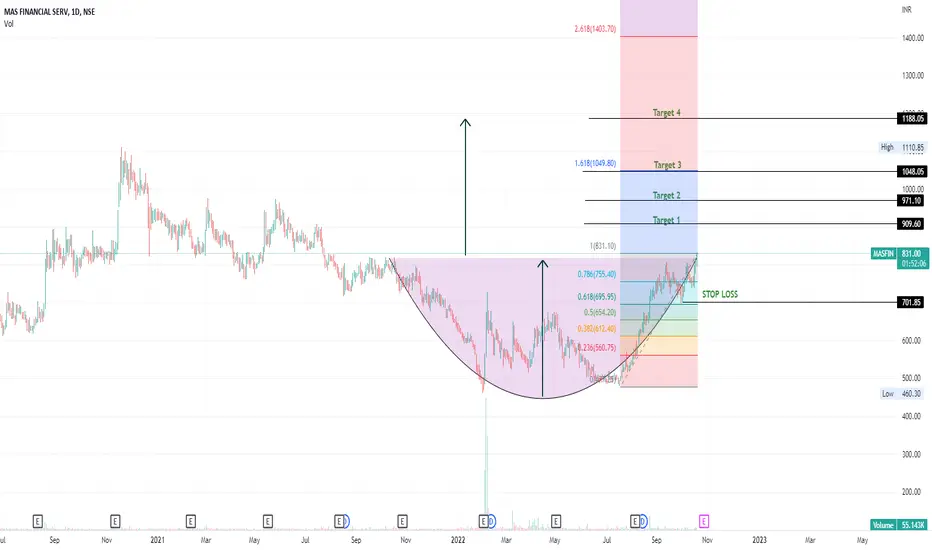
Uptrend Continues in MAS
Good Day,
Hello Traders,
See how beautifully it is following Fibonacci Levels as the rounding bottom is completed
Now the next targets lined up are 909/ 971 / 1048 / 1188
Time Frame: Daily
Hold for 8 to 12 months.
It also depends how market behaves, however the trend and the sentiment is
bullish .
Chart Self Explantory.
Disclaimer : I am not SEBI registered analyst, this is for educational purposes.
Please trade as per your risk and do consult with your financial advisor before taking an
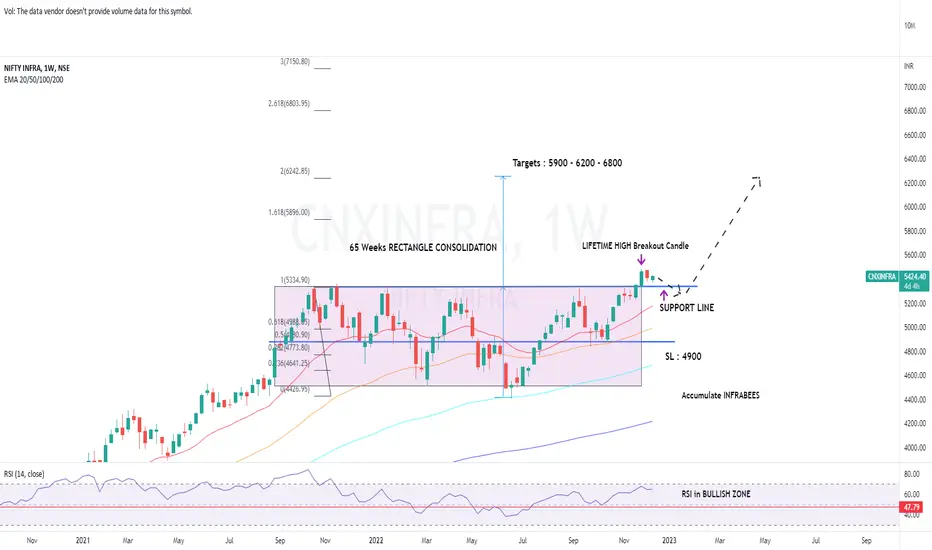
NIFTYINFRA | LIFE HIGH BO after 65Week Consolidation |30% UpsideNSE:CNXINFRA
BOX Consolidation of 65 Weeks and LIFETIME HIGH BO with Volume
CMP trading above all major Weekly Exponential Moving Avgs
RSI in Bullish Zone
Tgt: 5900 - 6200 - 6800
SL : 4900
Upside Potential : 30%
Time Frame : 3 - 12 Months
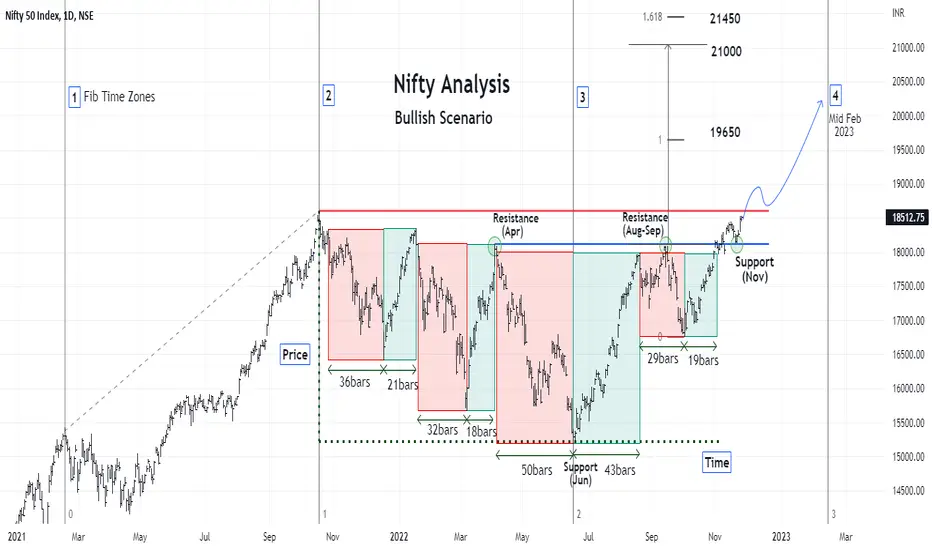
Nifty Analysis: A Bullish Scenario 🚀Hi 👋
There are always two potentially predominant scenarios possible in the stock market – Bullish and Bearish. Most people involved in the stock market like to read and appreciate the positive side of the market, that is bullish. This is because they always ‘Buy’ and never sell. Neither they sell to ‘Short’ the market nor to take profit 😉
This idea is representing the bullish scenario of the market. I have used minimal tools – Support and Resistance; Fib Time Zones; Fib Extensions and a self-