Fibonacci Extension
ICICI Bank| Rounding & Triple Bottom | Life High |27% UpsideNSE:ICICIBANK
CMP 925 is at Lifetime High
Rounding Bottom, Triple Bottom Breakout.
Price Bouncing above Short Term EMAs which are acting as support in the uptrend
RSI in Bullish Zone in all time frames
Targets : 1020 - 1137 - 1209
Upside : 27%
SL : 810
Time Frame : 3 - 6 Months
HBL Power : Perfect Example of Fibonacci Levels
Good Day ,
Hello Traders,
HBL Power is one of the best dark horse, Consolidates then moves.
Fibonacci Levels are been respected perfectly as you can see the levels of 122 achieved and now it retraced a bit . Gearing up for the next level of 152.
Good candidate for Long term perspective.
Chart Self explanatory
Time Frame : Daily
Disclaimer : I am not SEBI registered analyst, this is for educational purposes.
Please trade as per your risk and do consult with your financial advisor before ta
Banknifty Possible move on 26/9/2022After forming double top on 20th Sep, Bank Nifty on hourly time frame is likely to continue its downward trend till its support region of 38500.
There is also likelihood of it retracing it 40000 levels and then continue it journey downwards.
Rest I think chart is pretty self explanatory.
GOLD Flat correction about to Complete! New High Awaits?Gold Wave 3 ended after Covid Rally at 2075$ then went in consolidation for long time.
Wave 4 is in progress which is looking like Flat ABC correction which 3-3-5 waves pattern
Wave B retraces 90% of A and then Wave C breaks low of A.
Wave C is 5 wave impulse or diagonal structure
Wave C in this case could be Ending Diagonal Pattern which is expected end between 1675-50$
After low near these levels one can wait for break of 1808$ to consider move beyond 2075$
If wave C goes beyond 1600$ mark t
NIfty July month expectation and analysis i am expecting a test down of 15178, 14887.90, 14680 levels before 18th july
current market price as of 5th july is 15810
18july to 5-8 august might be a consolidation and momentum divergence period only if above 15178-14887-14680 level are sustained
will buy on based on momentum divergence of macd or rsi (best will the double bottom bullish divergence)
NOTE;
this levels are drawn based on previous data considering 4th april 22' high
this analysis is only based on technical factors no fun
What is Fibonacci extension?Hey everyone! 👋
Last time we explained some of the basics to know when it comes to understanding the Fibonacci retracement tool. If you haven’t read that post, be sure to check it out here:
In this post, we are going to look at the Fibonacci extension along with a few exhibits that may help you solidify your understanding of this unique trading tool.
Please remember this is an educational post to help everyone better understand investing and trading tools. In no way are we trying to prom
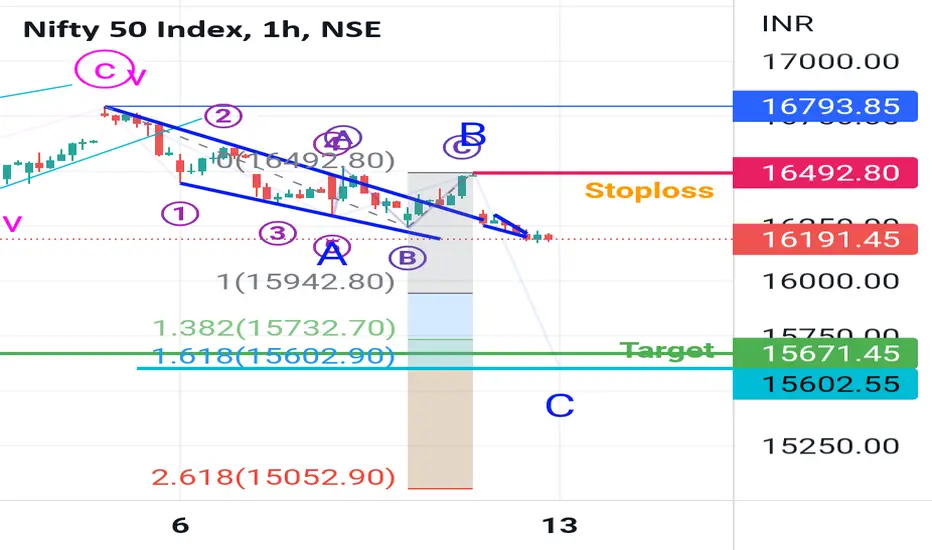
Nifty Crack In progress in wave CNifty post forming Leading diagonal now has staryed wave C which is expected to reach below previous low 15671.
DISCLAIMER:There is no guarantee of profits nor exceptions from losses.
Technical analysis provided on the chart is solely the personal views of my research.
You are advised to rely on your own judgments while taking any investing/Trading decisions.
Past performance is not an indicator of future returns. Investment/trading is subject to market risks.
Seek help of your financial adviso
Nifty In Consolidation 4th wave of C Before Next DropIf you Like Analysis then consider donating Tradingview Coins with Cheers!! :)
First Look at larger picture on daily chart that we are in Triple three complex correction
We are expecting wave iv or 4th wave of C to be Triangle but its advance assumption.
Until wave D of triangle completes and bounces it can't be confirmed but consolidation still doesn't looks to be over so it carries good probability.
So we are expecting it to spend so more time between 16400 and 15775 range completing D,E
ITC be Ready for Wave C of zig zagWave B looks to be completed and drop looks to be in progress.
All other details on chart
DISCLAIMER:There is no guarantee of profits nor exceptions from losses.
Technical analysis provided on the chart is solely the personal views of my research.
You are advised to rely on your own judgments while taking any investing/Trading decisions.
Past performance is not an indicator of future returns. Investment/trading is subject to market risks.
Seek help of your financial advisors before investing/t
Banknifty to crack hard in Z waveBanknifty Elliott wave count as shown in charts from wave 1 to 5.
Currently we are in complex wxyxz correction. The final Z wave should be in progress which should break previous low.
The new low is expected to be between 31400 to 30000
The drop from X wave can be looked as Zig zag correction on downside with current wave B in progress and will start C wave once breaks 35511 low as shown in below image
Charts will be invalid if breaks 38766
DISCLAIMER:
There is no gu
POWERGRID - Breakout after reversal - Swing TradeThe analysis is done on daily TF hence price may take few days to few weeks in order to reach the targets.
Trade setup is explained in image itself.
The above analysis is purely for educational purpose. Traders must do their own study & follow risk management before entering into any trade
Checkout my other ideas to understand how one can earn from stock markets with simple trade setups. Feel Free to comment below this or connect with me for any query or suggestion regarding this stock or Pric
Nifty z of Z wave starting. Details as per added on chart waiting for day high 17724 to be taken out.
DISCLAIMER:There is no guarantee of profits nor exceptions from losses.
Technical analysis provided on the chart is solely the personal views of my research.
You are advised to rely on your own judgments while taking any investing/Trading decisions.
Past performance is not an indicator of future returns. Investment/trading is subject to market risks.
Seek help of your financial advisors before investing/trading.
Not recom
IDBI Bank Leading Diagonal Wave 5 Going for 70IDBI making leading diagonal pattern after recovery from 40 odd lows.
Expecting it to move towards 70 in wave V of leading diagonal.
Stop loss as mentioned on the chart.
DISCLAIMER:There is no guarantee of profits nor exceptions from losses.
Technical analysis provided on the chart is solely the personal views of my research.
You are advised to rely on your own judgments while taking any investing/Trading decisions.
Past performance is not an indicator of future returns. Investment/trading is
Voltas to Attempt BreakoutVoltas previously moved out of flag structure and gave retracement.
Now again made 3 white soldiers candlestick Pattern on daily chart.
Upside expected towards 1440-1528 with SL 1243
DISCLAIMER:There is no guarantee of profits nor exceptions from losses.
Technical analysis provided on the chart is solely the personal views of my research.
You are advised to rely on your own judgments while taking any investing/Trading decisions.
Past performance is not an indicator of future returns. Investme
Nifty at The END of the new Beginning Nifty running up from 15671 like there is no resistance upside.
But when you take a closer look the the price is not straight up but its curving downside.
momentum loss is shown by MACD with negative divergence.
Hence the title THE END OF THE NEW BEGINNING
Price is going up as wxyz correction to previous drop and expecting end between 17890-18200 levels
The current swing confirmation break is placed at 17421.
Until now there is no signal of drop yet we should see it shaping up next week
Timken Triangle Breakout ready to move out of channelTimken is moving in channel since Covid drop volumes looks returning
On weekly chart MACD about to give positive crossover.
Currently Broken out of Triangle and is in consolidation. It looks to be in 5 of 3 wave which should be sharp up.
Can go long near 2150-2050 range with SL 1905 for targets given in the charts which are 0.618 and 1 fibonacci extensions.
DISCLAIMER:There is no guarantee of profits nor exceptions from losses.
Technical analysis provided on the chart is solely the personal
GAIL is going to sail wave 5Gail looks to have come out of wave 4 and now making leading diagonal for starting wave 5.
Leading Diagonal chart as below
Upside potential of almost 60% expected targets near 230. One can look for lower target as well of 0.618 extension near 190.
Details of entry exits and targets as per charts.
DISCLAIMER:There is no guarantee of profits nor exceptions from losses.
Technical analysis provided on the chart is solely the personal views of my research.
You are advised to rely on your own j
Nifty Z wave Up towards 17800 due in next few days before crashNifty is in complex correction going upwards from 15671 low which is called as wxyz correction.
From low of 17006 nifty started final wave Z of which A and B looks completed today near 17199.
Tomorrow it should start fresh up move after breaking 17308 immediate move is expected towards 17500.
Z wave should end near 17800.
Conditional entry above 17308 with stop loss 17199.
DISCLAIMER:There is no guarantee of profits nor exceptions from losses.
Technical analysis provided on the chart