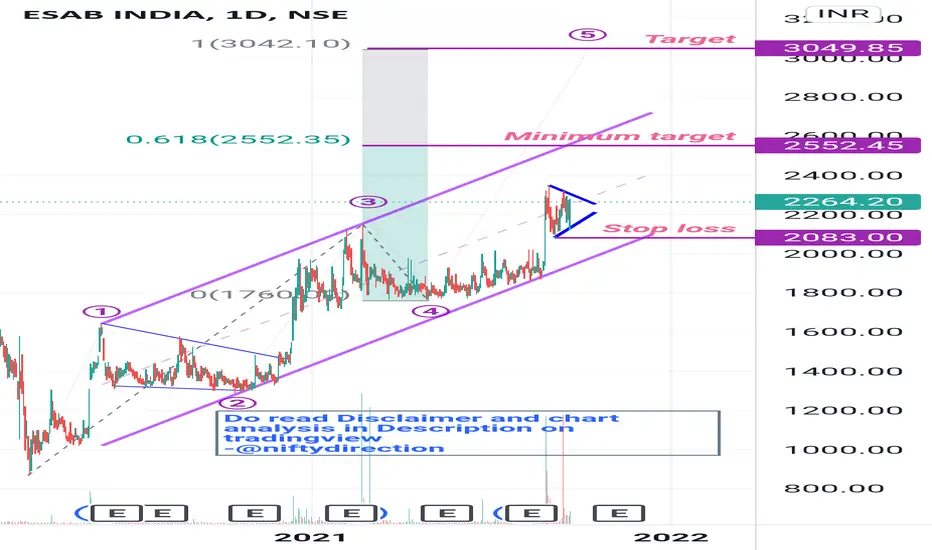
ESAB INDIA Channel Breakout AttemptESAB INDIA is forming flag volume has picked up in recent days. The Company stands 3rd position in terms of market cap in Electrode Manufacturing Industries.
Entry near 2200 with SL 2083 for target 2550 and extended 5th wave target of 3040 aas wave 3 wasn't able to break channel.
DISCLAIMER:There is no guarantee of profits or no exceptions from losses. The study provided is solely the personal views of my research. You are advised to rely on your judgment while investing/Trading decisions. Pa
Fibonacci Extension
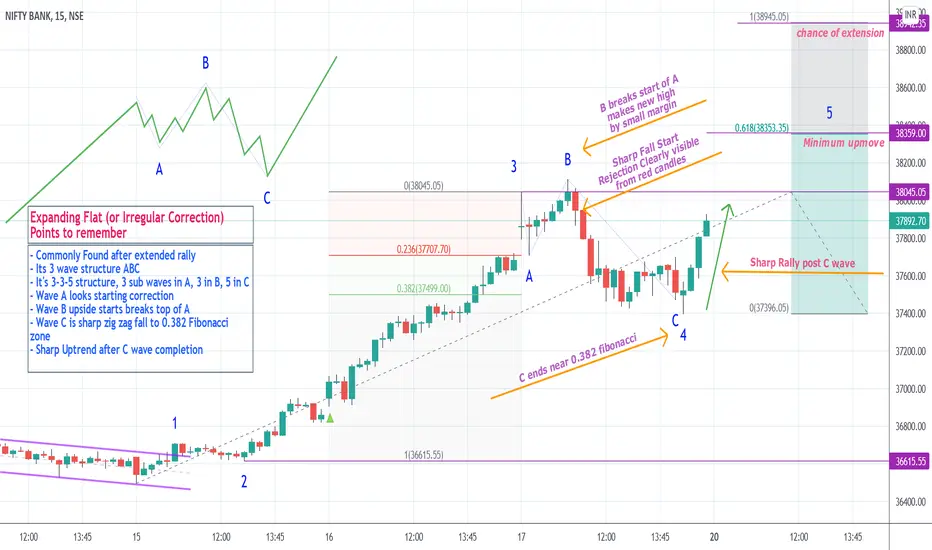
Expanded Flat or Irregular Correction IdentificationMost common found pattern. Its temporary pause to extended rally.
Key to identify this pattern is rejection after breaking wave A start.
Always look for very smaller margin rise above start of wave A.
C wave is sharp fall to reach 0.382 Fibonacci retracement of rally.
All other details explained in chart. Comment your doubts.
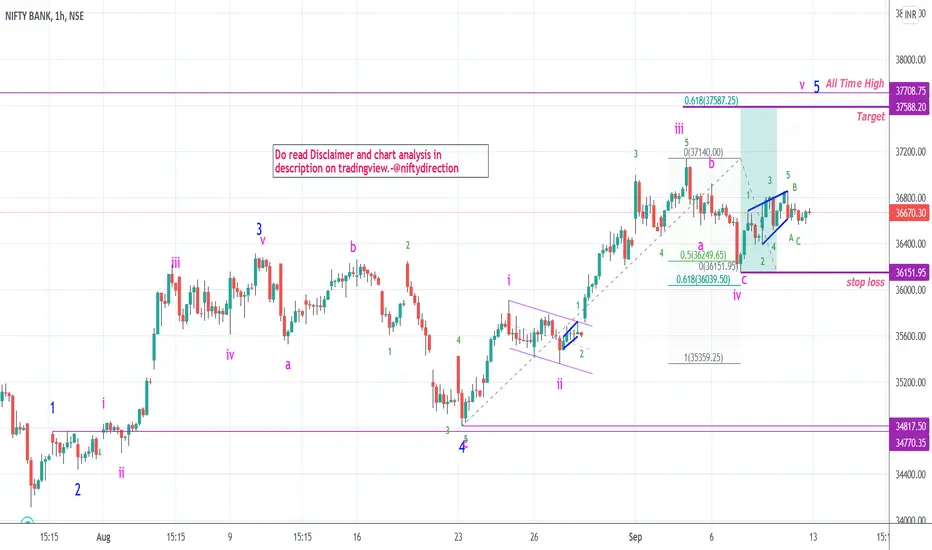
Banknifty to attempt All Time high in wave v of 5If you ask why Wave 4 (in blue) is deep almost touching Wave 1 then that's based on Elliott wave Alteration Guideline.
Wave 2 was flat so wave 4 will be zig zag and went deep.
Rest all stuff explained on chart.
DISCLAIMER:There is no guarantee of profits nor exceptions from losses.
Technical analysis provided on the chart is solely the personal views of my research.
You are advised to rely on your own judgments while taking any investing/Trading decisions.
Past performance is not an indicator
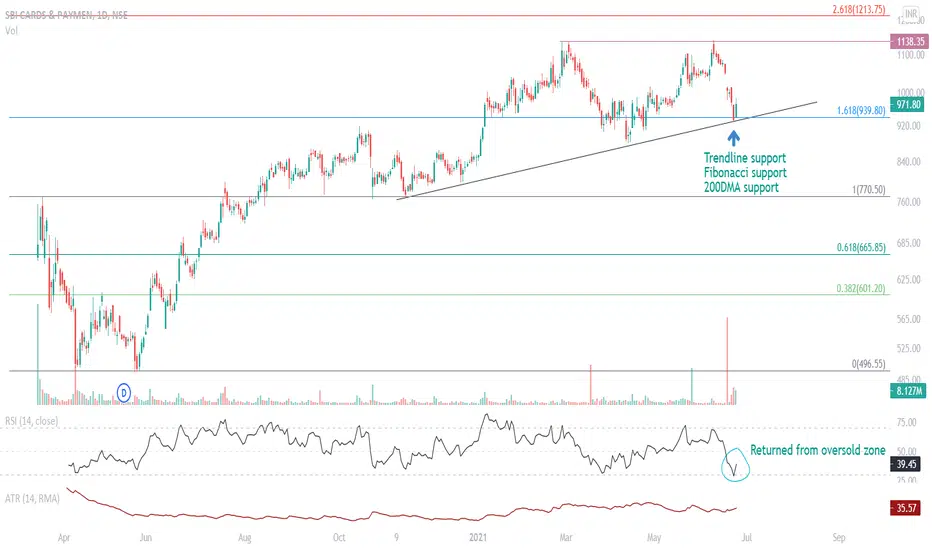
SBICARD at Confluence of Multiple SupportsSBICARD is exhibiting reversal at multiple supports:
1. Trendline support from previous lows
2. 1.618 Fibonacci support
3. 200DMA support
Further, RSI also touched 30 level and reversed.
We are bullish on this stock, expecting the price to reverse to ATH of 1139.
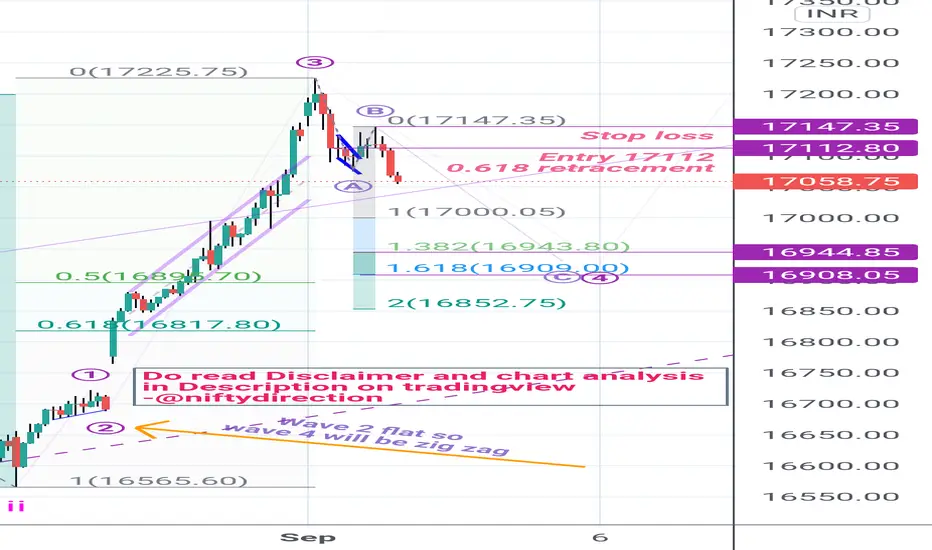
Nifty wave 4 zig zag correction wave C startedNifty today started 4th wave correction.
Elliott wave Alteration theory says when wave 2 is simple flat/complex correction then expect wave 4 to be zig zag.
Retracement entry near 17112 with SL as wave B top 17148 target will be 1.382 and 1.618 fibonacci extension of wave A.
DISCLAIMER:There is no guarantee of profits or no exceptions from losses. The study provided is solely the personal views of my research. You are advised to rely on your judgment while investing/Trading decisions. Past per
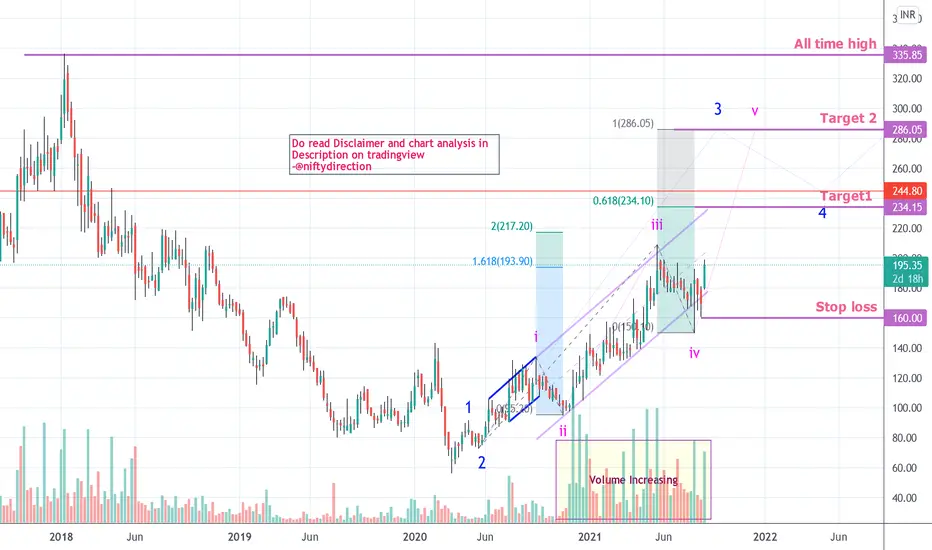
SHREE PUSHKAR CHEMICAL AND FERTILIZER to Extend in Wave VTHIS IS MICRO CAP STOCK don't allocate too much capital based on this analysis
Stock has subdued upward move with increasing volume .
Wave iii was channel bound and moved little more than 1.618 that means wave v will extend
Wave v non extended target is at 0.618 Fibonacci extension 230 and extended target 280.
Stop loss 160 and entry near 190 can be taken
DISCLAIMER:There is no guarantee of profits nor exceptions from losses.
Technical analysis provided on the chart is solely the personal vie
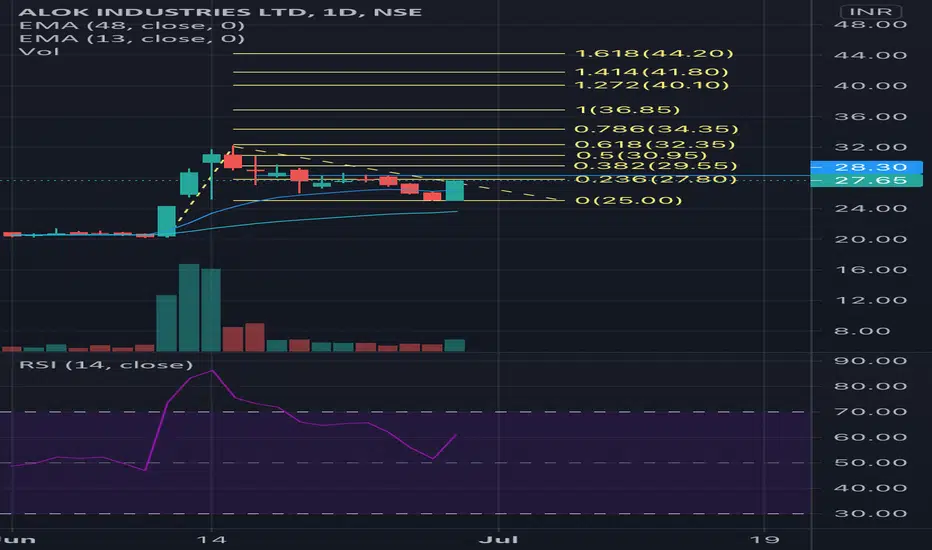
Tatamotors Flag and Wave 3 start Good Risk Reward ratioTatamotors Came Up from recent low with heavy volume.
Retracement happened near 0.382 fibonacci levels 281
Looking Good for start of Wave 3 towards 315 as 1.618 fibonacci extension
DISCLAIMER:There is no guarantee of profits or no exceptions from losses. The study provided is solely the personal views of my research. You are advised to rely on your judgment while investing/Trading decisions. Past performance is not an indicator of future returns. Investment is subject to market risks. Seek help
Nifty In flat correction Wave B about to complete. Wave B is complex correction which retraced more than 0.618 fibonacci level of wave A.
Wave B can strech upto 16695 which is 0.382 fibonacci.
Stop loss of this analysis will be 16703 just a point above all time high.
Downside C wave targets would be 16400 or 0.382 fibonacci level retracement 16250.
DISCLAIMER:There is no guarantee of profits or no exceptions from losses. The study provided is solely the personal views of my research. You are advised to rely on your judgment while investing/T
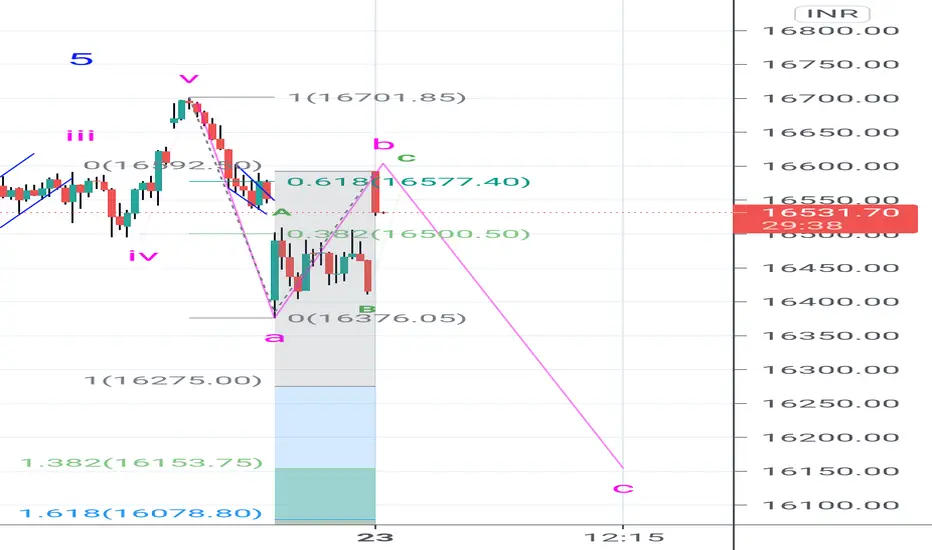
Nifty wave C about to startNifty wave A is 3 wave structure completed near 16376.
Wave B was zig zag correction moving more thann 0.618 fibonacci level of wave A.
Considering 16592 as top Wave C is expected to end in zones 16275 (100% of Wave A) to 16153 (138.2% of Wave A)
DISCLAIMER:There is no guarantee of profits or no exceptions from losses. The study provided is solely the personal views of my research. You are advised to rely on your judgment while investing/Trading decisions. Past performance is not an indicator o
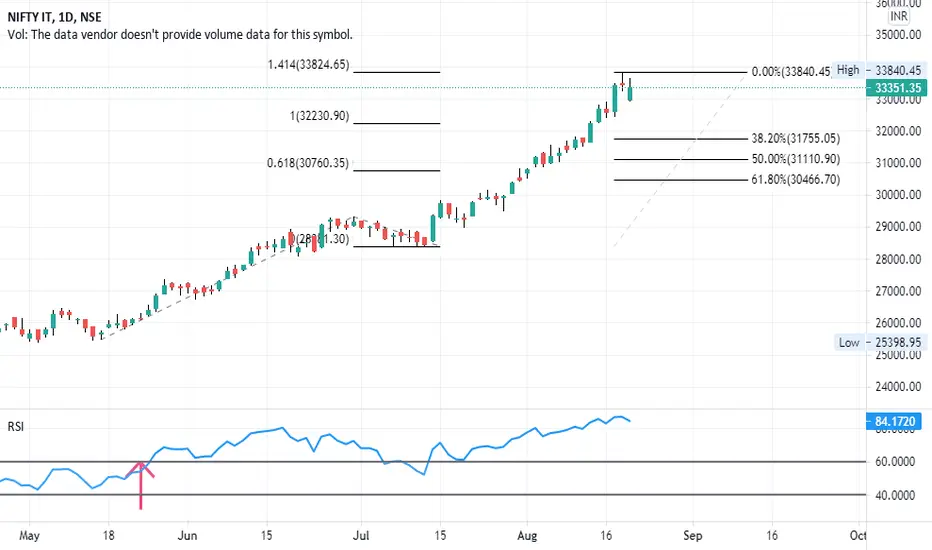
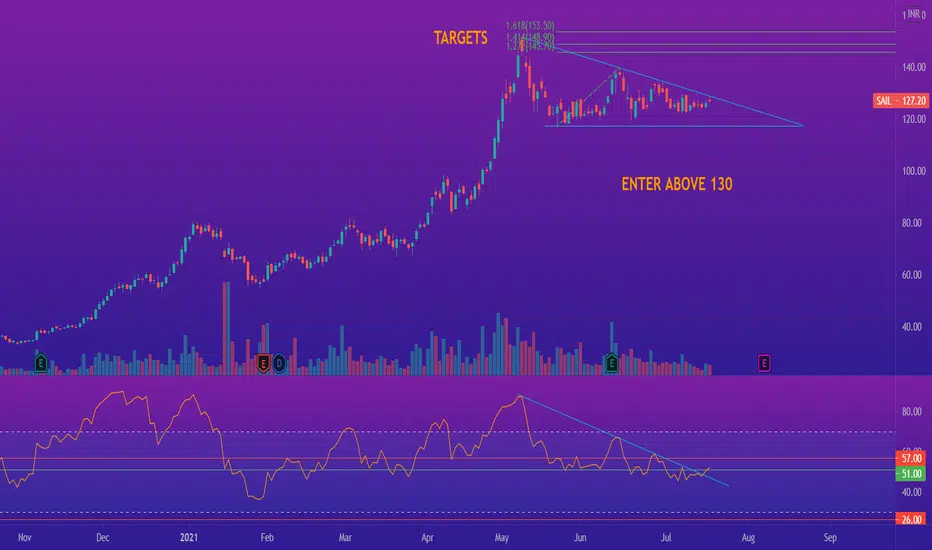
IT to loose some steam Sharing only for the purpose of learning.
IT sector may lose some steams after this wonderful rally.
Fibonacci Projection as shown reached the 1.414 levels in a single rally.
Few stocks showing some retracement signs on charts.
It can retrace or again start his journey again as few stocks still seem very strong on charts as below.
- TCS - Mindtree - OFSS - TECHM.
Stocks that can retrace can be as below.
- COFORGE - LTI - MPHASIS - WIPRO.
This is only for th
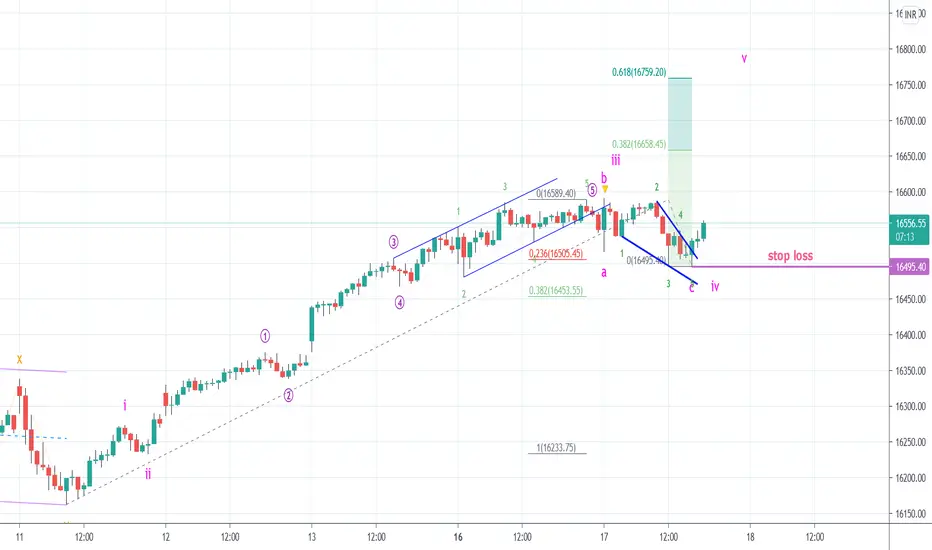
Nifty Upmove towards 16660-760 as wave 5Nifty retraced 0.236 Fibonacci with Irregular flat.
Wave C of irregular flat was ending diagonal which finished at 16495.40
Upside wave 5 target is expected to move 0.382 Fibonacci extension 16660 or 16760 which is 0.618 Fibonacci.
DISCLAIMER:There is no guarantee of profits nor exceptions from losses.
Technical analysis provided on the chart is solely the personal views of my research.
You are advised to rely on your own judgments while taking any investing/Trading decisions.
Past performance
Nifty upmove expected beyond 16700Nifty 15 min chart looks wave iii completed today for upmove started from 16162.
Wave iv is expected to end between 16505 which is 0.236 fibonacci retracement or 16453 0.382.
Consider 0.382 fibonacci retracement wave V target will be 16716 if reversal takes place from 16505 the target will be 16770.
DISCLAIMER:There is no guarantee of profits or no exceptions from losses. The study provided is solely the personal views of my research. You are advised to rely on your judgment while investing/
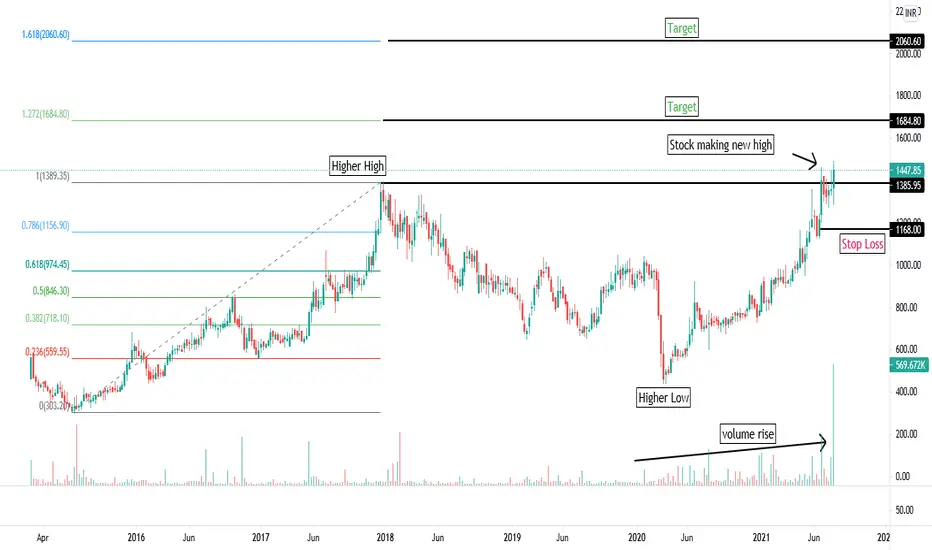
GreenLam. How to set Targets when stock are at all time high.Understanding the overall structure. :- Here it is simple higher high higher low structure. Stock currently above previous higher high.
How to Set Targets using Fibonacci extensions.
First Identify the swing. here it is 308 to 1389.
then place Fibonacci tool. After placing look at 38.2% 50% 61.8% levels if the stock has faced major resistance or support or consolidated for some time then the swing identification is correct.
Look for extension levels. You'll get your targets.
Looking at the
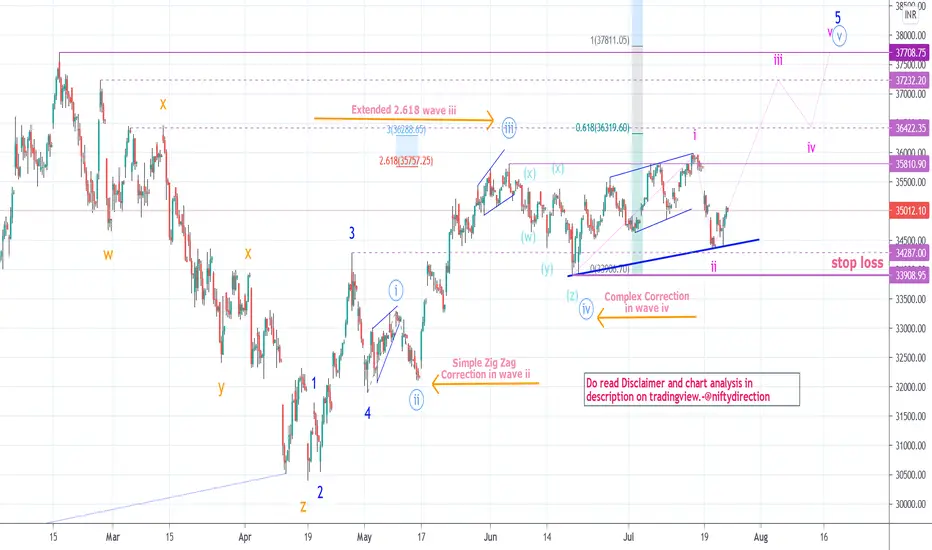
Banknifty Elliott Wave V towards all time high 37708Banknifty Elliott Wave count plotted best to my knowledge.
After Wave iv which is complex correction new leading diagonal wave has been seen.
New impulse should start taking it towards lifetime high.
DISCLAIMER:There is no guarantee of profits nor exceptions from losses.
Technical analysis provided on the chart is solely the personal views of my research.
You are advised to rely on your own judgments while taking any investing/Trading decisions.
Past performance is not an indicator of future
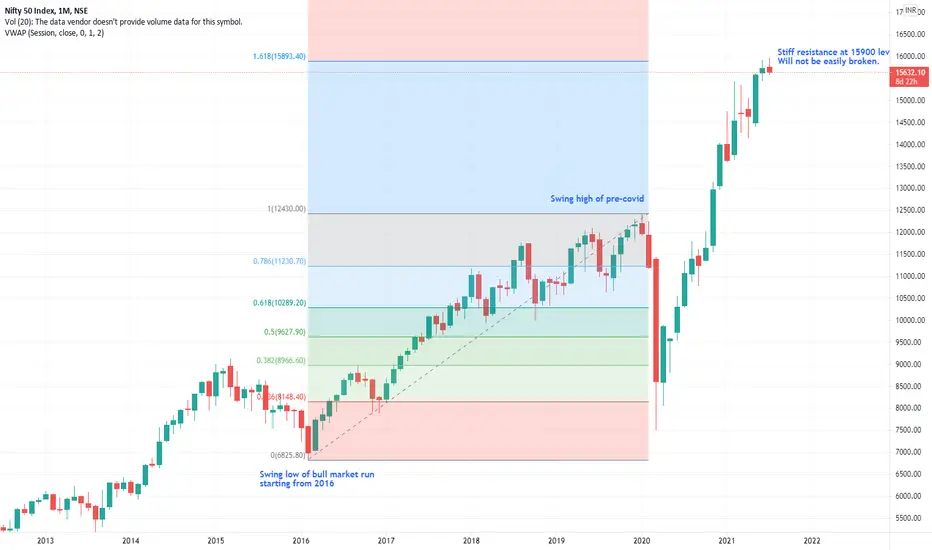
Nifty Fibonacci Level Analysis - Unlikely to break 15900?As we all know in a trending market there are swing highs and lows and Nifty had a brilliant run from 2016 low till pre-Covid fall. Fibonacci levels are crucial (although after the price action has happened) in predicting why trend is facing support/resistance at a particular price.
Taking the Fibonacci retracement from the trend from 2016 swing low (6825.8) to high pre Covid (12430) one can see a golden ratio resistance at around 15900 where Nifty has been struggling to break out of. The level
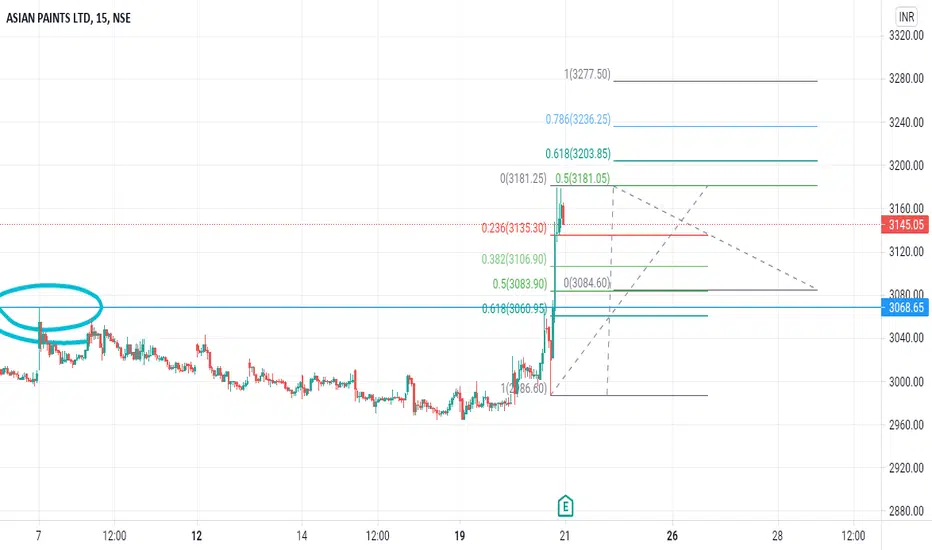
ASIANPAINT Trade Setup For Tomorrow ( 22nd July)So Asian Paint share give around 6% move on Tuesday, there is a two reasons behind it.
.
1. Asian Paint was in consolidation mode from last so many days so it gave a breakout on Tuesday with the level of 3068.
.
2. In the second half, Asain paint declare their good Quarter Results so it gives the more upward momentum to the share.
.
So for tomorrow, there is a simple Strategy, Asian Paint share will retraced till .5 level mean till 3106 or 3083
.
At the retraced level you should buy for the tar
Fibonacci Masterclass - Fibonacci Retracement and ExtensionHi guys, I have finally completed the thread on Fibonacci (Though it took longer than usual). I have tried with the best of my little knowledge to create this thread. This has everything you need to know about Fibonacci retracement and Fibonacci extension. Also, if the thread is free that doesn't mean I have compromised with the quality. All you have to do is just read this thread again and again until you get a good grasp of it. everything.
Table of Contents:
1. What Are Fibonacci Retraceme
Godrej Properties Positional Trade Setup For Tuesday (13th July)As you see in the Godrej Properties stock Fibonacci Retracement has happened in the previous day.
.
And same thing in last one week, after touching 1540, it retraced the level of .5.
.
Now tomorrow we can take the positional trade, once it cross the level of 1540.
.
Then 1560-1590 is out Targets.
.
What's your view on this comment below in the box.
Tata Motors Gearing Up for Impulse Wave 5 Tata Motors after Mar 2020 low 63 moved up by making wave 1 as leading diagonal
Next sub impulse wave (1) and (3) were normal waves without extension.
So (5) was explosive up raising 300% or wave (1)+(3) at 357.
After 357 high it retraced very small portion 0.232 Fibonacci level or 23% which is common in case of wave extended wave.
It appears to be making cup and handle pattern which could reach well towards 0.618 Fibonacci zones.
This rise from 280-360 is also observed to be leading diagon
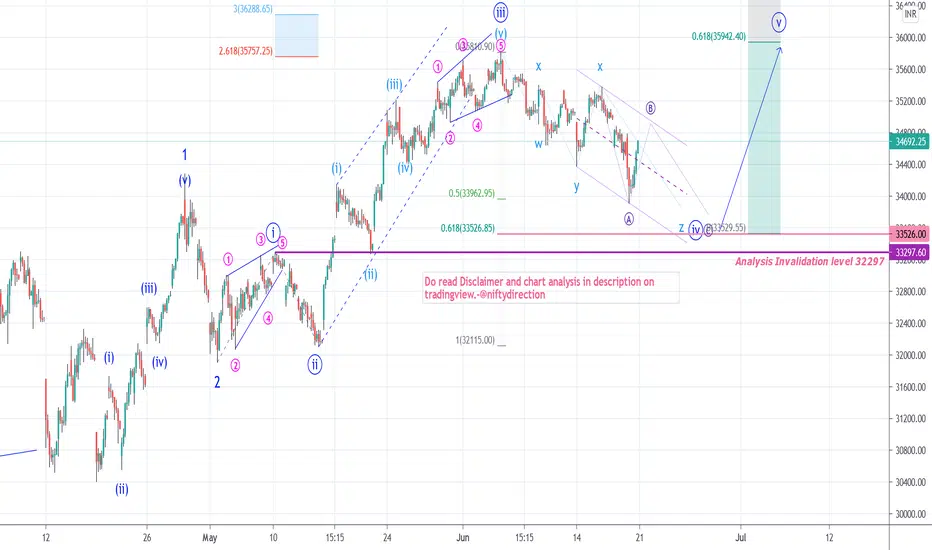
Banknifty Triple Zig Zag Correction Complex CorrectionBank nifty going through triple zig zag complex correction and there is another 1000-1500 points correction possible towards 0.618 Fibonacci level.
With sharp recovery from 33909 its unclear if its A or Z wave completed already and new impulse started?
Monday will give Clear picture if its not able to cross channel top 35000 then we can expect C wave of Z to take it down towards 33500 (0.618)
Once correction is over we can expect V wave to begin towards 360000
This is the best possible E
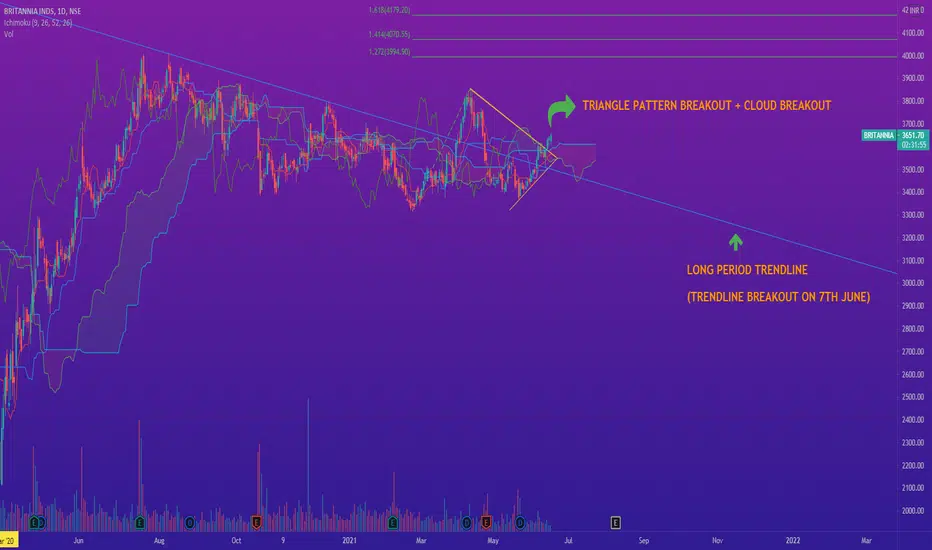
BRITANNIA | BUYBRITANNIA had given a long period Trendline Breakout on 7th June and sustained above the Trendline. The stock then gave Ichimoku Cloud Breakout along with Triangle Breakout on 15th June and sustained above Ichimoku Cloud, confirming a start of an good uptrend and a good buying signal.
Targets For Britannia by Fibonacci Extension Tool are:-
Target 1: 3995
Target 2: 4070
target 3: 4180
NSE:BRITANNIA