 Long
Fibonacci Extension
Long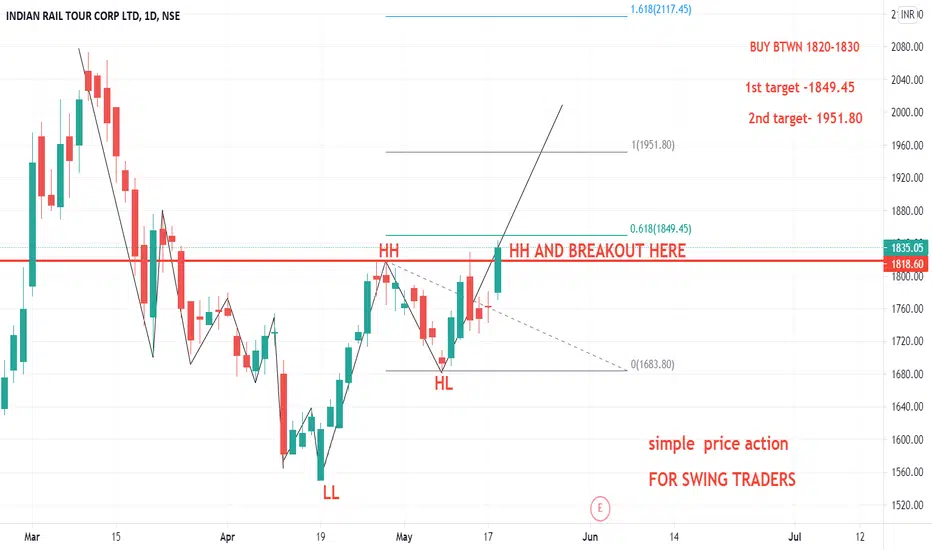
 Long

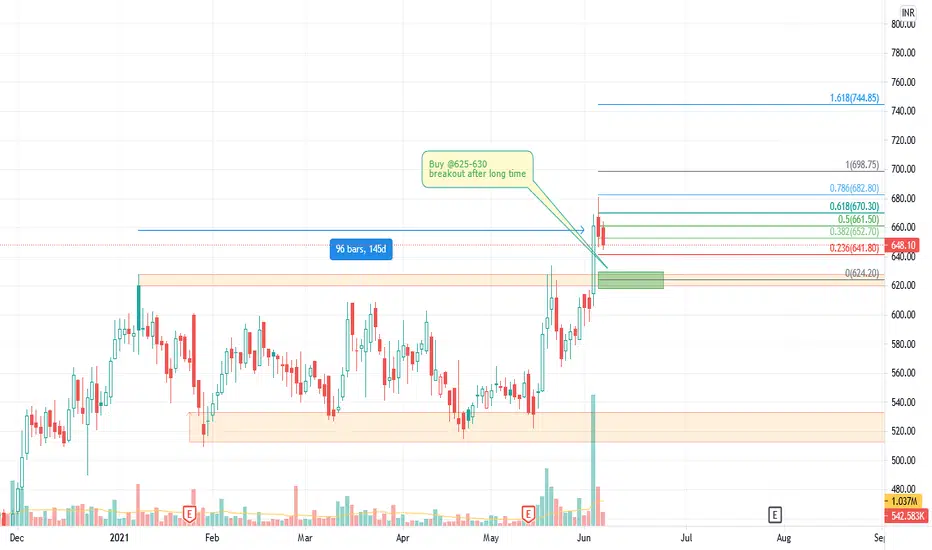
Oberoi Realty from 7 June 2021The stock has given breakout after 145 days
Buy :
15% --> 625
15% --> 630
70% --> 650 AFTER TOUCHING 625 SUPPORT PRICE
ABOVE BUYING SPLIT TO PREVENT FALSE BREAKOUT
Target :
670 -> 680 -> 700 -> 740
 Long
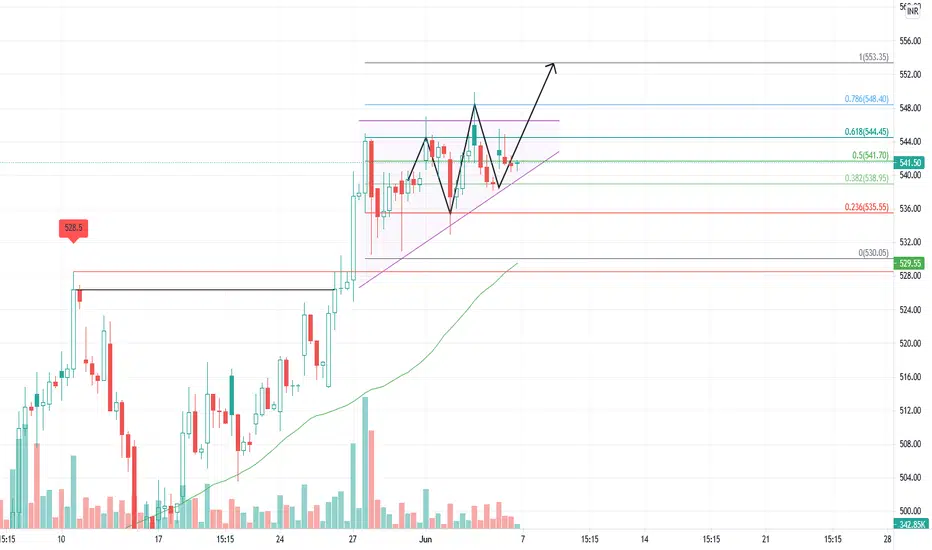
Wipro from 5 June 2021Trend : upside
Chart pattern : flat top Ascending bottom
Support : Major: 520-525 Minor : 535
Target : 545 - 550 -555
 Long
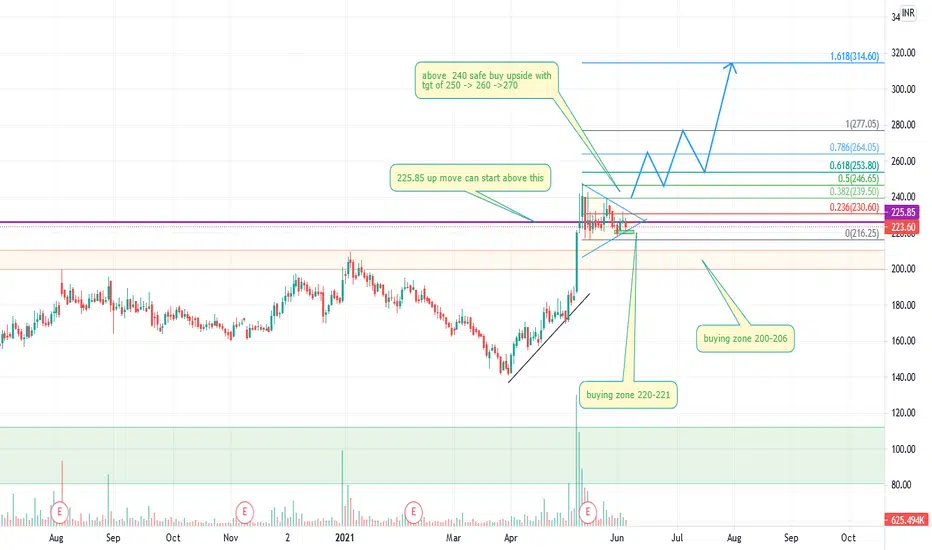
SPARC from 4 June 2021The stock has given breakout with good pattern
Major Support : 200-206
Minor Support : 218 -222
Upside move:
above 226 minor long can be taken
above 240 major long can be taken
Target : 250 -> 260 -> 275
 Long
Colpal from 30 may 2021The stock has given breakout then --> retest done not much volume but still
small long position can be taken
 Long
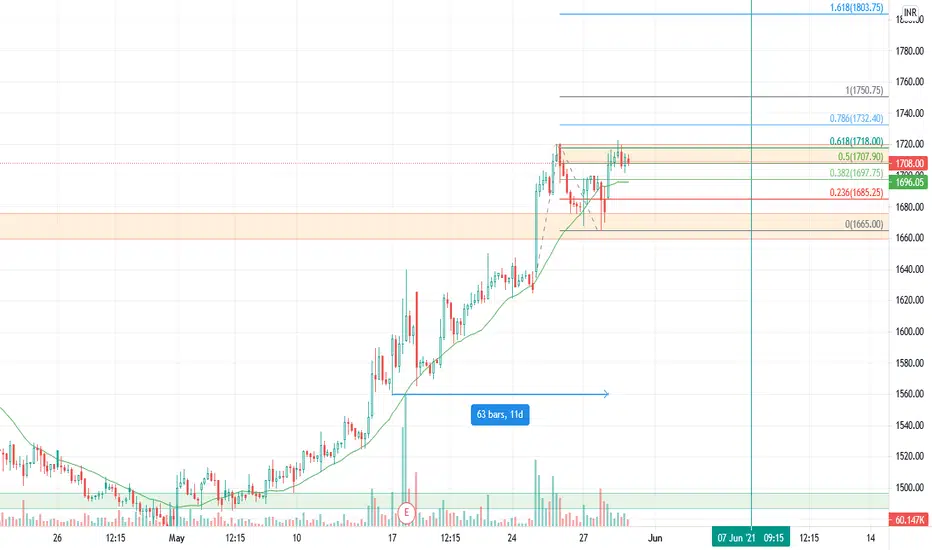
 Long

50% Capital gain opportunity ahead in L&T Finance50% Capital gain opportunity ahead in L&T Finance in next few months.
 Long

Bajaj Finance | On demand of follower :) 🔰 MY thought process :
⭐ Well As nifty touching ATM once again so we can also see a good move in BJFin too, but instead it produced an evening star on the D chart = bearish sign, that too at resistance, Q is will that make it bearish = yep but only intraday basis, and that would be against the trend trade wrt overall market sentiments :), so I would not touch BJfin until it breaks through the lvl of 5834 or gives a breakaway GAP above that lvl = super bullish sign.
⭐It has taken support from th
 Long

SAIL Analysis | Can you enter now ? 🔰 MY thought process :
⭐ I have studied all the past data and made a good buy zone here if it comes to my levels that is this zone and gives me a conviction pattern on lower TF or then I will activate a trade :) well if gets higher and higher I will simply leave the trade and move on to other good stocks in the market :)
⭐A good pattern or trendline or a good bullish candle on 50 dema = A good sign to keep an eye on it again and than a good entry on lower TF is what i will prefer :)
⭐No good e
 Long

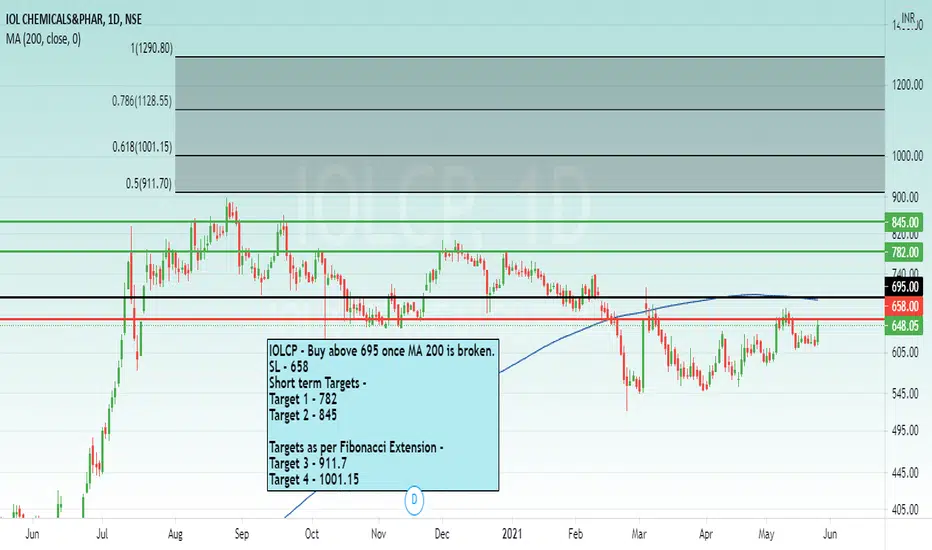
IOLCP Positional Target By Eminence StocksIOLCP - Buy above 695 once MA 200 is broken.
SL - 658
Short term Targets -
Target 1 - 782
Target 2 - 845
Targets as per Fibonacci Extension -
Target 3 - 911.7
Target 4 - 1001.15
 Long
 Long
 Long
 Long

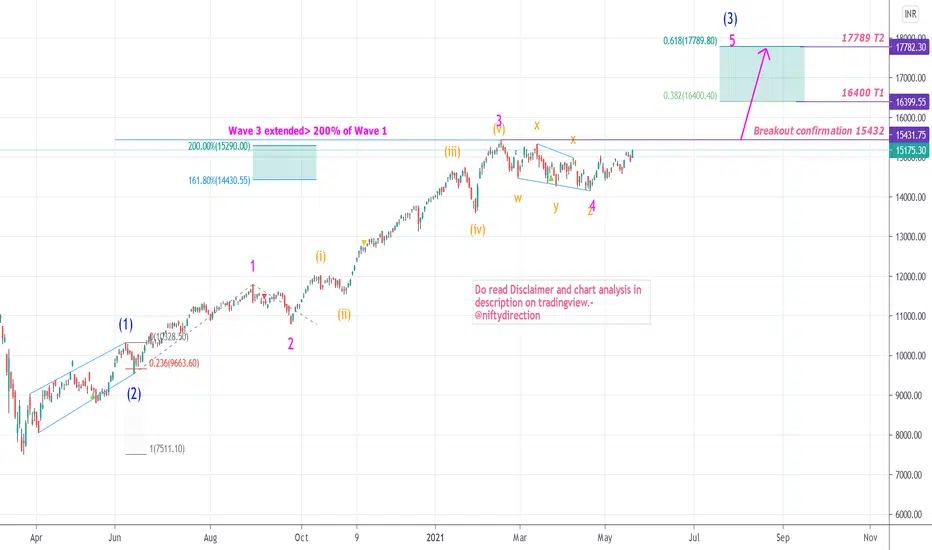
Nifty Redraw Elliot Wave Count and New High ProjectionFollow Blue count Wave (1) Leading was made when recovering from Mar 2020 low we are currently in wave (3) which is extended and still in progress.
Follow Orange count Five moves started in Oct-Nov 2020 which triggered massive rally wave (iii) extended nearly 261.8% of wave (i).
It came to end at ATH 15432 then this whole (i) to (v) wave sequence got corrected in the form of triple three retracing bit more than 23.6% at 14151.
Follow Pink count here wave 3 extended more than 200% and looks t
 Long
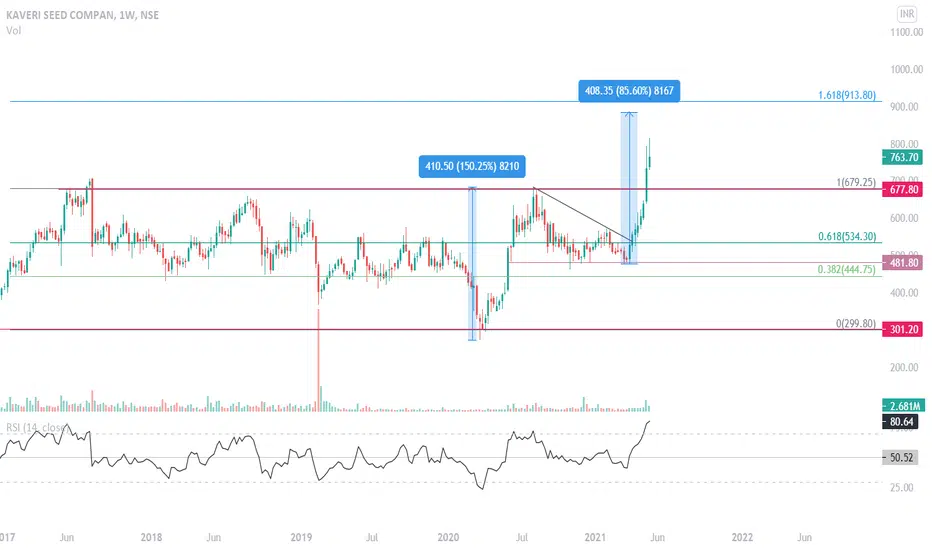
KSCL Heading Toward 900?Based on the weekly chart, KSCL has broken out of a long descending triangle/pennant. A measured move of the flagpole gives a target of 900. Fib 1.618 extension also shows tentative 900-910 on cards.
 Long
Glenmark Expanding Leading Diagonal on Monthly ChartGlenmark is expected move in expanding Leading Diagonal.
V wave of leading diagonal always moves beyond end of wave III.
V wave expected to move minimum 100% of length 0 to III somewhere near 1400+.
Most likely to 138%(1.382) or 168%(1.618) which are near trend line.
The prospects and analysis are for long term if anyone wants to keep stop loss then they would 405 or 161
DISCLAIMER:There is no guarantee of profits nor exceptions from losses.
Technical analysis provided on the chart is solely t
 Long

Bank of baroda 5th Impulse startThree white soldiers formed on weekly chart.
Dip towards 75-73 long opportunity
5th wave expected to be extended reaching anywhere between 1 to 1.618 levels.
If channel drawn on iii and iv gets broken aim for 1.382-1.618 levels. Other details on chart
DISCLAIMER:There is no guarantee of profits or no exceptions from losses. The study provided is solely the personal views of my research. You are advised to rely on your judgment while investing/Trading decisions. Past performance is not an indic
 Long

Nifty impulse wave count and conditional upside breakout pointNifty came down in Zig Zag wave with C wave reaching 14650.
This is important support near trend line, interestingly that is near 0.618 Fibonacci level
Until 14782 gets broken there is no upside confirmation.
Once breaks will attempt new high as 1.618 Fibonacci extension above 15550+ or minimum 15210+
Bearish below 14460 so 14782-14460 is no trading zone.
DISCLAIMER:There is no guarantee of profits nor exceptions from losses.
Technical analysis provided on the chart is solely the personal vi
Long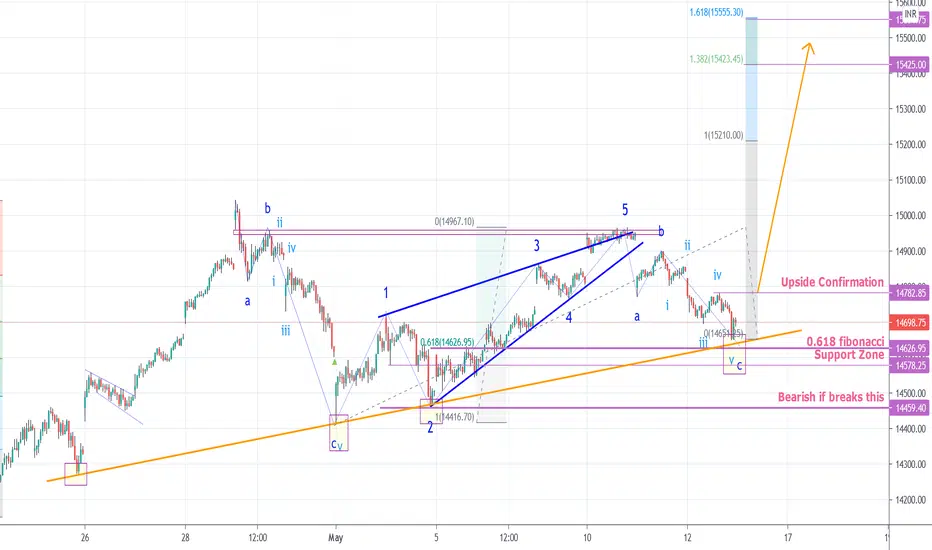
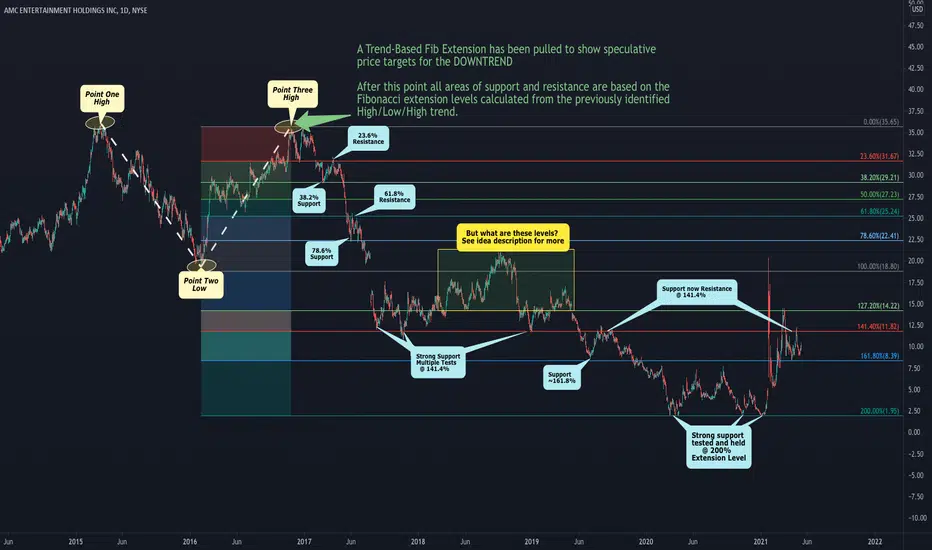
Using the Trend-Based Fib Extension ToolThe Fibonacci ratios are widely used among traders to help identify potential areas of reversal in the movement of price action.
The Trend-based Fibonacci Extension tool utilizes three points on a previously identified trend in order to draw the Fib ratios on the chart.
In the chart above, price was rejected twice forming a double top which is a fairly strong reversal pattern. To help identify potential areas of support and resistance we have drawn a Trend-Based Fib Extension.
Using the doub

 Education
Nifty next moves After a weak session today, nifty is ready to head towards 14000, if nifty goes below 14412-15, next target would be 14340-14230-14100 as shown the fibonacci levels. Break of these levels are necessary for next target and pullback will be there for shorting opportunity.
But overall after 14412-15 break 14100-13900 doors will be open with both hands.
On the upside to move towards 15000 again nifty need to break 14725 level and sustain to go towards 15000-15300
Short
Nifty to start 5th Wave towards 15100This is internal move of nifty we can call iii of 3 completed at 15044.
Wave ii was shallow and complex
Wave iv is zig zag retraced nearly 0.618 Fibonacci
Reversal expected near 14605
Stop loss is top of wave i which is 14557
wave v of 3 is expected to go towards 15120 levels
DISCLAIMER:There is no guarantee of profits nor exceptions from losses.
Technical analysis provided on the chart is solely the personal views of my research.
You are advised to rely on your own judgments while taking an
Long
Muthooth Finance Extened 5th Wave and Pole Flag FormationAll analysis visible in chart.
DISCLAIMER:There is no guarantee of profits nor exceptions from losses.
Technical analysis provided on the chart is solely the personal views of my research.
You are advised to rely on your own judgments while taking any investing/Trading decisions.
Past performance is not an indicator of future returns. Investment/trading is subject to market risks.
Seek help of your financial advisors before investing/trading.
Not recommended to take FnO positions based on this
 Long

Cup 'n' Handle lift OXT to BOn the 4hr, calling it a cup and handle ready to take OXT to B. Closing bag at 0.70, then retrace to jump back in around 0.65 at C. Closing 0.80 to finish D. I was trying to make out a large head and shoulders on the 1D but not sure if that is lining up right. What are your thoughts?
Information stated here is not financial advice. Your own research is recommended. Happy trading!
 Long
