FASP levels for Bank Nifty 09/04/2024The FASP for BankNifty is listed for 09-04-2024. You can add this levels to your trade setup for better results. This should not be the only indicator but an additional tool to increase your winning possibilities.
What is Fibolysis Anchor SupRes Points(FASP)?
It is a unique level arrived by using Fibonacci Retracement , Fibonacci Extension , Standard Pivot levels under various Timeframes. It is an extensively analyzed level to draw the support and resistance levels for the next day. You can use
Fibonacci Retracement
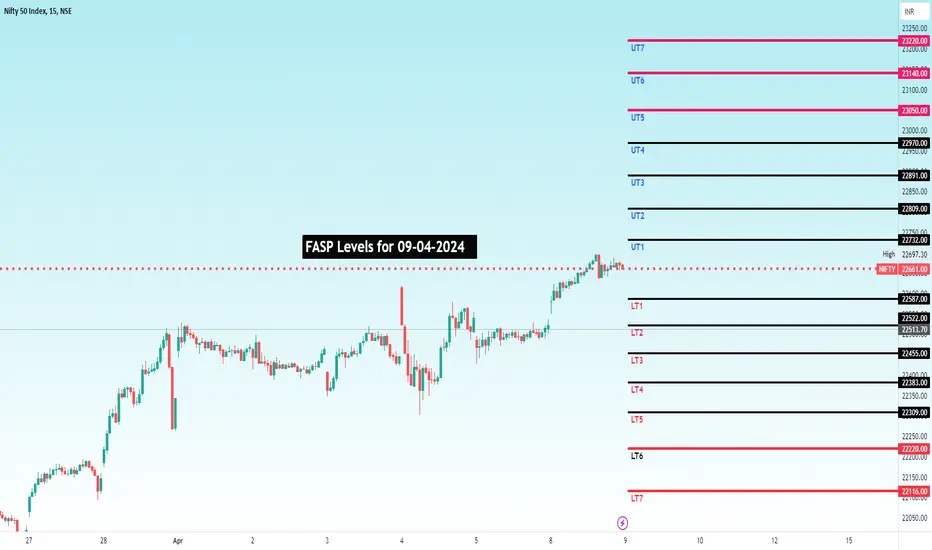
FASP levels for Nifty 09/04/2024The FASP for Nifty is listed for 09-04-2024. You can add this levels to your trade setup for better results. This should not be the only indicator but an additional tool to increase your winning possibilities.
What is Fibolysis Anchor SupRes Points(FASP)?
It is a unique level arrived by using Fibonacci Retracement , Fibonacci Extension , Standard Pivot levels under various Timeframes. It is an extensively analyzed level to draw the support and resistance levels for the next day. You can use the
FASP levels for Bank Nifty 05/04/2024The FASP for BankNifty is listed for 05-04-2024. You can add this levels to your trade setup for better results. This should not be the only indicator but an additional tool to increase your winning possibilities.
What is Fibolysis Anchor SupRes Points(FASP)?
It is a unique level arrived by using Fibonacci Retracement , Fibonacci Extension , Standard Pivot levels under various Timeframes. It is an extensively analyzed level to draw the support and resistance levels for the next day. You can use
FASP levels for Nifty 05/04/2024The FASP for Nifty is listed for 05-04-2024. You can add this levels to your trade setup for better results. This should not be the only indicator but an additional tool to increase your winning possibilities.
What is Fibolysis Anchor SupRes Points(FASP)?
It is a unique level arrived by using Fibonacci Retracement , Fibonacci Extension , Standard Pivot levels under various Timeframes. It is an extensively analyzed level to draw the support and resistance levels for the next day. You can use the
Falling Knife stocks-How to identify them?I have discussed in previous post about what exactly falling knife stock is with a case study.
The next question would be how would an investor know that stock is a part of falling knife category?
To identify such stocks, I feel you should know about 2 concepts/indicators which are Moving averages and Fibonacci retracement. I will try to make you understand these concepts and also the levels where averaging/investing can be started.
1. Fibonacci(Fib) is a mathematical concept which governs the
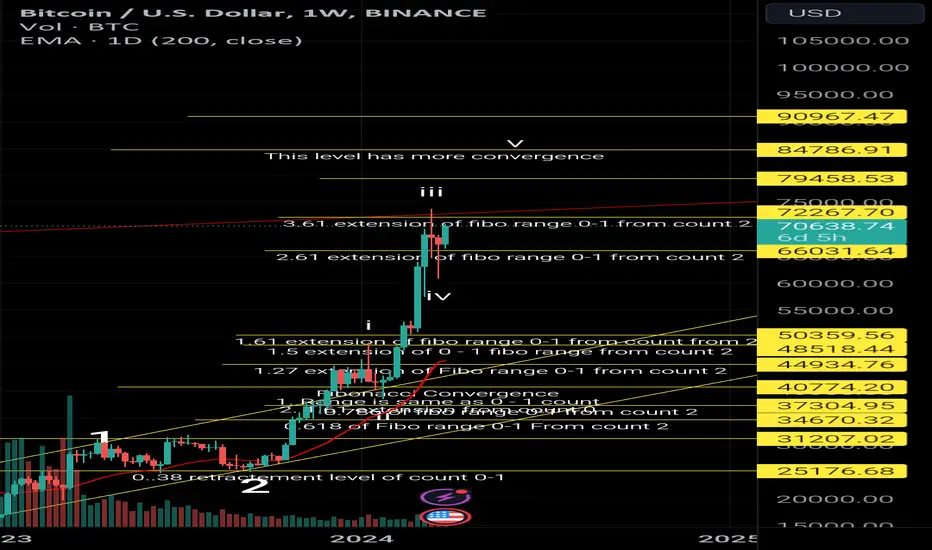
Fibo levels - BTC - 84800Considering the convergence level & wave count, have drawn few important support & resistance levels.
At current price structure, the prices could extend upto 84700 -84800 levels, this level has more convergence or going to be the area of confluence.
& price movement also stiff & it has expended more than 1.5X of 200 EMA.
T1: 79450
T2: 84800
T3: 90800
BPCL | Weekly Chart | 6 years BO | Chart analysis on Weekly time frame:
Analysis:
1. Resistance zone is tested 5 times before final BO making it very critical resistance zone.
2. Before BO, consolidation happened supported by volume build up which eventually indicates that the stock accumulation is happening.
Breakout: Consolidation phase BO happened on 2-Feb-2024 followed by BO supporting candle.
Trade setup:
Entry price: If price closes above 577.85.
Stop loss: Below 522.3
Target 1: 667.7
Target 2: 813.1
Targe
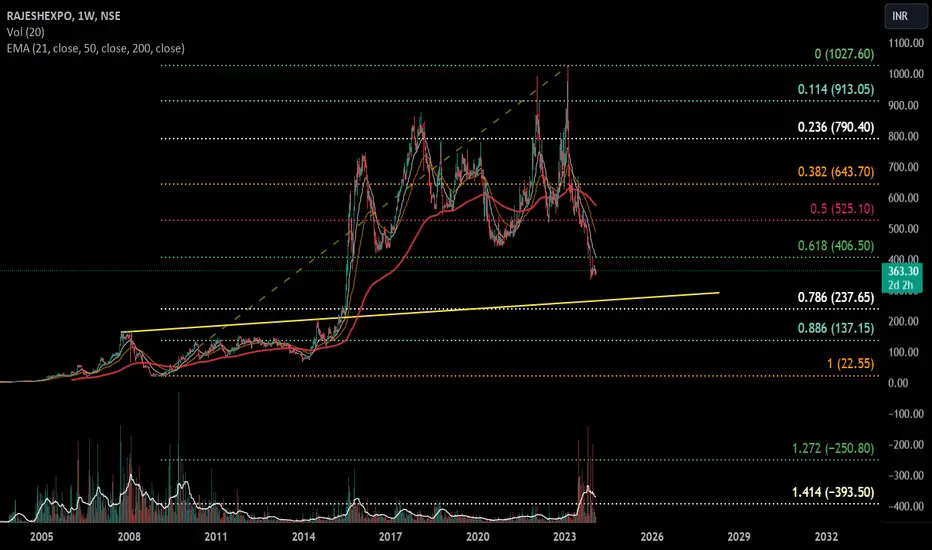
ABFRL Outlook...I've applied the Fibonacci retracement tool to ABFRL stock's recent uptrend to identify potential support and resistance levels.
Analysis:
Starting Point: Mentioned on the chart
Ending Point: Mentioned on the chart
Disclaimer: This is for educational purposes only. Conduct your own research and consider your risk tolerance before trading.
FASP levels for Nifty 06/03/2024The FASP for Nifty is listed for 06-03-2024. You can add this levels to your trade setup for better results. This should not be the only indicator but an additional tool to increase your winning possibilities.
What is Fibolysis Anchor SupRes Points(FASP)?
It is a unique level arrived by using Fibonacci Retracement , Fibonacci Extension , Standard Pivot levels under various Timeframes. It is an extensively analyzed level to draw the support and resistance levels for the next day. You can use the
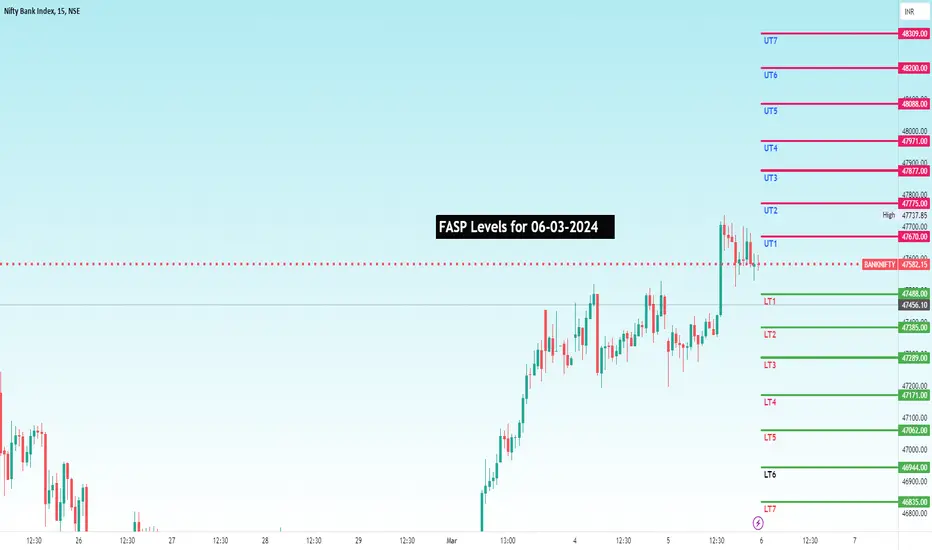
FASP levels for Bank Nifty 06/03/2024The FASP for BankNifty is listed for 06-03-2024. You can add this levels to your trade setup for better results. This should not be the only indicator but an additional tool to increase your winning possibilities.
What is Fibolysis Anchor SupRes Points(FASP)?
It is a unique level arrived by using Fibonacci Retracement , Fibonacci Extension , Standard Pivot levels under various Timeframes. It is an extensively analyzed level to draw the support and resistance levels for the next day. You can use
FASP levels for Nifty 05/03/2024The FASP for Nifty is listed for 05-03-2024. You can add this levels to your trade setup for better results. This should not be the only indicator but an additional tool to increase your winning possibilities.
What is Fibolysis Anchor SupRes Points(FASP)?
It is a unique level arrived by using Fibonacci Retracement , Fibonacci Extension , Standard Pivot levels under various Timeframes. It is an extensively analyzed level to draw the support and resistance levels for the next day. You can use the
FASP levels for Bank Nifty 05/03/2024The FASP for BankNifty is listed for 05-03-2024. You can add this levels to your trade setup for better results. This should not be the only indicator but an additional tool to increase your winning possibilities.
What is Fibolysis Anchor SupRes Points(FASP)?
It is a unique level arrived by using Fibonacci Retracement , Fibonacci Extension , Standard Pivot levels under various Timeframes. It is an extensively analyzed level to draw the support and resistance levels for the next day. You can use
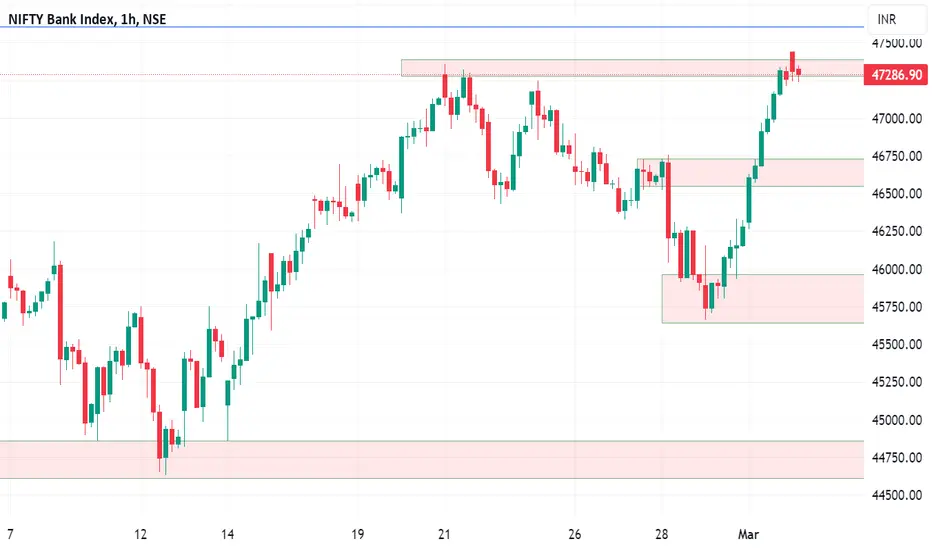
Banknifty weekly analysis for 04/03/24.Last week the markets were volatile.
A M pattern formation and immediate reversal forming a V pattern shows the volatility.
The market need to retest of halt on the upper levels before crossing the ATH.
On friday, there was a 2.5% bullish move in banknifty it seem to be bullish as on intraday levels.
Positional trades can also be entered, if market comes to test 46500-700 zone.
Now the resistances on the upper side seems to be somewhat weak.
Major bullish target :- 47600, 47840
Supports