Fibonacci Retracement
GUJARAT GAS LTDThis is no doubt a fundamentally good company trading at its low while its peers are trading a their higher levels. So it can be strongly assumed that this stock may perform in the upcoming time. Reasons for which GUJARAT GAS seems to be bullish on charts at least for short term:
1. Trend line support is been taken since the beginning of the month at Golden Ratio of the previous up trend.
2. A Bullish candlestick pattern has been formed.
3. The time cycle of 29 days (plotted as vertical das
GLong
NIFTY OUTLOOK (DOWNSIDE BY 10TH TO 15TH MAY)After forming a Bullish Wolfe Wave, Nifty has been rallying fantastically. It has successfully given a break out of the 2-4 TL. And with ups and down I expect the rally to continue till 10 May to 15th May 2023. I am not sure about the price levels but the utmost high that is achievable by NIFTY seems to be 18605 (18605 has been derived by both Price action and Fibonacci Retracement)
The reason is purely because of Time cycle. As I have posted earlier the exact downside reversal of Nifty start
Fibonacci levels plot levels to watch out for around the $300 The $315 and $300 levels of resistance and support respectively have been important on the lower timeframes. Over the past 48 hours, BNB has declined from the local highs at $316.3 to trade at $308.5, at the time of writing.
On the 6-hour chart, the RSI was unable to climb above neutral 50, showing the persistence of the bears. Over the past week, the trading volume was low as well. This came at a time when BNB retested the $300 level.
With Bitcoin facing rejection from beneath the $27.8k resi
nifty pull back complete?Nifty is on correction path on a uptrend for the last 2 trading sessions. from the last low of 16828 in march 23, the 1st phase of rally was till 17842 ( rally of about 1000 points) we saw a pull back there after till 17553 (about 300 points). if we plot fib retracement then this form about the 0.618 level of the rally. the next phase of rally was from 17553 to 18459( again about 1000 points). in the last 2 days the correction has happened till 18115 (about 320 points) this again is approx 0.
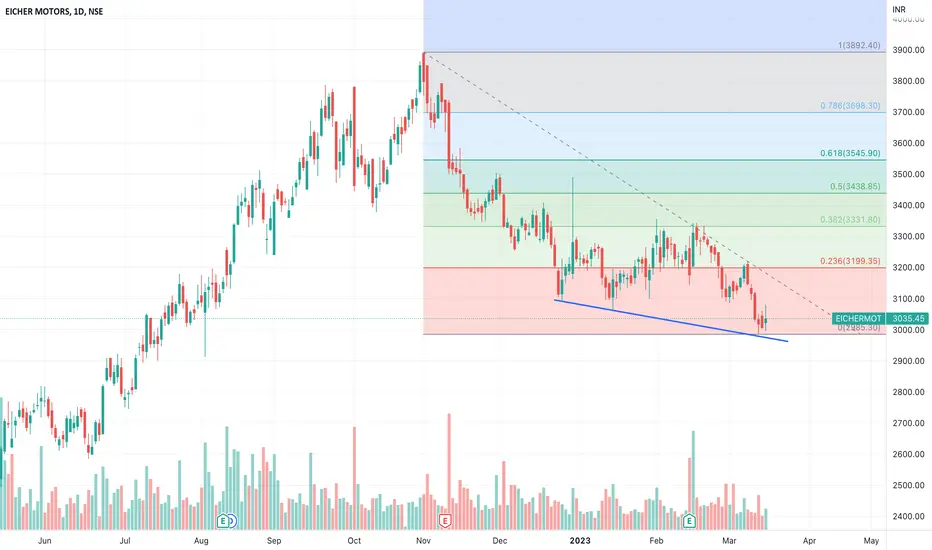
Fibonacci RetracementFibonacci retracement levels—stemming from the Fibonacci sequence—are horizontal lines that indicate where support and resistance are likely to occur.
The indicator is useful because it can be drawn between any two significant price points, such as a high and a low. The indicator will then create the levels between those two points.
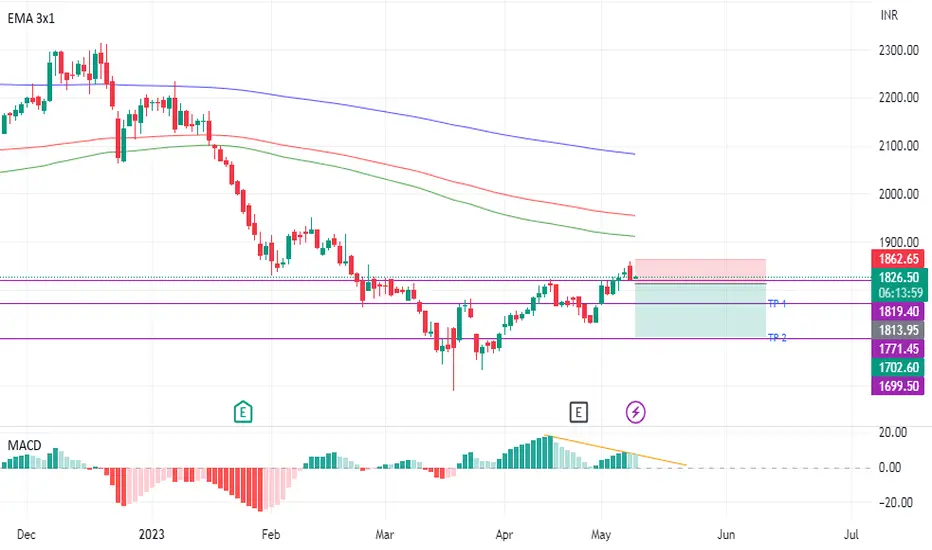
Script = Heromotocorp
Time Frame = 1 Day
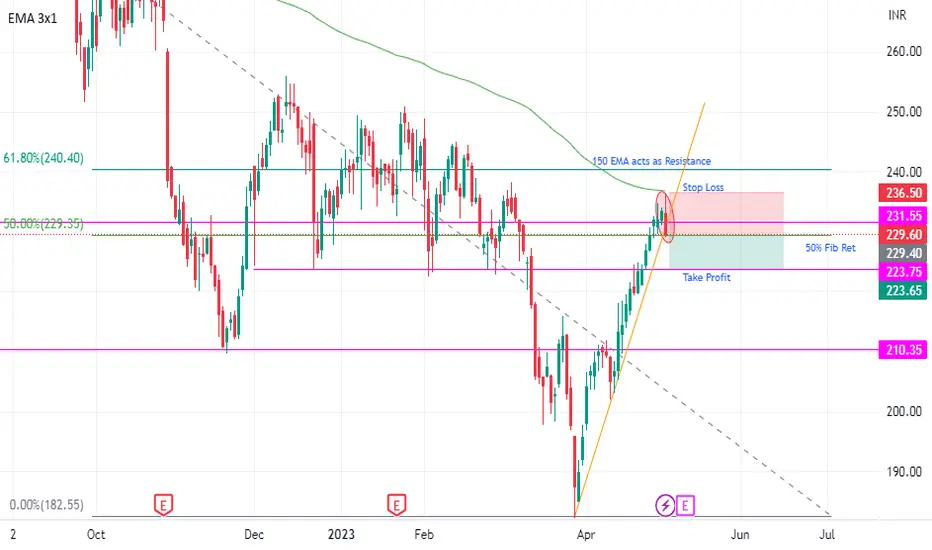
1D BANDHANBNK (Bandhan Bank) - Short Position1. Bearish Engulfing Pattern formed at S/R zone.
2. Another Confirmation is 50% Fib Retracement at S/R level that is strong zone than you think.
3. Oh...Come on EMA 150 act as Resistance.
4. Trendline got broken very well by Engulfing Candle.
5. First TP1 level price reached sell half of your stocks there.
6. Move your SL to BE for another TP2 level which you need to target that zone.
Thanks by
Pupathi Sadagopan
1D BANKINDIA (Bank Of India) - Short Position1. Pinbar formed at S/R level
2. Fibonacci Retracement 61.8% confirms that S/R level.
3. Trendline is in perfect position for the pinbar which acts as trendline.
4. Stop Loss and Take Profit levels are perfectly mentioned in the chart window.
5. Once Take profit level reached, try to sell half of your stocks position there and move your stop loss to breakeven and run another half stocks for freedom.
Thanks by
Pupathi Sadagopan
Nifty 3 Wave Correction likely aheadNifty could have completed 5 wave impulse up at 18267. If this doesn't get broken then likely 3 wave drop towards 17550-400 zones possible.
MACD negative divergence and open bearish gap suggest bearish trend to continue few days.
2nd Chart shows internal count of wave 5. It also shows 0 to 4 trendline about to be broken
Next wave 2 of A will pullback Nifty up to 18190 in next 1-2 session
From there 18055 break will pull down Nifty to 17700-800 zones to complete A wave. Then there will be B and
1D DELTACORP (DELTA CORP LTD) - Short Position1. Bearish Engulfing Candles formed at Support and Resistance Zone.
2. 61.8% Fibonacci Retracement is another confirmation on that S/R level.
3. EMA 365 is off on the Bearish Engulfing Pattern.
4. Entry should be carefully placed at mentioned area because strong S/R level is there but it will definitely break those level and reached it to another S/R zone.
5. Take Profit and Stop Loss level which is clearly mentioned in the chart window. Check that there.
Thanks by
Pupathi Sadagopan
4H BHARTIARTL - Long Position1. Bearish Engulfing Pattern formed at Supply and Demand Zone.
2. Fib Retracement occurs perfectly at 50.0 Level.
3. EMA 365 and 150 acts as Support and Resistance at that zone.
4. Take Profit and Stop Loss levels perfectly mentioned with clear details on the Chart window.
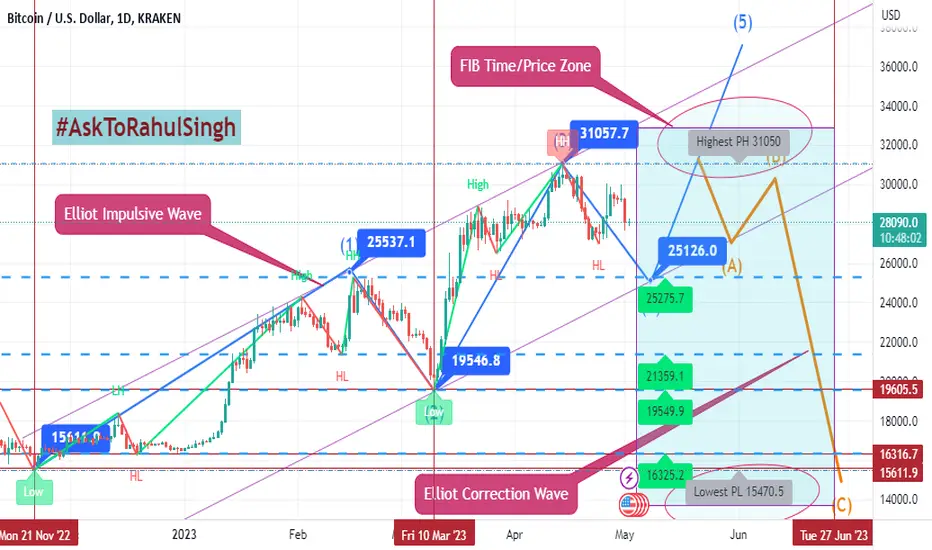
BITCOIN moves at Elliot Impulsive Wave#Bitcoin Daily based chart movement as per #Elliott #ImpulsiveWave & #CorrectionWave Pattern, whereas their price up-down zone as per #FIBretracement is Highest Point at FWB:31K & Lowest Point of $15.5k up-to 27 June 2023 max.
All Analytical views, dates and zone displays in chart, as well as #DYOR too.
Nifty 50 Visualizer is BEARISH!⚠️Attached: Nifty 50 Daily Chart as of 19th April 2023
In the above Nifty 50 Visualizer Chart, I want you to pay attention to 3 things:
1) Trend Lines
2) Fibonacci Retracement
3) RSI
This is quite a Self Explanatory Chart but for those who don't get it, here are a few points for explanation:
- Notice how Price has reacted around the Trend Lines and the Marked Arrows indicating the same
- Price has stalled at 0.5 Fib Retracement of the Decline that started in December 2022
- Daily RSI has failed
Borosil renewable is an example of a textbook patternWeekly analysis of Bororenew stock can be analyzed as a beautiful representation of flag and pole pattern.
The flag is a falling wedge pattern and currently is nearing the breakout zone which is also its 50% fib retracement level.
The daily time frame chart of the stock is signaling a bullish breakout and the risk to reward is very attractive.
Fundamentally, this stock is one of the best picks for renewable sector. You can study the chart and invest as per your own analysis.
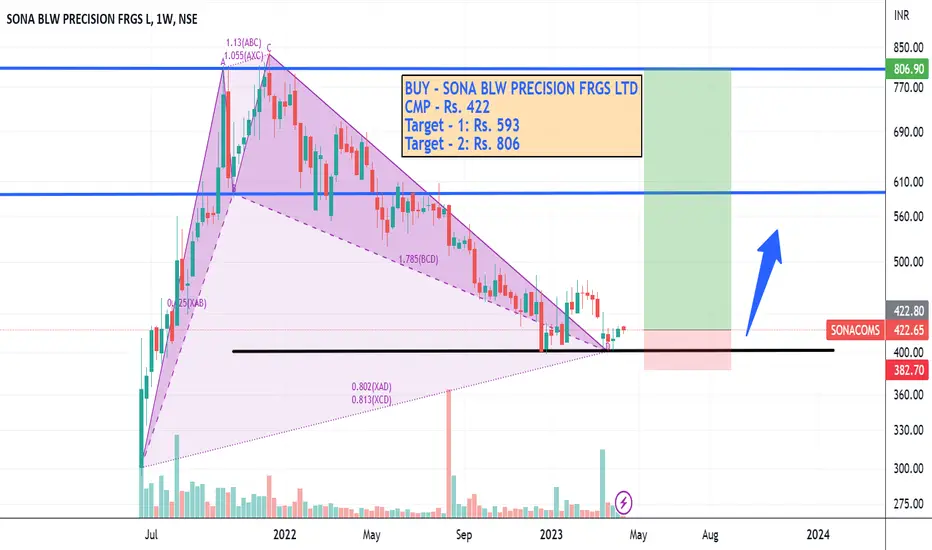
SONACOMS - 90% RETURNS!!!BUY - SONACOMS
CMP - Rs 422
Target - 1: Rs. 593
Target - 2: Rs. 806
.
.
Technical -
1) Bullish Cypher Harmonic Pattern.
2) The stock is at support.
3) Targets have been set using Fibonacci Retracement.
.
.
Fundamentals -
1) Company has opened a new manufacturing plant in Pune.
2) 62.66% YoY growth in EPS.
3) FII holding has increased QoQ.
4) DII holding increased by 8.4% QoQ.
5) The high-value, the high-margin product portfolio is likely to help the company outperform the industry.
.
.
Comment: