BIOCON OVERSOLD (FIBO TIME ZONE ANALYSIS )Biocon Ltd looks fundamentally very disappointing but there are few patterns on charts that makes it technically interesting at this point of time. Betting for an upside with a calculated risk doesn't seem as a bad option for now.
BIOCON ON CHARTS:
- Biocon has formed a Bullish Wolfe Wave.
- After 10 Weeks the Weekly closing has been above prior candle's close.
-The bullish pattern has been formed at a very important Fibonacci Retracement level of 89%.
- RSI is at Oversold zone and at Reversal Z
Fibonacci Retracement
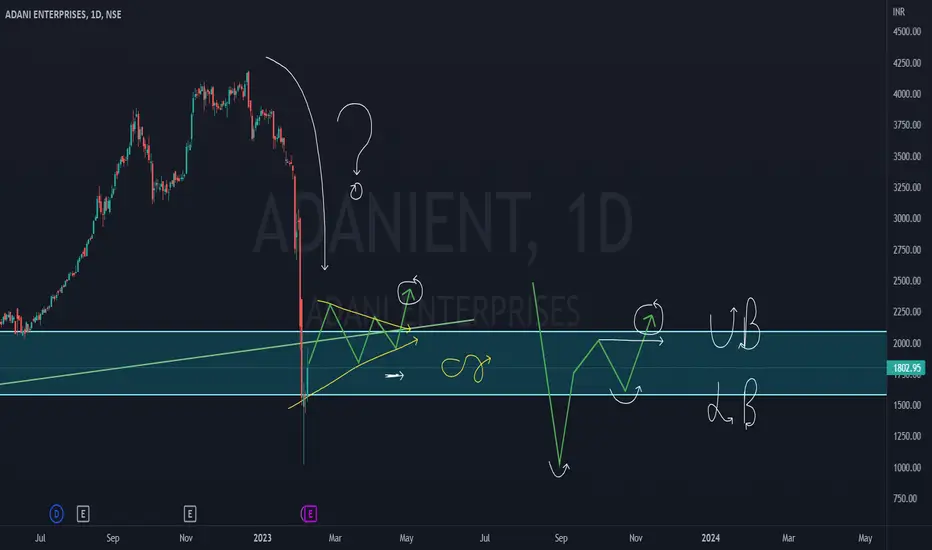
Adani Enterprises at an important levelAs we can see on the daily time frame Adani enterprises at an important Fibonacci level which is 0.382 we can probably see a reversal from this point. we can enter into a short trade if trend line on the 15 min chart is break also we can achieve big target in this trade but with the proper segment selection and position sizing.
Concept of Soft,Hard Landing feat Adani Enterprises 1 ) Monthly Time frame story: This story tells us about the fibo retracement
- From the start of the journey of its price action till date, it has given a solid return
- Retracement was always pending in this stock. There can be two types - soft and hard landing type retracement
2) Stock has retraced almost 50-60% of its total lifetime move - Only Issue is Daily time hard landing retracement
Soft Landing
- Stock moving with a zig-zag type formation, that is, making lower lows with lower highs,
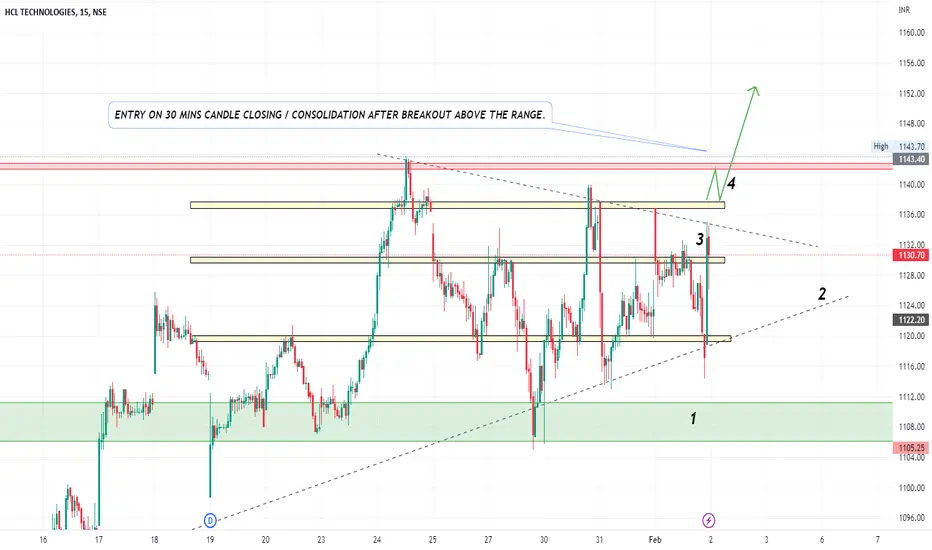
HCLTECH SWING TRADE ON BREAKOUTThis Is A Pure Technical Analysis Of hcltech
1)The Stock Has Taken An Amazing Support At Fibonacci Retracement Of 50% In Weekly And Daily Time Frame.
2) It Has Been Forming A Really Convincing Cup And Handle Pattern And Currently Trading Above Breakout Of The Pattern.
As We Can See In The 15 Minutes Time Frame Picture (please Check The Numbers Marked On The Picture):-
1) The Stock Has Been Consolidating Above Key Support Zone (acting As Support Zone From August 2021).
2) The Stock Is Formi
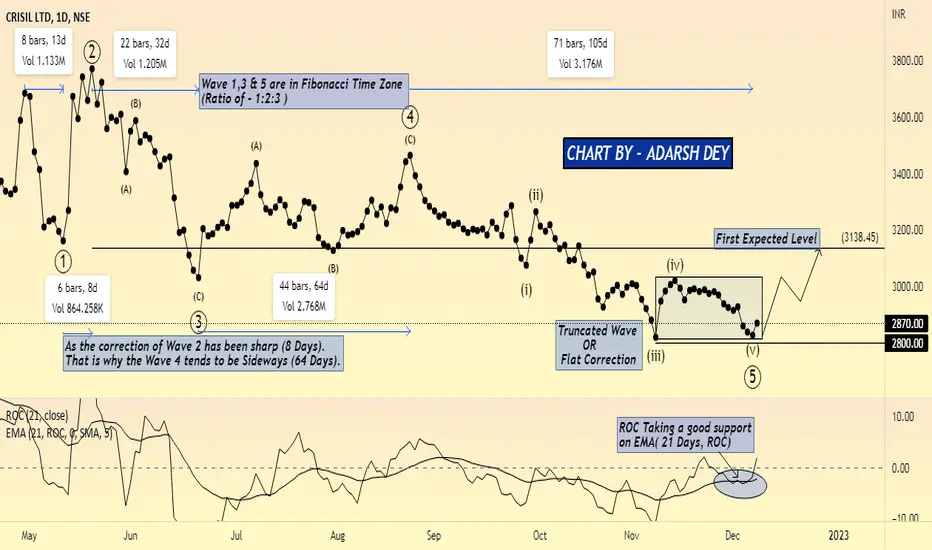
WAVE STUDY AND INDICATOR CONFIRMATIONCRISIL seems to have completed the correction at least for a shorter term. Wave counting is clearly mentioned on the chart. I request you not to get confused with Wave 2 as it is lower than the initiation point of Wave 1 but visible in Candlestick Chart. As the correction of Wave 2 have been really sharp ie. It was completed in 8 Days with 609 Points of Up move, that is why the Wave 4 is Sideways ie. It was completed in 64 Days with 438 Points of up move.
Wave 1 , 3 & 5 are in Fibonacci Time
DETAILED TECHNICAL ANALYSIS ON CAPLIN POINT LABORATORIES.Few pointers from my analysis on CAPLIN POINT LABORATORIES:
1. The stock has consolidated in the Triangular pattern and currently near its major support.
2. The major support trendline is near 0.382 Fibonacci level, thus has done healthy retracemet.
3. The Horizontal support is broken on the downside, however on lower volumes.
Conclusion:
The current setup is awaiting price confirmation by breakout of the resistance on Triangular pattern with high volumes and Breakout of RSI above 50. Overal
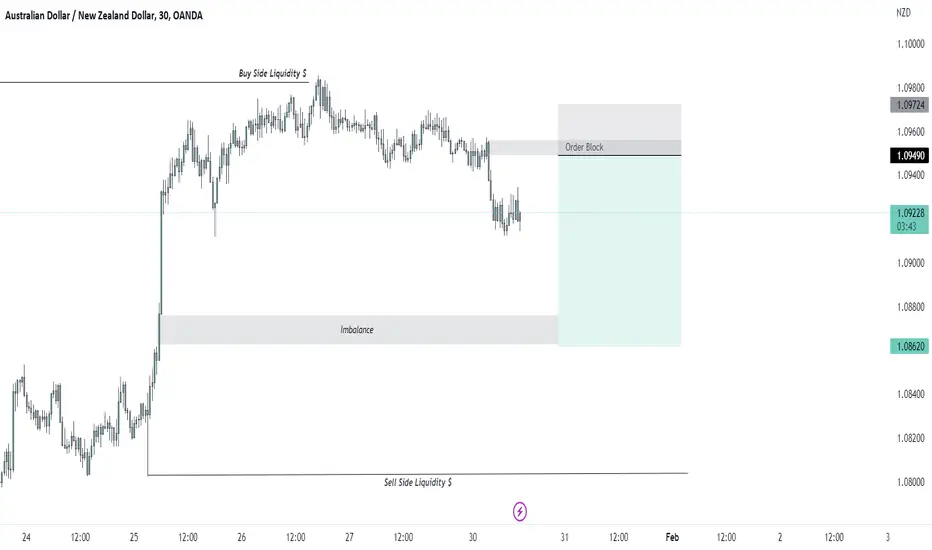
AUDNZD - 1H PROJECTIONDISCLAIMER: The Company accepts no accountability or obligation for your trading and speculation results, and you consent to hold the Company innocuous for any such outcomes or misfortunes. We are not financial advisers or account managers; We are Forex traders. The recordings on this channel are rigorously for educational and amusement purposes. Trading Forex implies dangers, and you can lose all your venture ; consequently, you exclusively must take a chance.
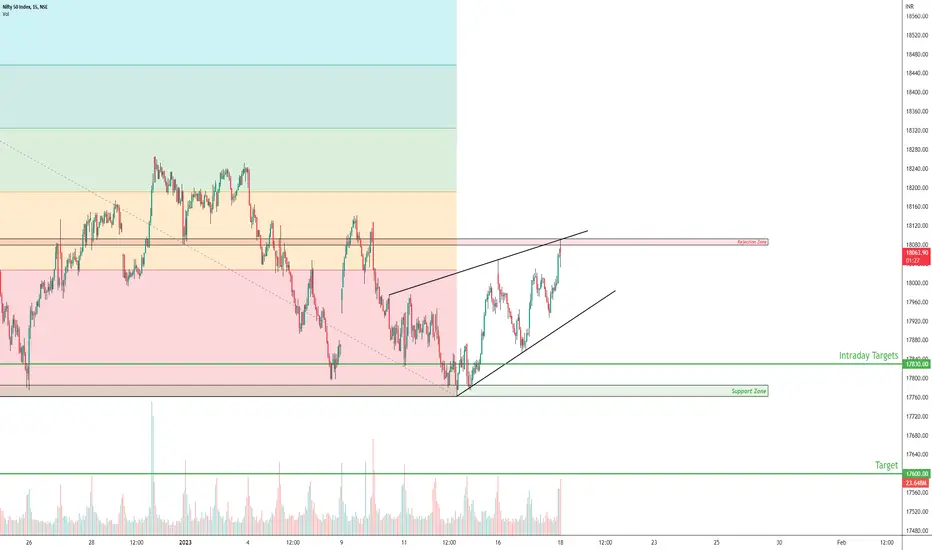
Breaking 17500 before Budget is possiblePossibility of breaking this low of 17785 and (b)reaching 17500 is more likely to clear out weak hands before Budget and expecting a sharp Short covering on Budget day But before that the downside is unpredictable. The yearly pivot is around 17000 which is also possible for next bull run till 19900 to 20000
BULL RUN Resumes in Metal stocks ? Tata Steel breaking out !!Tata Steel is trying to break out of the long Consolidation (1.5Years+)
It did a breakdown on 23rd Decemeber but immediately reversed which suggests a furious move on the other side.
It was also the 61% Retracement of recent trend.
Important Levels:
For Long term Investors: It should not Close and sustain below Rs100. Trade below 100 opens up the areas of Rs80-85.
For Short-medium term traders: It should not enter into the triangle zone again. Entering in it will suggest the lose of momentum
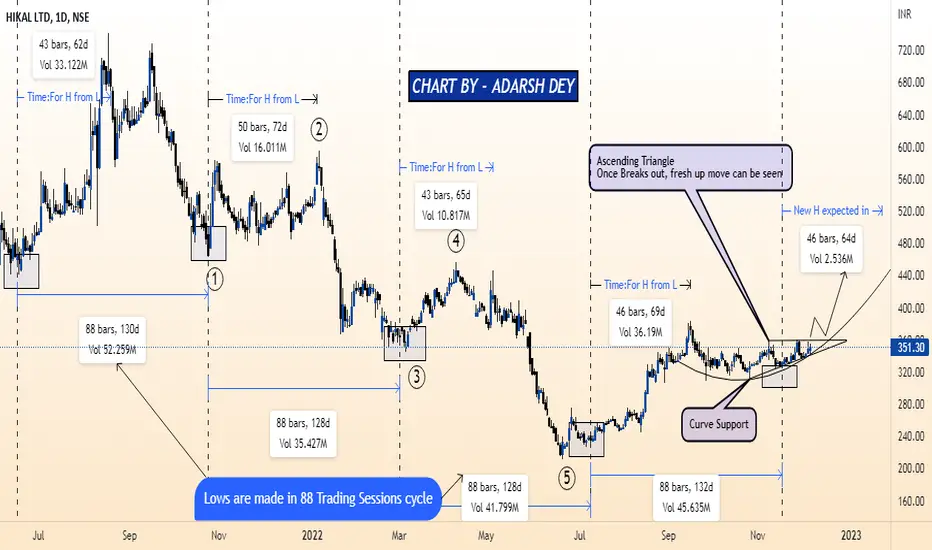
TIME CYCLES & PRICE STUDYThe correction in HIKAL LTD seems to be done, the wave counting has been mentioned in the chart. Currently the stock is trying to a time wise correction and has consolidated for a time being try to form a rounded bottom structure and taking support on a curve during the correction phase.
Interestingly HIKAL LTD has a trading cycle of forming a low in every 88 trading Sessions or roughly 128 to 130 days. Lows has been plotted in Rectangular plots and the time between each low has been plotted u
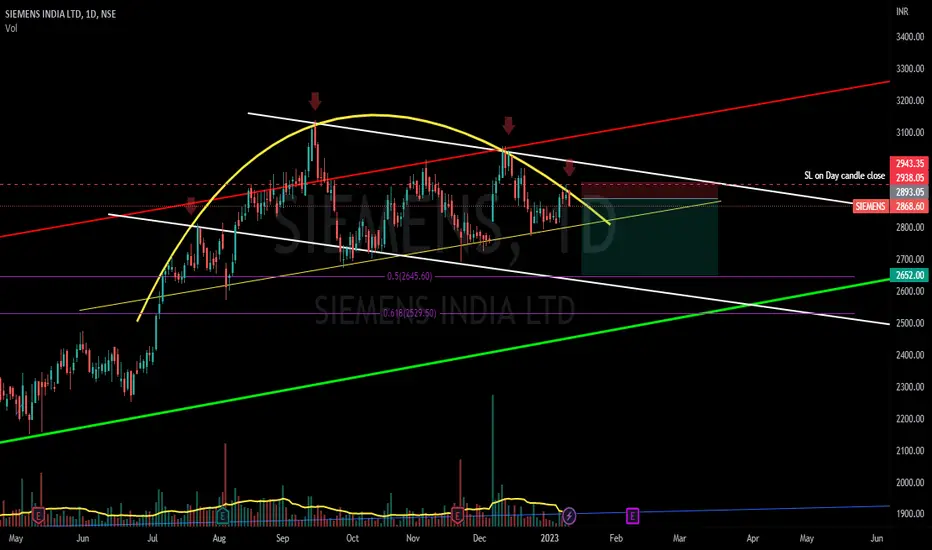
SIEMENS Ready for a Sharp CORRECTION MOVE ??!!!Chart patterns poise way for the above titled opinion
Reasons
1. SIEMENS travelling in a Ascending channel (From 2019)(Bright red & green lines shown in chart).
2. Now, it seems ready for the downswing (white trendline descending channel shown in chart) inside the Ascending channel.
3. Rounding top too confirming the chances of down move .
4. GAP b/w 6th & 7th December is acting as Support.
Entry can be made after the yellow trendline gets broken.(Keeping the high of the breakdown
BANKNIFTY BREAKDOWN OF INVERTED CUP & HANDLE ??!!!Chart Pattern depicts the situation clearly.
1. BankNifty travelling in a Descending channel(bright red and green lines shown in chart)
2. Inverted cup & handle formed and given a Neckline Breakdown with good volume!!! (and low too got tested)
3. Target can be 0.5 Fib support down ! !(as the depth of the cup measured)
4. 1hr closing above 42200 can fail the pattern and be our SL!!
Nifty too in formation of same pattern but not given breakdown!!!and it needs to close below 17800 for th
NIFTY (TIME & LUNAR CYCLE)The very word “lunacy” dates back to the 15th century when it was believed the moon and its phases could make people become more or less aggressive, depending on its place in the lunar cycle
Several studies found a connection between full and new Moons and stock market performance. Generally, stocks tend to perform better in the days around the New Moon, while price weakness is more frequently seen in the days around Full Moon. It was also observed that major market crashes have a history of h
MFL add to watchlista promising setup but one needs to catch it on green closing above the previous week for best entry for trading
and
if one wanna buy a great R:R can enter at cmp but with strict SL
SL will be closing basis below support zone in weekly timeframe or as per your setup
target as per fibo level one can take a sum of profit or trail as per fibo level or there own setup
one thing keep in mind its a weekly chart all the target must be follow on weekly basis
do u own analysis i might be wrong
i am