HEAD AND SHOULDER PATTERN (SELL SIDE)SELL : 1529 TO 1373
TARGET : 822 TO 730
Reason For Selling This Script :
In this script it has formed head and shoulder pattern in in monthly time frame. Now price has been broken the neck line and retested the neckline. So we can go for sell side target above mentioned.
Note :
Above given levels are based on monthly & weekly time frame . So be patience it will take some months to achieve the target.
ALL THE BEST ..
Fibonacci Retracement
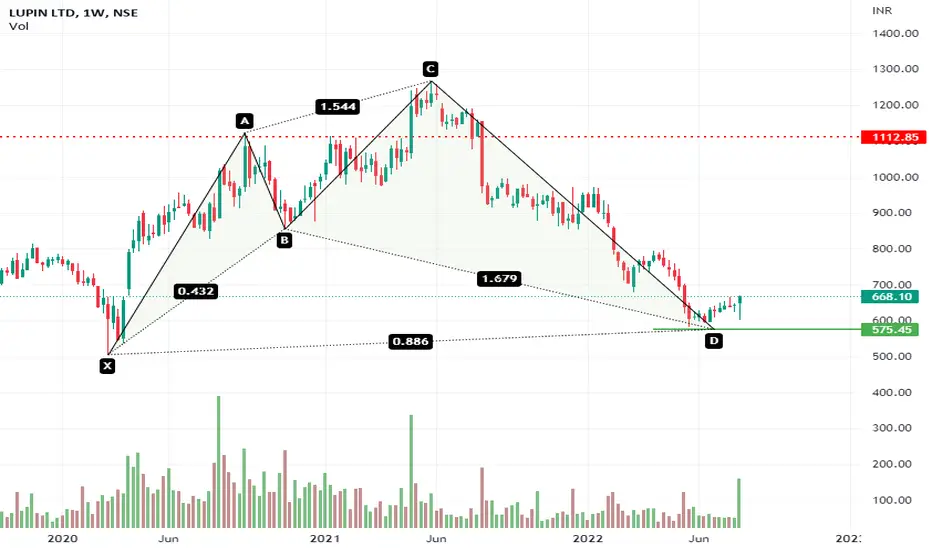
Lupin follows Cypher Bullish ??The given chart shows exactly reversed from D
How beautifully follows the Harmonic pattern
730, 844 are near expecting levels
The price may go further up depends on the pharma index
To learn more about harmonic chart, comment
Note: Information given here is for Study purpose
Bharti Airtel long opportunityNSE:BHARTIARTL
Stock -> Bharti Airtel
TimeFrame-> Weekly
Hello all!
Bharti Airtel has been moving in a channel since September 2019. It has been consolidating since August 2021 and is now back again at its lower trendline, thus making it a good opportunity to go long!
There are multiple other factors that strengthen my conviction:
- Along with the lower channel trendline, the stock is trading near its strong support zone.
-It has support from its 50-week EMA.
-The bounceback has come from
Tvs Updating the JackpotNSE: TVSMOTOR
Hello guys today after seeing the chart i got these things
1. If goes down then target could be taken at 1000 could be taken as a maximum target
2. Can be down as the Rsi Is also high and in the overbought zone
3. A Trend line is also showing to make a rising wedge and shows up also a sell signal
4. Time Frame :- ! Month
Conclusion :-
A resistance which is at the current level i have told some forecasts show that it could be down and could followed by the market also i also got th
Bitcoin daily chart on CME
Bitcoin daily chart on CME - we are in a weak bullish channel with a Doji Star on the red arrow giving the signal for the reversal.
At the moment falling to 2 possible prices 1- 22,190.00 dollars Fibo 61.8 of the last high leg and the other target is 21,095.00 which is the mejure move ABC.
Note we are close to the main bearish trendline. We can see this channel being a possible bearish flag setup.
When it hits this trendline, it can break up and go for $30,000.00 or it can fall and go for
Nifty is expecting to 17000 or 17230 before the next reverse !!The Harmonic charts are shown in the chart showing the expected levels
Out of three different Harmonic charts, two gives the same reverse point.
The EMAs are favor of current Bullish
Expected retracements are also shown
The data given here is for STUDY purpose.
Happiest Minds - Multibagger stocks BreakoutHappiest Minds is one of the fundamentally strong multi-bagger stocks, which has corrected nearly 50% from its all-time high of 1581. It is an IT company, ranked 4 in IT Services which works on disruptive technologies such as artificial intelligence, blockchain, cloud, digital process automation, internet of things, robotics/drones, security, virtual/augmented reality, etc.
Currently, it is trading at an attractive price. All possible targets are mentioned on the stock.
If everything remains th
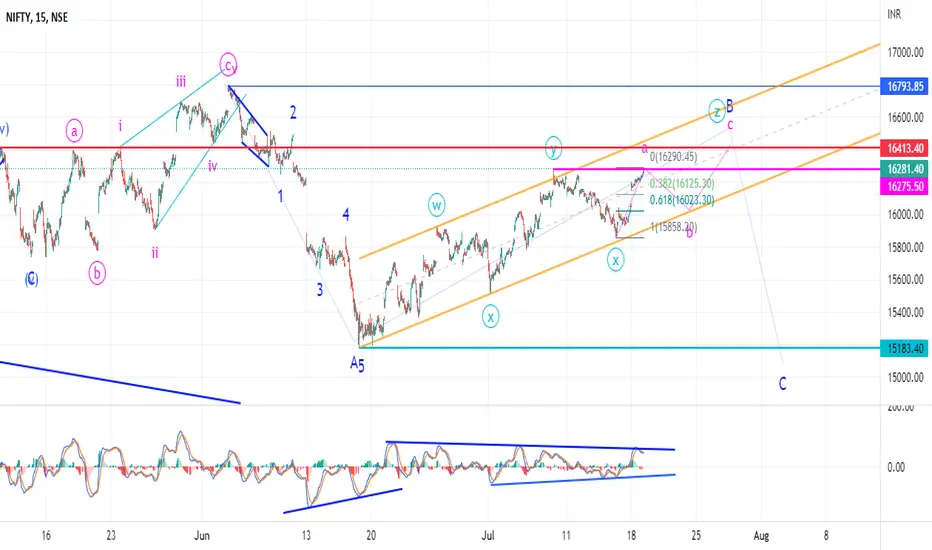
Nifty Wave Z of B in progressDetails on chart just for study purpose. Don't jump on trade in advance this is just forecast so relax.
In case Nifty breaks 0.618 Fibonacci and goes below 16000 then can consider dip started this has low probability.
DISCLAIMER:
There is no guarantee of profits or no exceptions from losses.
The stock and its levels discussed are solely the personal views of my research.
You are advised to rely on your judgement while investing/Trading decisions.
Seek help of your fina
ABB INDIA: POSITIVE UPTRENDNSE:ABB shows strong buy indicated by PSAR, MACD & Fisher crossover followed by EMA & MA Crossover
Target 2: 2470.75
Target 1: 2343.35
Stop Loss: 2142.60
๐ซ๐๐๐๐๐๐๐๐๐:
The analysis is only for illustration purposes only. Please consult your financial advisor, agent, broker before acting on any information. We may or may not have positions in the stock and our actions may be contrary to the one mentioned here. This analysis may or may not be updated. We would not be responsible for the profit/lo
HIKAL LTD: POSITIVE OUTLOOKNSE:HIKAL shows strong buy indicated by PSAR, MACD & Fisher crossover followed by EMA & MA Crossover
Target 2: 456.80
Target 1: 431.80
Stop Loss: 405.10
๐ซ๐๐๐๐๐๐๐๐๐:
The analysis is only for illustration purposes only. Please consult your financial advisor, agent, broker before acting on any information. We may or may not have positions in the stock and our actions may be contrary to the one mentioned here. This analysis may or may not be updated. We would not be responsible for the profit/loss
ADANI POWER: Upward trend startingNSE:ADANIPOWER shows strong buy indicated by RSI, IMI, MACD & Fisher crossover followed by EMA & MA Crossover
Target 1: 306.20
Stop Loss: 237.95
Disclaimer:
The analysis is only for illustration purposes only. Please consult your financial advisor, agent, broker before acting on any information. We may or may not have positions in the stock and our actions may be contrary to the one mentioned here. This analysis may or may not be updated. We would not be responsible for the profit/loss re
NTPC LTD: Strong BuyNSE:NTPC shows strong buy indicated by RSI, IMI, MACD & Fisher crossover followed by EMA & MA Crossover
Target 2: 175.60
Target 1: 154.90
Stop Loss: 140.50
Disclaimer:
The analysis is only for illustration purposes only. Please consult your financial advisor, agent, broker before acting on any information. We may or may not have positions in the stock and our actions may be contrary to the one mentioned here. This analysis may or may not be updated. We would not be responsible for the pro
This is the Reason , Why Nifty is Rising NSE: NIFTY
It can go Upto Fib Level :- 1.00 To Form a Double Top And then Down Or Up After Breaking it and taking up a Retest
Time Frame :- 1 Month
We are not responsible for any profit or loss
Based on Your Own Risk this is only to Show you the Current Pattern
Comment Below If You want to ask me questions on this on any other idea
BTW Like and Follow if you like this awesome content
Made By MAYANKTECHRESEARCHING
Index BreakoutIndex corrected 20% from top.
Strong support on lower level's.
Clear sign's of bottom formation and breakout is evident.
Falling Channel breakout and consolidation near breakout zone is giving strong confirmation.
MACD and Rsi too supportive.
Rally ahead.
Pullback's is excellent entry point's here on.