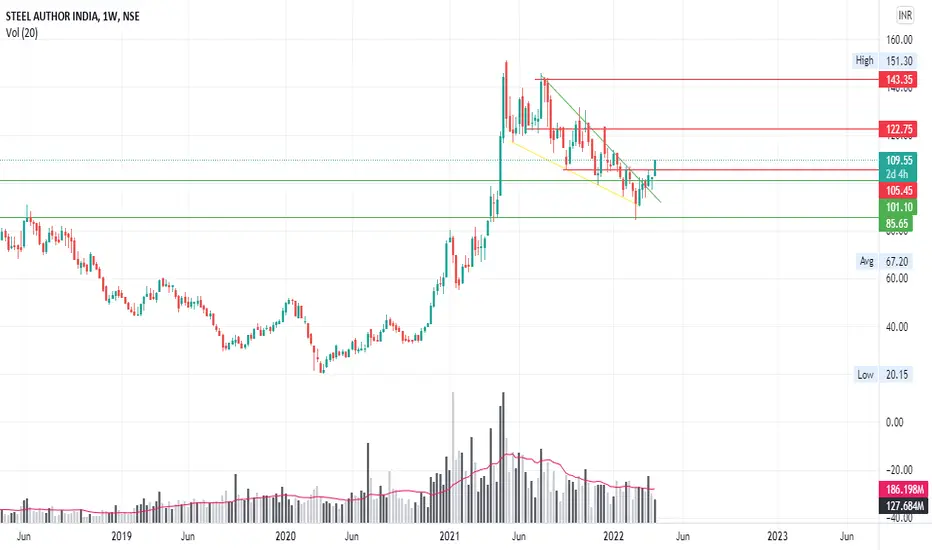
DABUR Long opportunityNSE:DABUR
Stock -> Dabur
TimeFrame -> Weekly
Hello all!
Dabur has been traveling in a channel since May 2017. It is now again at the lower end of the trendline and thus it makes for a good opportunity to go long from here!
There are multiple other factors apart from the usual price action:
1) Stock is in its support zone.
2) Stock has taken a bounce off of its weekly 200 EMA.
3) Stock has bounced off of its golden Fibonacci zone (not shown here as that would make the chart too complicated)
Fibonacci Retracement
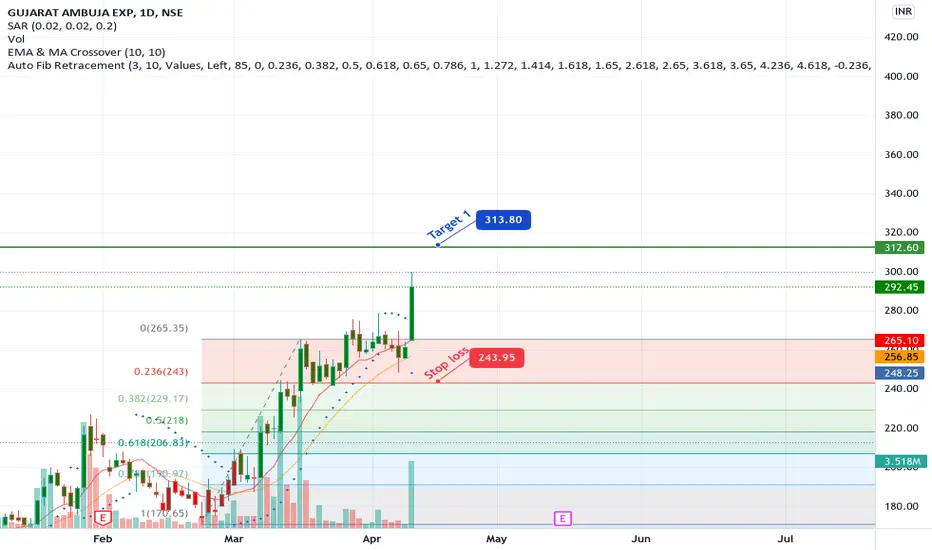
GUJARAT AMBUJA EXPORTS: Long term positive outlook NSE:GAEL shows strong buy indicated by PSAR, MACD & Fisher crossover followed by EMA & MA Crossover
Target 1: 313.80
Stop Loss: 243.95
𝑫𝒊𝒔𝒄𝒍𝒂𝒊𝒎𝒆𝒓:
The analysis is only for illustration purposes only. Please consult your financial advisor, agent, broker before acting on any information. We may or may not have positions in the stock and our actions may be contrary to the one mentioned here. This analysis may or may not be updated. We would not be responsible for the profit/loss resulting from
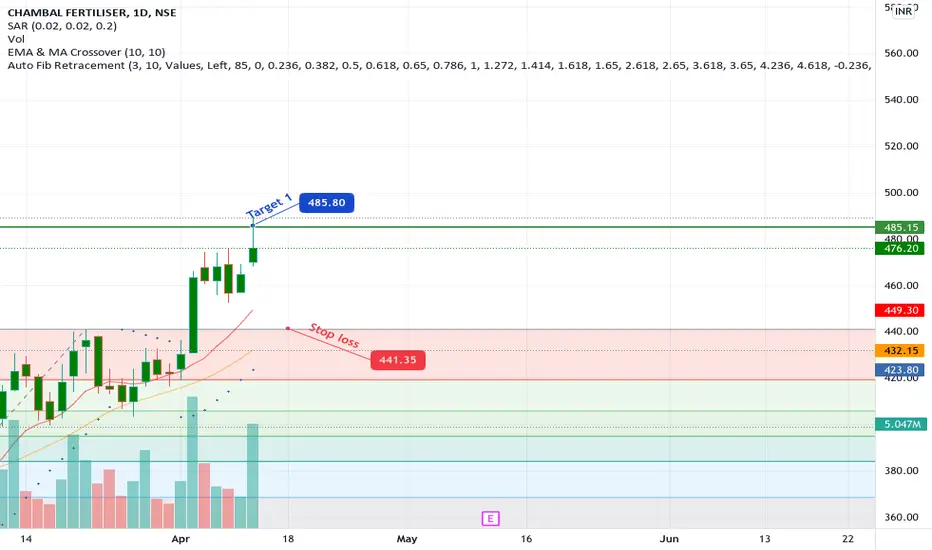
CHAMBAL FERTILISER : Long term positive outlookNSE:CHAMBLFERT shows strong buy indicated by PSAR, MACD & Fisher crossover followed by EMA & MA Crossover
Target 1: 485.80
Stop Loss: 441.35
𝑫𝒊𝒔𝒄𝒍𝒂𝒊𝒎𝒆𝒓:
The analysis is only for illustration purposes only. Please consult your financial advisor, agent, broker before acting on any information. We may or may not have positions in the stock and our actions may be contrary to the one mentioned here. This analysis may or may not be updated. We would not be responsible for the profit/loss resulting
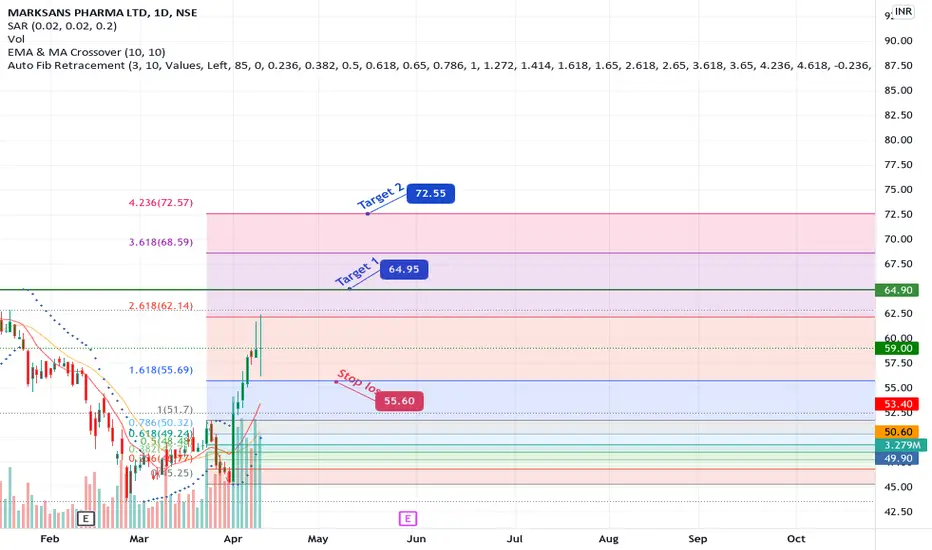
MARKSANS PHARMA LTD: Upward trend with good volumeNSE:MARKSANS shows strong buy indicated by PSAR, MACD & Fisher crossover followed by EMA & MA Crossover
Target 1: 72.55
Target 2: 64.95
Stop Loss: 55.60
𝑫𝒊𝒔𝒄𝒍𝒂𝒊𝒎𝒆𝒓:
The analysis is only for illustration purposes only. Please consult your financial advisor, agent, broker before acting on any information. We may or may not have positions in the stock and our actions may be contrary to the one mentioned here. This analysis may or may not be updated. We would not be responsible for the profit/los
L_TFH LongChannel breakout + Retest Done + 50% Fib retracement tested + RSI @ 56 = Good buy with a great R:R .
Don't buy asap ; wait for some duration as market has gone up without making a red day, so have patience and buy when price comes near buying zone.
Target 1 and 2 are easily achievable but Target 3 is a little hard so book 60% till tgt 2 and let the profits run for Tgt 3.
NSE:L_TFH
GOLD Gold retraced 61.8% of previous rise, it tooked support perfectly from 61.8% and lower bollinger band on daily time frame, and it had once again managed to hold above the RK's stop loss line on the closing basis, after taking support & closing that doji type red hammer candle, next candle closed positive and also given good follow up upwards, also buy signal generated in RK's Magic Buy.
Most possibly it is confirmation that reversal started now and may be wave ii completed and wave iii can unfo
GLong
Nifty Weekly Analysis - Fibonacci shows possible bearishness Nifty is finding resistance in the 17300-17350 zone and the one day it opened above 17400 it could not sustain and fell rapidly back to below 17300 levels.
The reason for this could be it is 61.8% retracement level of LH formed on 17351 (18 Jan) and LL of 15671 (8 Mar). Obviously this doesn't mean that NIfty could go down substantially from here. It could possibly make an U-turn and go upwards as well.
My view would be that Nifty could be forming a possible consolidation here before it resum
NIFTY getting ready for fresh DOWNSIDE.
Multiple confluence found which indicates break in nifty rally and possible reversal.
1. 90% fib retracement level found at 17600 in 4th wave which can act as major resistance from 10feb swing high.
2. 17600 is the level conferencing with divergence trend line which is a psychological round number.
3. Divergence is found on 15 min timeframe. look at RSI even if market reaches 17600 still divergence will be intact.
4. Triangle pattern is also seen so if market takes support from lower trend
Nifty 50 Daily Chart Analysis | Price ActionNifty is forming a cluster of both a supply zone and Fibonacci retracement level from 17320.20 to 17408.45. Nifty rejected cluster and close below that level on the Last trading day.
But if you look at the trend line, Nifty has broken the bearish trend. So it is difficult to know whether the market will respond to the cluster or break out of the trendline.
That's why the level from 1732.20 to 17408.45 will be important for us.
One can see Bullish run on its breakout and Bearish run on its reject
Nifty in complex wxyxz correction in progressNifty is expected to first drop as X wave then Z wave going to take it Up.
Downside expecting towards 17150 to 17050 which 0.382 fibonacci level of Y wave.
Z wave expected to end between 17800-18000 levels
DISCLAIMER:There is no guarantee of profits nor exceptions from losses.
Technical analysis provided on the chart is solely the personal views of my research.
You are advised to rely on your own judgments while taking any investing/Trading decisions.
Past performance is not an indicator of f
BankBarodaBankBaroda has posibly started an impulse towards north, recently it has retraced 61.8% of last rise, which we can say wave 2nd of some degree has been completed near 92 level, we can assume that now new impilse as a wave 3rd of some degree has been possibly started, which can show levels towards north upto 144 or more, trend indicators are also suggesting same, One can go long at current price or on any dips (if any ). On the way down 101 is now an immediate support and 90.75 is a major support
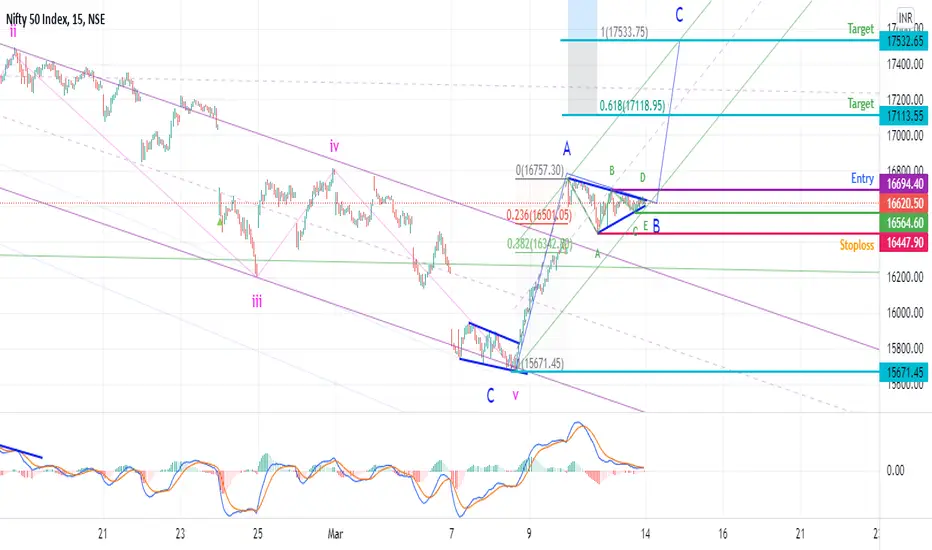
Nifty Wave B Triangle Consolidation 17k comingNifty came up sharp 1000 points from low of 16671 in just matter of 3 days.
Wave B looks to be triangle consolidation and has went max 0.236 fib retracement now to break it gap up opening needed.
Wave C minimum expected to go 0.618 Fibonacci extension then next 1 extension near 17500.
DISCLAIMER:
There is no guarantee of profits or no exceptions from losses.
The stock and its levels discussed are solely the personal views of my research.
You are advised to rely on you