HDFC Bank long opportunityNSE:HDFCBANK
Hello all!
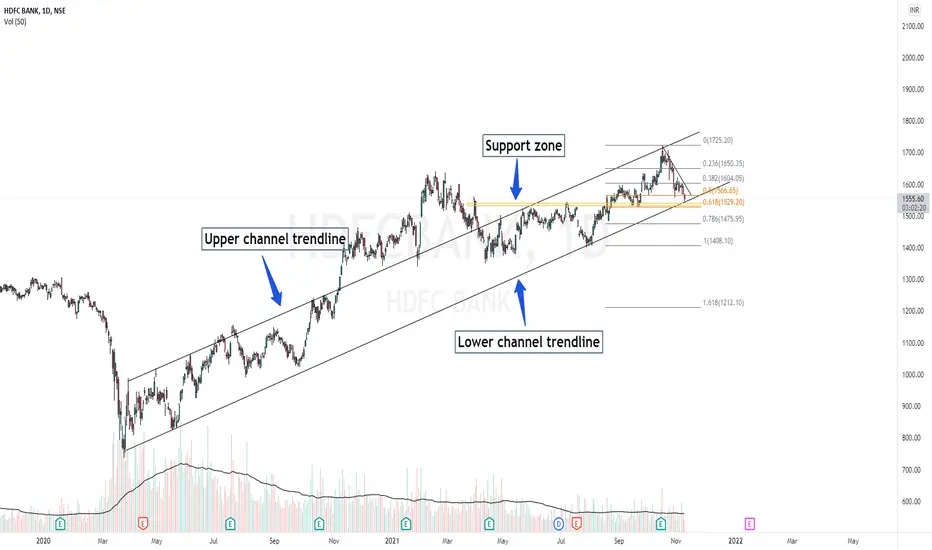
HDFC Bank has been trading in a channel since the covid crash. It's now on the lower channel trendline again which makes a good opportunity to go long because the stop loss will be very minimal.
Also, the stock is between its 50% and 61.8% Fib Level and is trading in a very important zone which acted as a strong resistance earlier and should now act as a good support
Do let me know your views on this!
HAPPY TRADING!
*NOT A CALL*
Fibonacci Retracement
HINDALCO: Forming Wolfe Wave In the process of Wolfe Wave formation. 450-440 is a very good accumulation zone. The reason is the 100 DMA , which has acted as a very strong support earlier and the Fibonacci retracement (Gann Level & Golden ratio level). Wait for it to respect the pattern and confirm a reversal.
Then the targets will be update in update idea section.
CHART & ANALYSIS - ADARSH DEY
AXIS BANK AT CRUCIAL SHORT TERM SUPPORTAXIS BANK: Looking at it through curved trendline, It seems to be at a crucial support an has the chances of rebounding for nearly around 4 -5% of return. Another confirmation would be 0.786 Retracement level of the previous trend. And after so huge fall expectation of a dead cat bounce is not at all superficial. The dual confirmation of curve Trendline and Retracement makes it a good bet.
Targets remains to be 779 and 799. Stop-loss would be below 740 on closing basis.
CHART & ANALYSIS BY
Inverted Head and Shoulder in Hindpetro.Stock has been in a down trend since june and was not able to give a break out. Price has tested the resistance zone 3 times and now is the fourth time it is trying to break. And during this process an inverted head and shoulder pattern is formed on the price chart. As we know that it is a reversal chart pattern, and we can see an upmove from here if price successfully breaks above the neckline and sustain there. From here if demand comes, we can see a huge breakout with above average volume, we
PAPER INDUSTRIES MAY GIVE RALLYJK PAPER : Currently this is trapped in rectangular pattern consolidation. The upper ceiling stands to be at 253 and lower support is 218. It has been range bound with in this range. Recently it is testing 220*4 HRS Moving average. Previously the up move came after it tested 220*4 HRS Moving average. And hopefully we will see a good up move from now onwards, the SL remains to be at below 218 on closing basis.
SESHAPAPER :
This stock is taking support at 200 DMA and in bullish continuation pat
DEN NETWORKS LTDThis company is fundamentally not so annoying, the financial performance is above industrial median. Currently it seems to be really interesting at this point of time on Weekly TF.There are some key points we need to watch:
1. There was a Bearish Wolfe Wave that started forming in early 2016. And the 5th wave of the same was completed in covid pandemic. After the formation was completed the stock soared up to complete the pattern.
2. The stock completed the expected target and then started comi
SBIN took support at 20 EMA…SBIN took support at 20 EMA…
Reasons/Traits :
• Took support at 0.382 fib retracement level
• Above 20 EMA
• Strong up move, force index 3 is less than 0 and force index 13 is greater than 0
• ADX 20 is greater than ADX 30 as well ADX DI + > ADX DI -
• Force index 3 is greater than 0 and Force index 13 is less than 0
• VWMA is greater than 100
What can happen next :
Scenario 1 : Price sustaining above 492 levels can take it to 500/510/520/530/540 levels (3.618 fib retracement of last high high
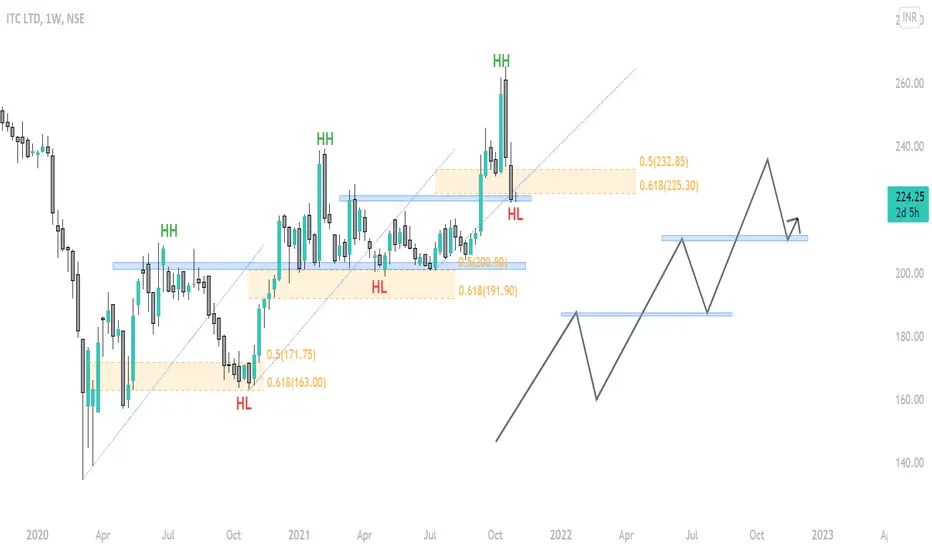
ITC - Perfect bounce from golden fib levels !Category: Fibonacci Retracement
Key Highlights:
1. Bullish market structure making HH-HL pattern.
2. Price taking support from one of the key zone levels.
3. Bullish volume is higher and weak non-patient hands are getting out.
Disclaimer: This is NOT investment advice. This chart is meant for learning purposes only. Invest your capital at your own risk.
Abhishek Singh (@Abhishek_TradersSin)
~ Middle-class IT Employee trying to simplify Technical Analysis.
~ Do follow and like if you like the
UltraTech Cement : AnalysisAs per the price Pattern and fib levels market seems to be bullish. As per entry levels Ultratech is at support levels and shown a green candle today.
Their are two possibilities:
1) It will break the trend line and start moving up OR
2) It will consolidate near blue zone shown in the graph.
As per present market nifty seems to be very bullish hence possibility of breaking up is good.
Safe trade would be to wait for Trend line breakout and Retracement. Once if give good conformation and entr
NMDC - Multiple CONFIRMATIONSNMDC Current STRUCTURE- Rounding Bottom Breakout + RETEST
MULTIPLE CONFIRMATIONS :-
* Volume Expansion - Volumes since the last three months have been huge and continuously expanding
* RSI bullish Divergence- NMDC is forming flat bottoms whereas RSI is forming Lower Highs which is contradicting hence we listen to what RSI is doing and this is an early signal of a reversal that can be expected really soon!
* At The Golden Fib Zone b/w 0.618 & 0.5- We plot Fibonacci retracement and we see it
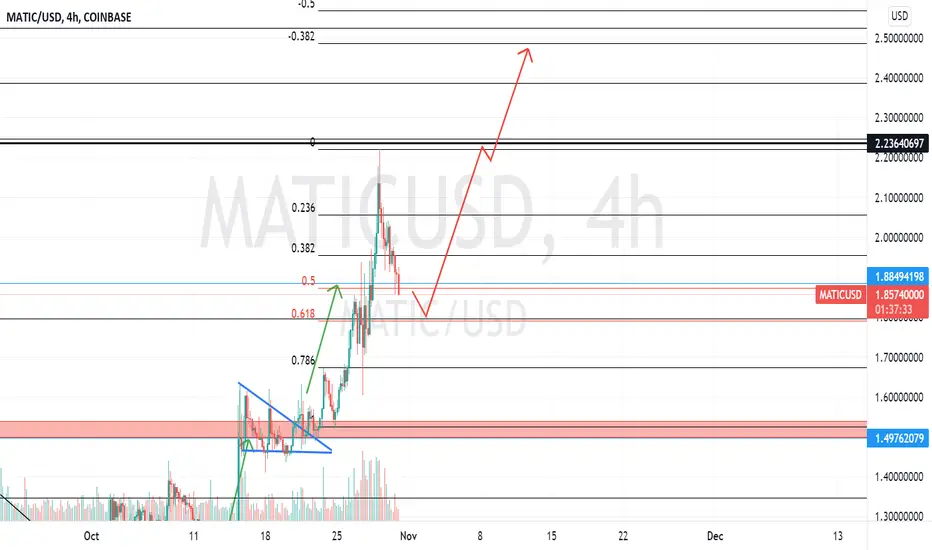
MATIC in buying zone!!!Matic has been pumping 14-15% daily for quite a few days now. It is making a higher low right now. It might get retraced from the Golden Zone of the Fibonacci!
MLong
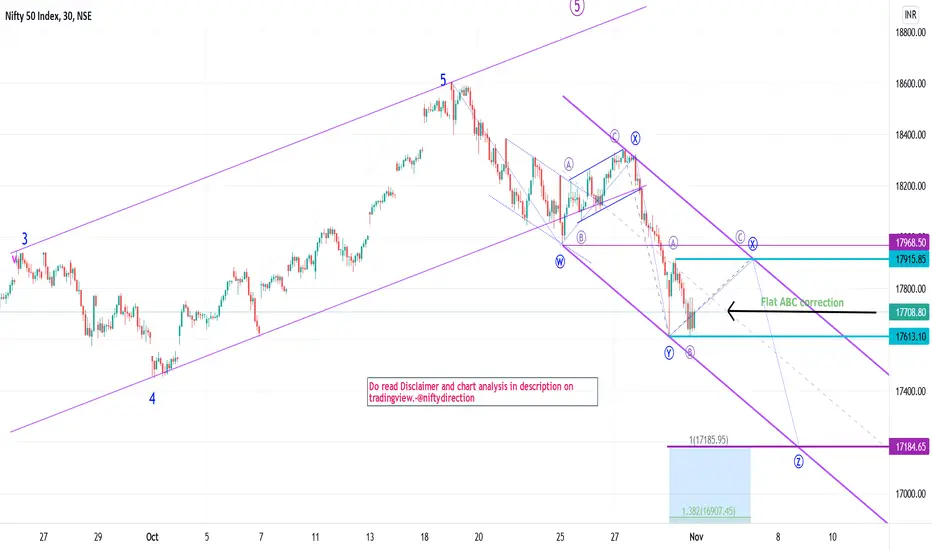
Nifty Flat Elliott Wave corretion ahead before final fallNifty after going continuously up taking breather.
Currently in triple zig-zag correction of which XX wave in progress which is expected to be flat till 17915-70 levels.
The last correction wave is suppose to end near 17180 if we consider nifty starts drop from 17915.
Z wave targets will change based on where flat ABC (or XX) end.
Off course bounce is expected on upside from 17200 odd levels
DISCLAIMER:There is no guarantee of profits nor exceptions from losses.
Technical analysis provided
HCL TechHCL Tech
Reasons/Traits :
• Bullish Gartley harmonic pattern is forming (gets confirmed if price goes and stays below 1254)
• Price below 13 EMA ready to touch 50 EMA
• Price is below 0.236 retracements levels
• RSI falling
What can happen next :
Scenario 1 : Price sustaining above 1265 levels can take it to 1285/1335/1365/1400 levels
Scenario 2 : Price break down below 1254 levels can take it down to 1227/1182/1135/1070/980 levels
Disclaimer : This analysis is only for educational purpose
NIFTY OUTLOOKIn the previous post of NIFTY OUTLOOK the weekly target and support was given and alarm for cautiousness was updated. The target was missed by a small margin and as expected NIFTY came rolling down. But the weekly support was not broken and respected Dot to Dot . In-fact a Bullish Wolfe Wave was formed at support which was even updated when nifty was at its bottom. ( The link is mentioned below )
The target was mentioned as 18310 which was even achieved and a downside reversal was seen. So
NIFTY OUTLOOKThe previous week targets and supports were respected dot to dot. The upcoming week is expected to be good but cautiously. The expected target for the upcoming week is 18800 levels once it crosses the black TL drawn. Why the level is so important because it is a cluster point of the COVID downtrend and FEB –APR 2021 downtrend. The weekly support level is 17947.65.
I am really sorry,unable to explain properly this time due to busy weekend. Rest all detailed explanation will be updated daily in