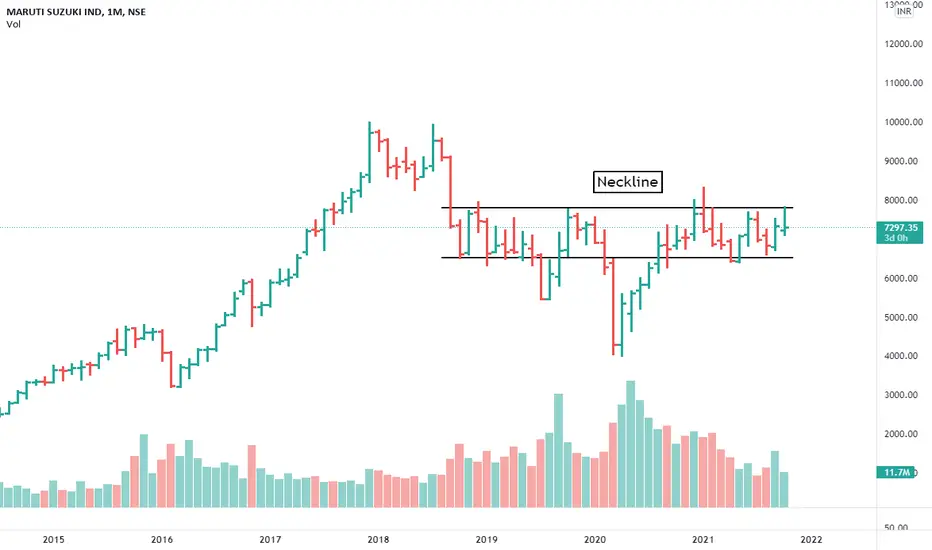
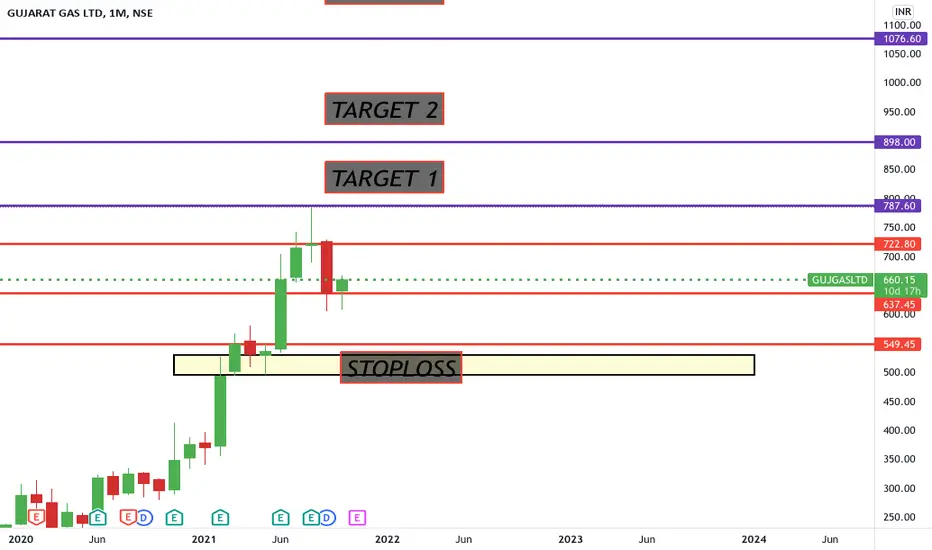
Maruti Readying for a big moveThere is a strong resistance at 7800-8000. Maruti has has struggled since a year 2018 to cross it. From all time high resistance is just 20% down. on the lower end 6500 is the support year. Twice it broke down on lower time frames but failed to do so on monthly chart. In first breakdown price returned in 7800-6500 band in next candle & in march owing to severity of fall it took more candles return in the mentioned band, there was no follow up selling. This 1300 Rs band on monthly time frame sho
Fibonacci Retracement
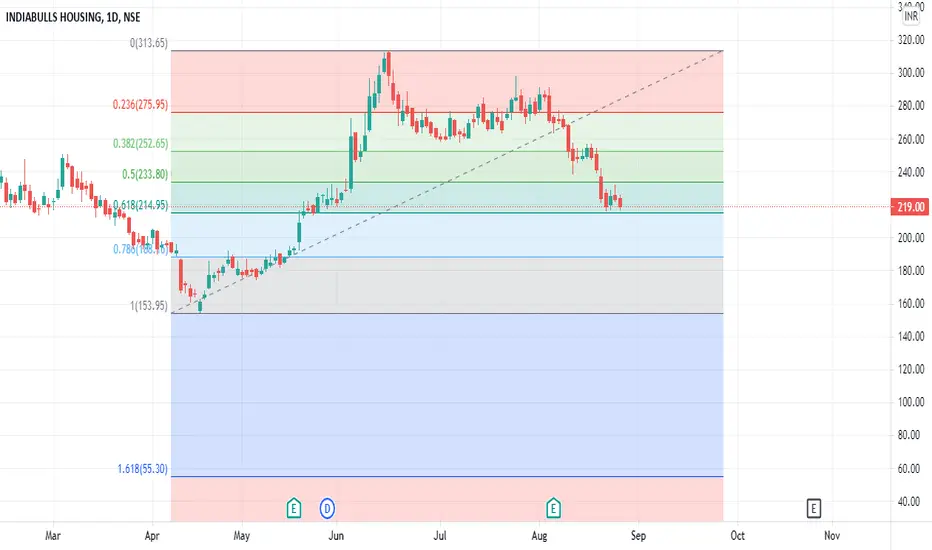
IndiaBulls Housing FinanceIndiaBulls Housing Finance - Chart Setup
Upside:
T1 - 234
T2 - 252
T3 - 312
Can see a bounce back from 214.95 it seems to be a strong support.
if 214.95 levels is breached we can se further downfall to the levels of 185-188
I
Expected correction in united spirits (McDowell) up to 780 levelwave 2 is between 0.786 and 0.618 level of wave 1.
wave 3 is exactly 1.618 times of wave 1.
wave 4 started from 925 level, according to elliot wave theory it should retrace upto 780 levels.
Which provides us with a good shorting opportunity.
For additional confluence:- divergance spotted in MFI indicator (oscillator is making lower high but stock is making higher high). Look from mid august to 2nd week of sept.
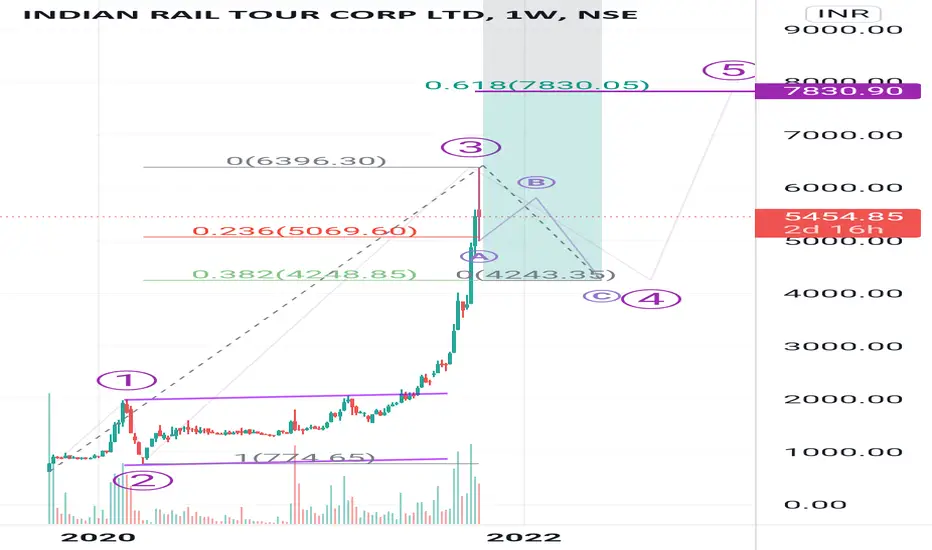
IRCTC Next Move projections with Elliott waves and FibonacciIRCTC witnessed massive drop hitting 2 circuits.
The drop took it to 0.236 fibonacci retracement levels.
Assuming todays drop as Wave A next consolidation as wave B and see some pullback it could be till 5800.
Wave C should drop towards 0.382 fibonacci levels.
This ABC correction move should suck and digest all the rally it made so far then next Upmove as wave 5 should be slow up.
DISCLAIMER:There is no guarantee of profits nor exceptions from losses.
Technical analysis provided on the
IOTX idea updateIOTX has been forming a triangle again. It didn't respect the previous triangle. Now it has been forming a new triangle and a channel. If it breaks out from above, it might touch the 0.08 USDT price level. If it breaks out from below, it might go till 0.04 USDT. Sorry for a messy chart!
GLong
GULF PETROSeems Bullish as it is trying to initiate 5th Wave. It has fantastically taken support at Golden ratio(0.618) of Wave 3rd, so it can be hoped that 4th wave formation has been completed. The expected targets are 61.90-68.75 - Long term target is 83.50.
Currently this stock is in triangle pattern once it breaks out it will easily achieve the target of 61.90, remaining two targets needs a mid term to long term view.
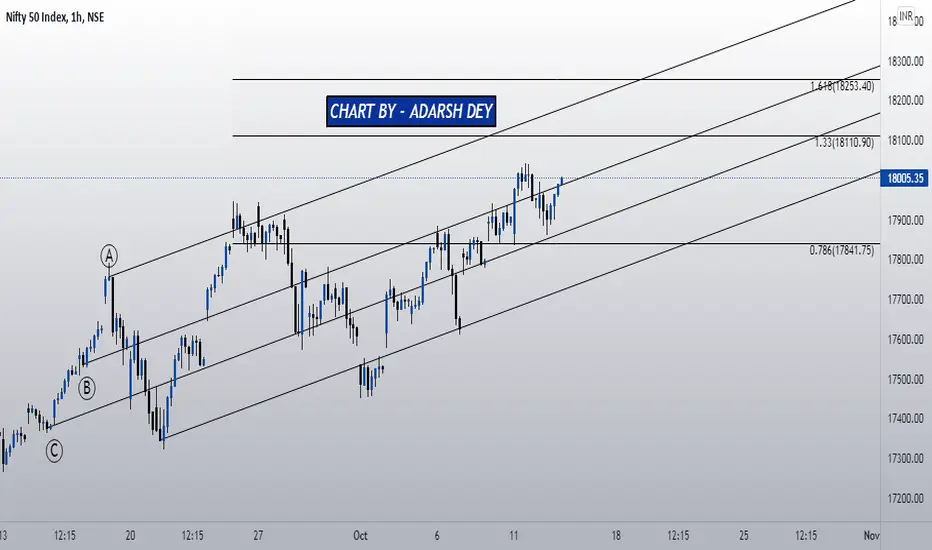
Chart & Analysis By - ADARSH DEY
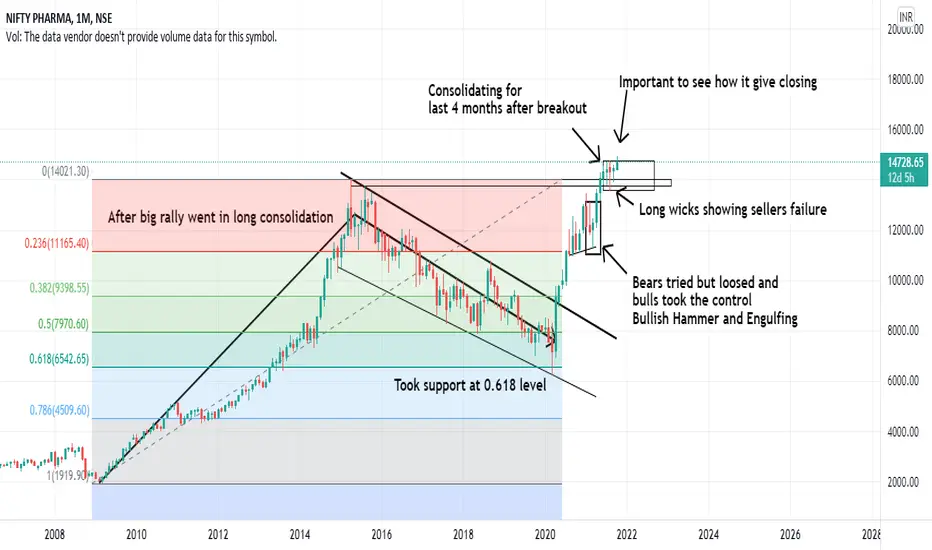
NIfty Pharma on Bigger TimeframeNifty Pharma index started it's rally after the 2008 crash and top out in 2015.
Then it went for a long consolidation till 2020.
After analyzing retracement with fibonacci levels I saw that it had took support on 0.618 level and again showed a bullish up move.
It crossed it's all time high recently in 2021.
Before crossing, sellers tried to change trend but failed and buyers took control lead to forming a bullish hammer and engulfing candle which confirmed a strong rejection.
After breakout, fo
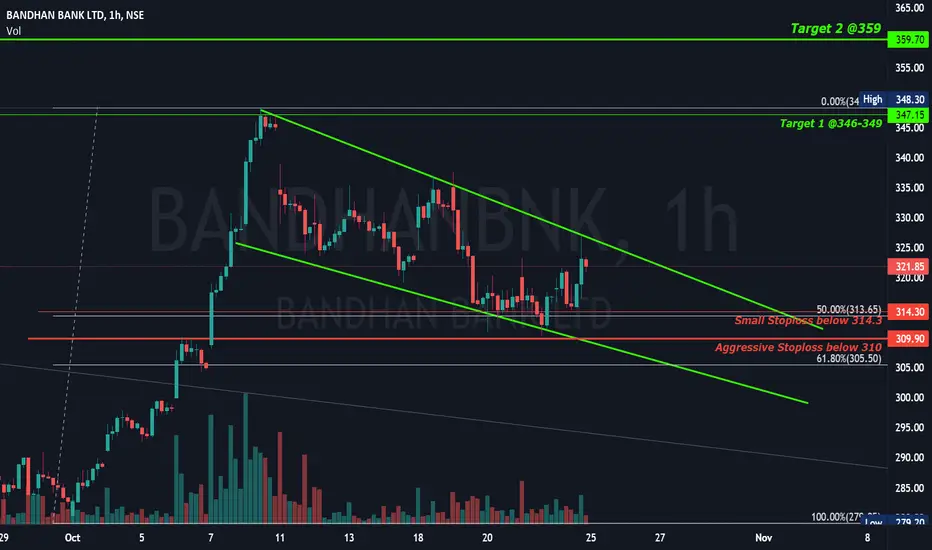
Bandhan Bank ready to explode? Perfect Fib Setup 0.5 and 0.618 in Fibonacci is a golden zone from where price retraces so here Bandhan bank was following a trendline so to predict that pullback we used fib! We plotted Fibonacci from 165 to 423 (uptrend) and if we observe the reaction to our golden zone we can see it is a very important key zone. It broke out of Falling wedge with a nice breakout with good volumes. Since it gave a nice move after breakout so we need a minor pullback and that can happen if the price retests but 295 fib level is
NIFTY OUTLOOKPrevious NIFTY OUTLOOK post was an indication for the Expected Bullishness. No surprise NIFTY didn't disappointed at all.
For 11th OCT the mentioned support level was 17841 and NIFTY shooted up exactly from the mentioned level.
For 12th OCT the mentioned support level was 17863.50 and NIFTY shooted up from the almost the same dot to dot level .
Link to my previous idea if any ones wants to study or verify:
As the NIFTY has closed above trendline "B" now the previous mentioned targets the GA
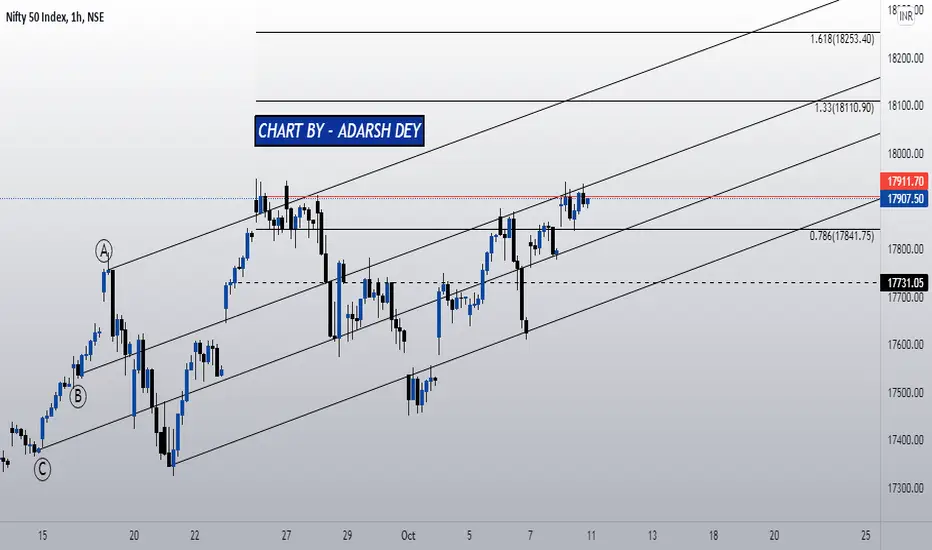
NIFTY OUTLOOKDrawing the TL (trendline) is really important. It gives you a hypothetical idea about which & what way the certain stock or index is heading.This is an hourly TF chart of NIFTY . I have segregated the trend in to four parts by plotting the trendline A,B,C,D.The last line ie D is the major support in short term. In terms of price the support stands to be at 17731.
BRIEF ABOUT CURRENT SCENARIO :
Currently NIFTY is taking TL "B" as resistance and even it's all time high as resistance (focus on t