Fibonacci Retracement
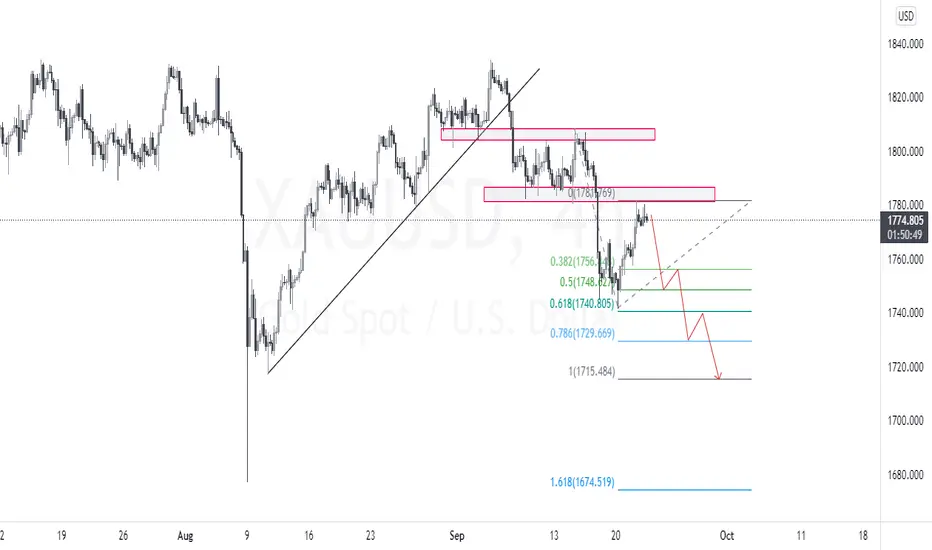
XAUUSD (GOLD) Sell Setup (Target Range 500 Pips)Pair Name : XAUUSD (GOLD)
TimeFrame : 4Hrs
Direction : Short
Type : Swing
Target Range : 500 Pips
-------------------------------------------------------------------------
Neat and clean chart with clear setup, no junk on chart.
-------------------------------------------------------------------------
If you like this idea, then smash like button and follow us for regular updates.
-------------------------------------------------------------------------
Note:- Do you own due diligence before ta
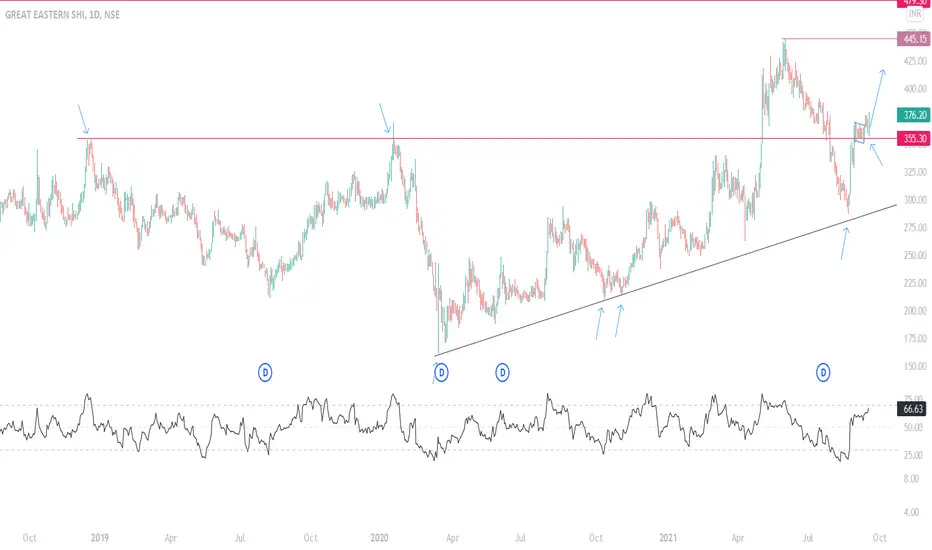
GESHIPPING Bouncing off at SupportGESHIPPING has formed flag structure at the support/resistance zone of 375 and has broken out of the flag. Also, this zone was previous resistance and has acted as decent support this time. 375 zone is also the 61.8 Fibonacci zone of the bigger range. The stock has found support at confluence of multiple technical indicators and has exhibited bullish candle with volume on Friday, 17 Sep. We are bullish on the stock and can expect it to touch previous highs of 440 and ATH of 480.
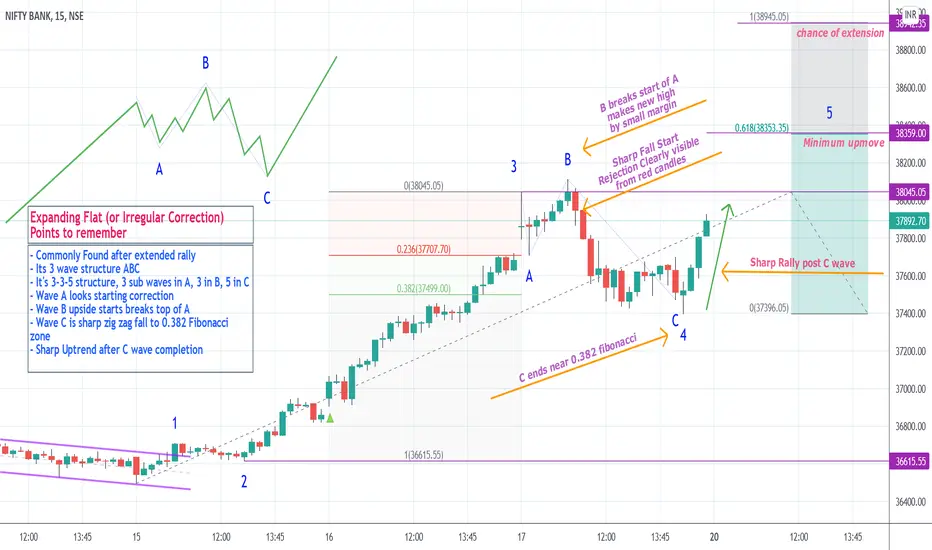
Expanded Flat or Irregular Correction IdentificationMost common found pattern. Its temporary pause to extended rally.
Key to identify this pattern is rejection after breaking wave A start.
Always look for very smaller margin rise above start of wave A.
C wave is sharp fall to reach 0.382 Fibonacci retracement of rally.
All other details explained in chart. Comment your doubts.
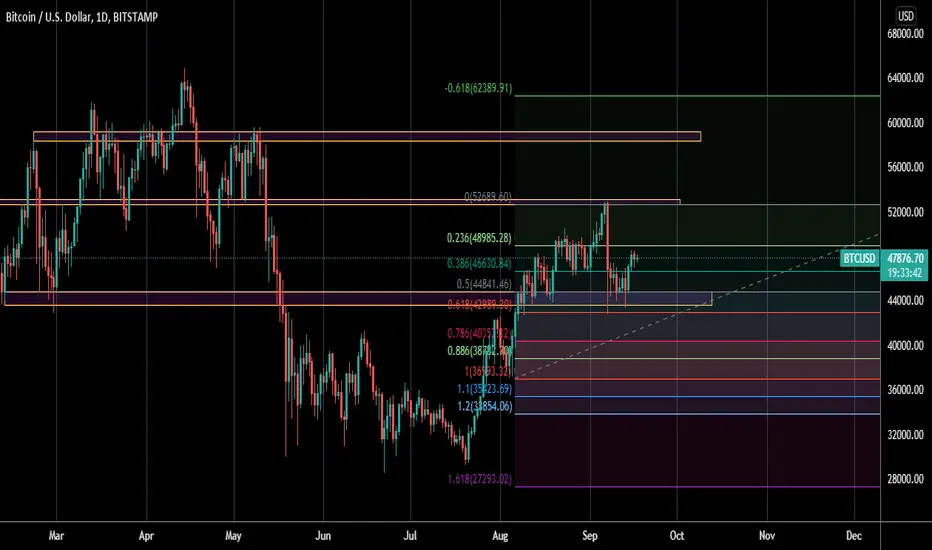
BTC BUY 1. Cassure et reste du niveau cassé + théorie de Dow
2. Niveau 61.8 fibo rejeter
3. SL niveau Fibo 0.786
4.Tp 1 les 52 000
5.Tp 2 extention Fibo : 0.618 ou les 60K
Attention on fait attention à la lecture du volume lors de l'approche des 52k pour ceux qui visent les 60k ou le niveau de Fibo extension 0.618
Attention à votre money management (actif hyper volatile)
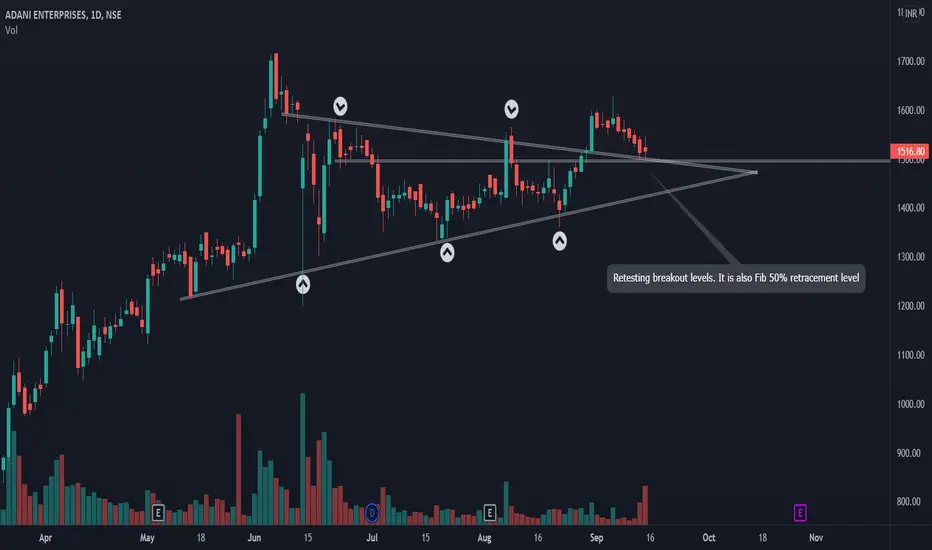
ADANIENT : Swing trading opportunity!NSE:ADANIENT has given a breakout of symmetrical triangle pattern and currently retraced to its breakout level. The stock has also taken confluence of support from previous resistance level and Fibonacci 50% retracement level. The stock looks good at CMP with minimal stop loss and maximum reward. This is a little risky bet but looks good to me. If you notice the stock has also formed kind of W pattern.
DISCLAIMER : This is not a call. The analysis shared is just for educational purpose. Please
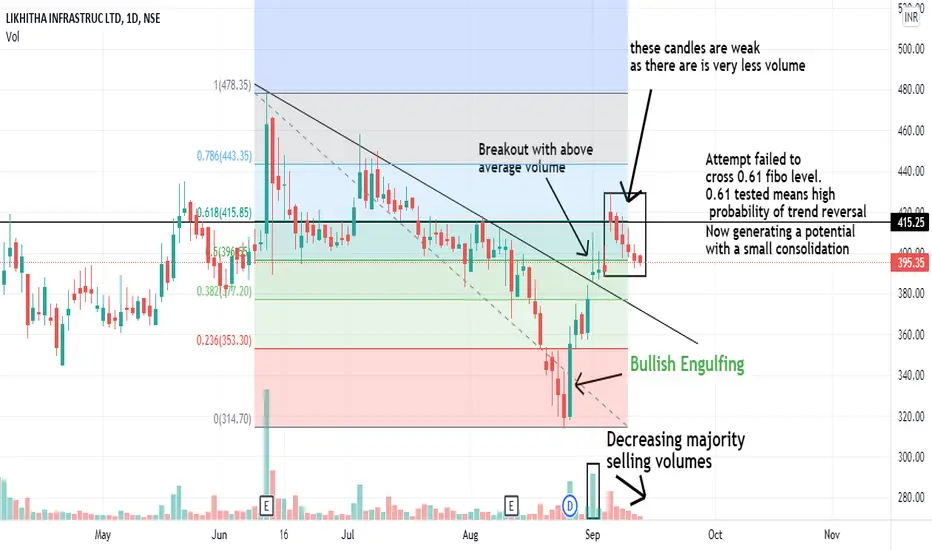
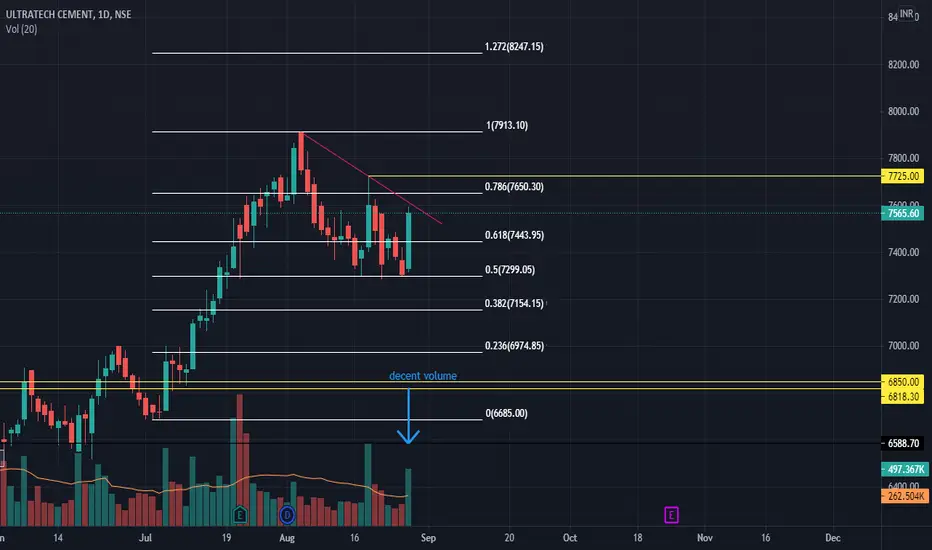
Price Action and Fibo SetupStock have given breakout with above avg. volume.
The candles which have formed in last few sessions are bearish
but looks weaker as there is continues decrease in volumes.
This means sellers are not that powerful at these levels now.
While using Fibonacci, applying top to bottom, I see that it have tested 0.61 level.
Which means there's high probability of trend reversal.
Yes, it's strong fibo resistance and hard to break it with first attempt.
It did took resistance and now retraced.
This sm
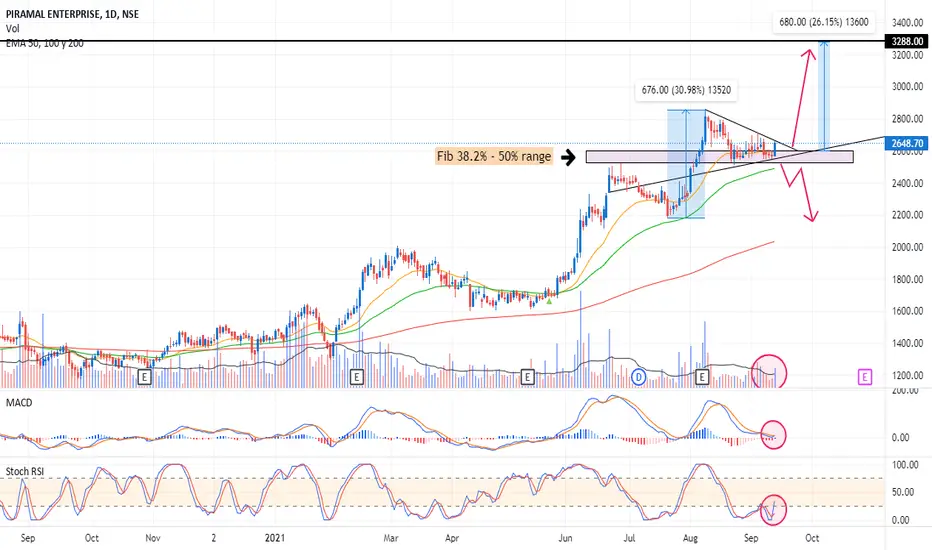
PEL swing tradePrice has been consolidating around the 38.2% - 50% fib range/ 21 and 50 ema. It has even formed a triangle pattern. MACD and Stochastic RSI are signaling buy. A strong close above 2700 would be a good buy confirmation.
PLong
Strong breakout and retestStock broke out from multiyear resistance zone and now trending in blue sky zone beautifull retest of breakout & now stock will start its upward journey. Always Do your own research before investing
CLong
DLF: Chart view and trading strategyDLF
Observations
- Stock has done a 76.4% retracement of the fall from 359.25 to 303 levels
Given the set up one may consider to sell DLF
F&O strategy
Consider Bearish Call spread
Sell DLF 350 Call option around 11
Buy DLF 370 Call option around 5
Net receivables in strategy 19800/- per strategy lot (yield potential around 20% till expiry)
Be cautious if DLF closes above 346
The strategy has Inbuilt loss protection for a rise up to 356 till expiry
Take care & safe trading..!!!
D
BEST PLACES TO LOOK FOR HIGH PROBABILITY TRADESHere are a few setups that I use in my day to day trading. They work well in all the timeframes and in all types of markets.
I am only showing bullish scenarios due to space constraint but one may also look for bearish scenarios which work in the same manner. Like Down trendline or Downward sloping channel; downward sloping MA; breakdown of a range; and price retracement back up to 50% of the down move.
Sometimes these setups also work in collaboration with each other. Like price pulls back to
TATA COFFEE - Channel Breakout. NSE:TATACOFFEE
TATA Coffee has given a breakout. Buy above 220 for target of 240.
TLong
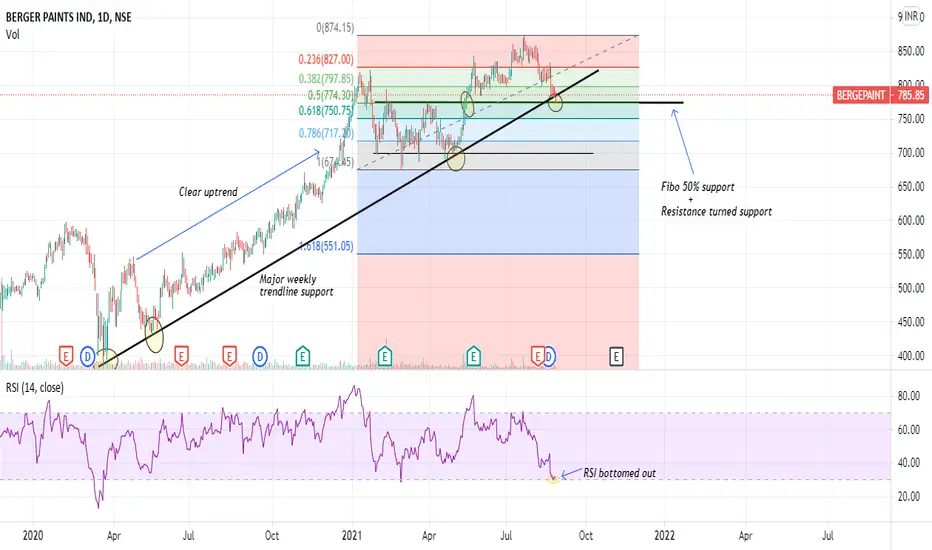
QUICK AND DILIGENT ANALYSIS ON BERGER PAINTS !!!Notable points:
1.Stock is taking support at major weekly trendline support area, also same zone is a previous resistance which turned into support now.
2.The stock is at 50% fibo support and seeing some buying interest with formation long lower wick candle at the support.
3.The stock is almost bottomed out in RSI , thus can expect a bounce from this area.
4.The stock was in a decent uptrend and did a long consolidation therefore probability of bounce from major weekly trendline support is high.
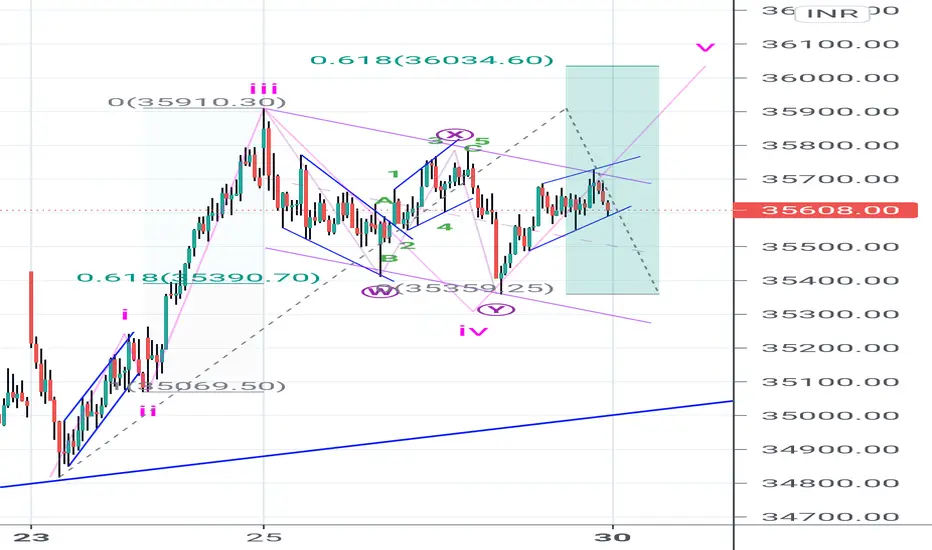
Banknifty towards 36k in wave 5Wave iv was complex wxy correction and found support 0.618 fibonacci level of wave iii.
Wave targets 0.618 of wave i+iii 36034
DISCLAIMER:There is no guarantee of profits or no exceptions from losses. The study provided is solely the personal views of my research. You are advised to rely on your judgment while investing/Trading decisions. Past performance is not an indicator of future returns. Investment is subject to market risks. Seek help of your financial advisors before investing/trading.
NIFTYMETAL/NIFTY Bounces from 31.8 Fibonacci Retracement ZoneNIFTYMETAL/NIFTY ratio chart is exhibiting retracement from its pullback from last highs. The ratio has shown successful retracement toward 0.318 Fib level and seems to have successfully bounced from that level. This is bullish development for the metal stocks in the coming weeks. We may see the price going back to the previous high and beyond.
Tatamotors Flag and Wave 3 start Good Risk Reward ratioTatamotors Came Up from recent low with heavy volume.
Retracement happened near 0.382 fibonacci levels 281
Looking Good for start of Wave 3 towards 315 as 1.618 fibonacci extension
DISCLAIMER:There is no guarantee of profits or no exceptions from losses. The study provided is solely the personal views of my research. You are advised to rely on your judgment while investing/Trading decisions. Past performance is not an indicator of future returns. Investment is subject to market risks. Seek help