Godrej Properties Positional Trade Setup For Tuesday (13th July)As you see in the Godrej Properties stock Fibonacci Retracement has happened in the previous day.
.
And same thing in last one week, after touching 1540, it retraced the level of .5.
.
Now tomorrow we can take the positional trade, once it cross the level of 1540.
.
Then 1560-1590 is out Targets.
.
What's your view on this comment below in the box.
Fibonacci Retracement
Want 30% mover then watch this 10min video - Analysis made easy👑 Drop a follow here: @Averoy_Apoorv_Analysis 👑 ----------------------- 🔥🔥 Target: 2000 Followers 🔥🔥
👑 ITs a very good analysis video as I will try to trade this in realtime with you guys of course risk is diff for diff people but trading quality matters, not quantity :)
Good luck keep it in your watch now
⌛ Motivational and psychological area ⌛
✣Trade only if you are in the right mindset, if you have been emotionally weak for some time, take your time and don't trade, trade with a happy an
SLong
CEBBCO LONGChart is self explanatory.
Trail Stop loss
FOLLOW IF YOU LIKE THE ANALYSIS
LIKE AND COMMENT WHAT YOU THINK ABOUT IT!!
CLong
#KALYANKJIL .. A Broader Perspective on the price actionPlease see the chart for my perspective and interpretation of the price action for Kalyan Jewellers stock.
With this post, I am trying to adopt a more explanatory approach towards my analysis along with an attempt to make charts more visually appealing and clutter-free.
For any feedback about the analysis or the presentation, feel free to drop a comment below.
If you agree with my assessment please like my post.
And it goes without saying but follow me for more stock ideas.
#AFFLE .. This may be an opportunity to buy for 30%There is a sharp recovery from the 78.6% fib retracement level and now stock is hovering around 61.8% retracement levels..
Open position when price closes with a green (preferably long with volumes) bullish candle above 4600, can be easy 30% from here
Intermediate targets are marked too. Fo SL use 4450
Patience will give 10% in SAIL 👑 Drop a follow here: @Averoy_Apoorv_Analysis 👑 ----------------------- 🔥🔥 Target: 1000 Followers 🔥🔥
🔥 Strategy :
✣ Channel pattern breakout on 1M chart
✣ Good monthly consolidation and weekly too
✣ On a weekly basis good retracement of 30% multiple times tested near that level
✣ Good triangle pattern on 1hr and 1d both ( Trade on TF whichever suits your setup and RR ratio )
✣ In 1hr you can take it on a lower trendline for a low-risk high reward setup or on a breakout, SL as per your risk an
All you need to know about RELIANCE in 6 minutes 🔥👑 Drop a follow here: @Averoy_Apoorv_Analysis 👑 ----------------------- 🔥🔥 Target: 1000 Followers 🔥🔥
🔥 Common sense used: If you want to know the details of the trade I have posted a picture too of the same analysis with all its parameters defined well in description of that post, do check out that post its linked at the bottom of this post :) just for perfect level and entry, SL number wise :)
⌛ Motivational and psychological area ⌛
✣Trade only if you are in the right mindset, if you have
How to get 12% using Swing trading in HONAUT - Common sense👑 Drop a follow here: @Averoy_Apoorv_Analysis 👑 ----------------------- 🔥🔥 Target: 1000 Followers 🔥🔥
🔥 Common sense used :
📌 Weekly time frame: Make 2 fib from 2 different from one will give you 30% retracement of price and one will give 50% - a sign of extreme bullishness
📌 The supply zone is broken and now converted into a demand zone on those bullish levels as described in the video
📌 Beautiful wedge pattern breakout did and kind of retested too made a bullish closing last Friday too
📌 on
Nifty Zig Zag Correction possible X wave towards 15800Nifty formed today falling wedge pattern after few hours opening. This is also called ending diagonal appearing in wave 5 or C wave.
Wedge broken channel price was thrown under channel made low 15637.
Entire ABC move from 15916 completed near 15637.
Wedge had confirmed upside with 15688 breakout point.
Today it completed A wave of correction going up to 15710 then B was down to 15665
Currently C wave started expected to go towards 15808 or 0.618 Fibonacci retracement of move 15916-15637.
Mo
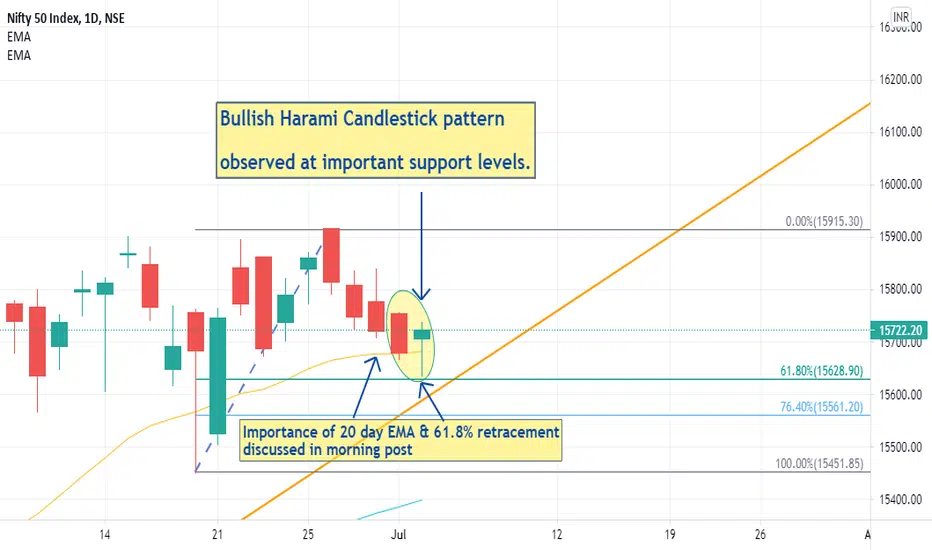
Nifty: Bullish Harami Candlestick pattern observed near SupportNifty
In morning post, the importance of 20 day EMA at 15677 and 61.8% retracement around 15628 was discussed and so was the level of 15735
Nifty respected all the levels very well ( 20 day EMA on closing basis, 61.8% retracement on intraday low basis and 15738 was the high for the day)😊
- Today's closing also reflects a Bullish Harami candlestick pattern which opens up doors for some upside move
(initial targets on Nifty 15804 / 15840 and further upside if closing is above 15865)
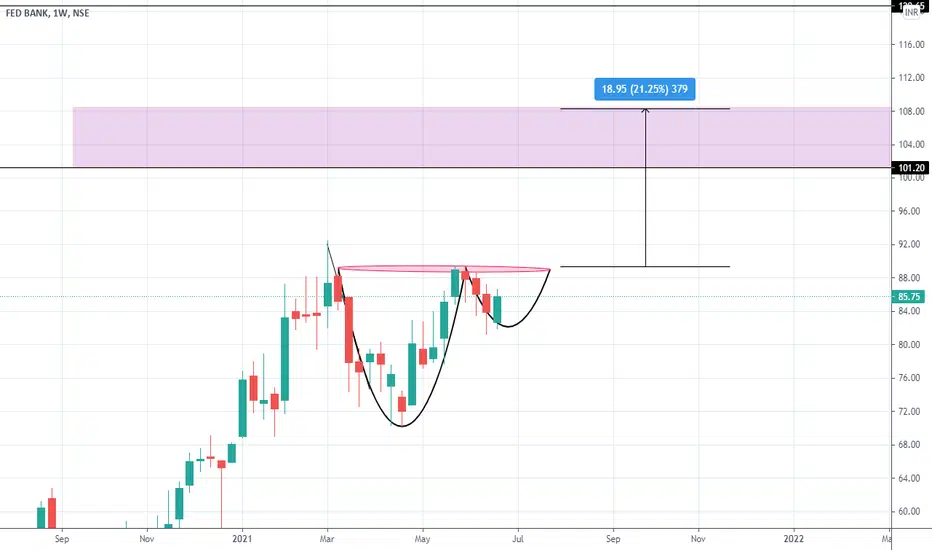
CUP & HANDLE PATTERN ANALYSIS 28.06.2021BUY : 85 TO 82
TARGET : 101 TO 108
Reason For Buying This Script :
In this script it has formed cup & handle formation in weekly time frame , So we can go for buy .
Note :
Above given levels are based on monthly & weekly time frame . So be patience it will take some days to achieve the target.
ALL THE BEST ..
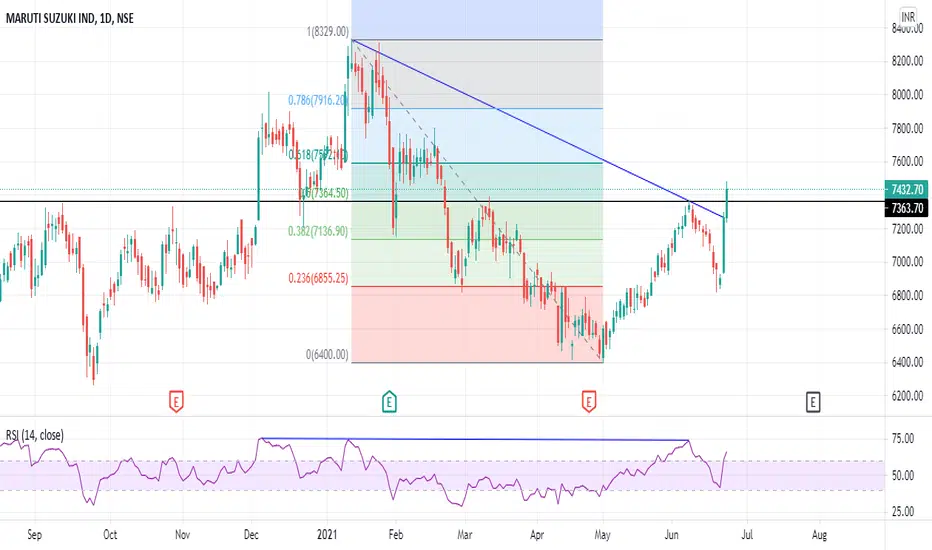
Why you should be careful before trading in PRINCEPIPE As many of my followers were asking about PRINCEPIPES, here is my view, Plz read the whole If still, your setups match go for it :)
Logic points --
1) On Monthly charts, It has not given a good retracement
2) On the day chart if you make a Fibonacci retracement from the lowest part till the near term high then u will see a retracement of only 0.2
3) Such retracement either show heavy bullishness for the short term or can be deadly bearish for the long term faking out for the retracement part ju
DLF: Chart set up and trading strategy for June month expiryDLF
- level of 308-313 holds significance for the stock
- given the set up one may consider to sell 320 Call option CMP around 6.3
- be cautious if DLF trades above 309 and exit if closes above 313
The strategy has a maximum profit potential of Rs 20790 per lot and has inbuilt loss protection for a rise in price up to 326.30 giving ample opportunity to adjust / exit in case view gets invalidated
Disclaimer
- The view expressed here is my personal view
- Past performance is not a guaran
Tata Motors Gearing Up for Impulse Wave 5 Tata Motors after Mar 2020 low 63 moved up by making wave 1 as leading diagonal
Next sub impulse wave (1) and (3) were normal waves without extension.
So (5) was explosive up raising 300% or wave (1)+(3) at 357.
After 357 high it retraced very small portion 0.232 Fibonacci level or 23% which is common in case of wave extended wave.
It appears to be making cup and handle pattern which could reach well towards 0.618 Fibonacci zones.
This rise from 280-360 is also observed to be leading diagon
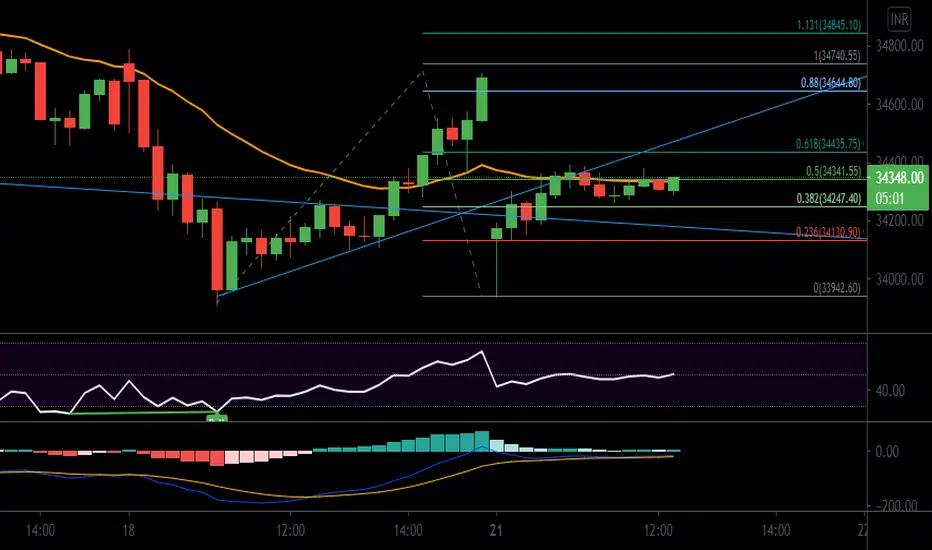
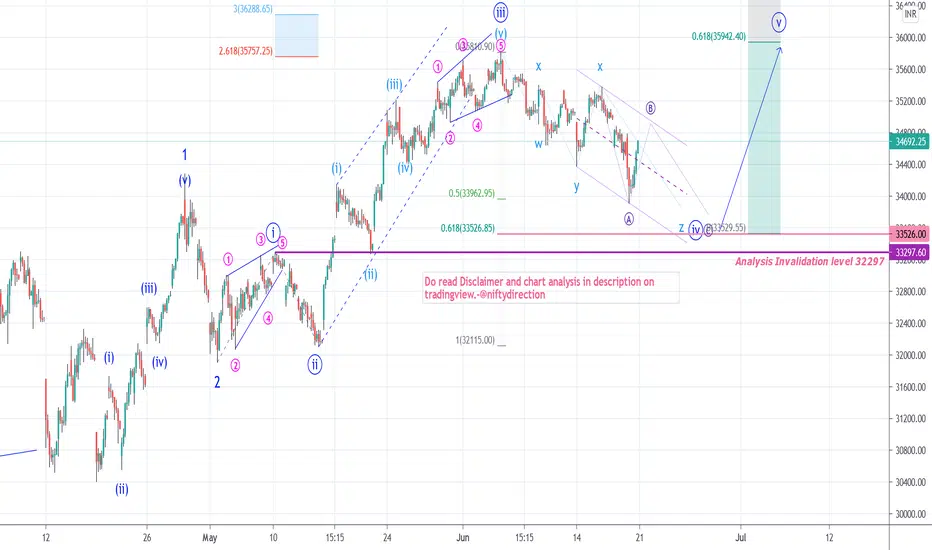
Banknifty Triple Zig Zag Correction Complex CorrectionBank nifty going through triple zig zag complex correction and there is another 1000-1500 points correction possible towards 0.618 Fibonacci level.
With sharp recovery from 33909 its unclear if its A or Z wave completed already and new impulse started?
Monday will give Clear picture if its not able to cross channel top 35000 then we can expect C wave of Z to take it down towards 33500 (0.618)
Once correction is over we can expect V wave to begin towards 360000
This is the best possible E