MCX Silver Will Touch 68000?Volume accumulation is confirming a downtrend. Here, the price is in a downtrend. But if you look for the short-term, silver price has started rising nearby the retracement value of 0.382. We may see a bullish reversal from the 0.236 value for 0.382 to 0.5.
MCX silver futures prices may hike to the levels of 66000 - 66600 - 67000 - 68000 .
Overall, a clear trend will identify after moving averages crossover.
Fibonacci Retracement
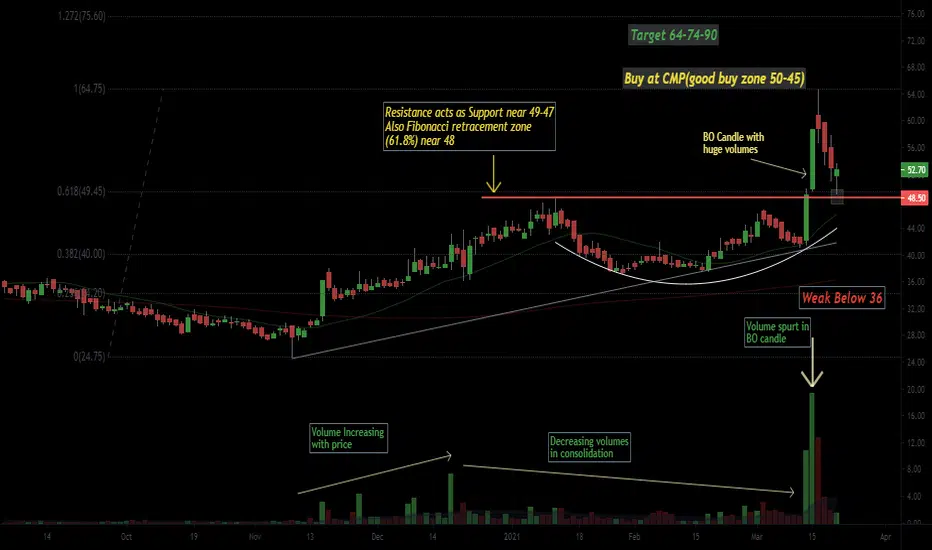
[Positional/swing] HPL Electrical LongBO with recorded high volumes now at retest
Buy at CMP (good buy zone is 50-45)
weak below 38(Small cap so please maintain SL below 38 on closing basis)
target of 64-74-90
Resistance acts as Support near 49-47 Also Fibonacci retracement zone (61.8%) near 48
Increasing volumes during uptrend
volume dry up during consolidation
Info edge 4th wave double or triple correctionInfo edge could be completing 4th wave correction or may give final correction in Z wave till 0.618 fibonacci level.
Other details on chart. Since exact end of 4th wave not know so Swing low would be stop loss
DISCLAIMER:There is no guarantee of profits or no exceptions from losses. The study provided is solely the personal views of my research. You are advised to rely on your judgment while investing/Trading decisions. Past performance is not an indicator of future returns. Investment is su
JSW Steel Extended 3rd and 5th Waves and Channel ResistanceStock has spectacular rally after March 2020 lows due to extended 3rd and 5th Waves.
The channel has been drawn between mar 2020 lows and previous all time high.
Now V of 5th is ending diagonal and Negative divergence seen on MACD.
Break of lower channel line of ending diagonal would confirm downside which is expected to go 0.618 or more.
Alternative to this analysis If stock moves past 460 it can head towards next Fibonacci extension points 485/524
DISCLAIMER:There is no guarantee of profi
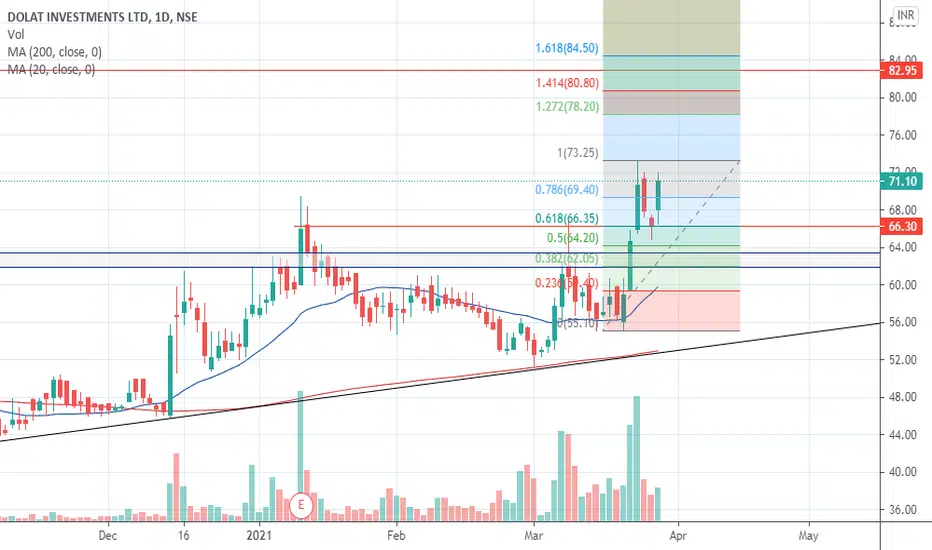
DOLAT Weekly Breakoutit has given weekly breakout with good volume at 62 levels. it has retest breakout level on daily time frame.
Steady rise in volume on weekly since January.
it can rally upto 84 levels.
RSI is at 67 on weekly and daily
DLong
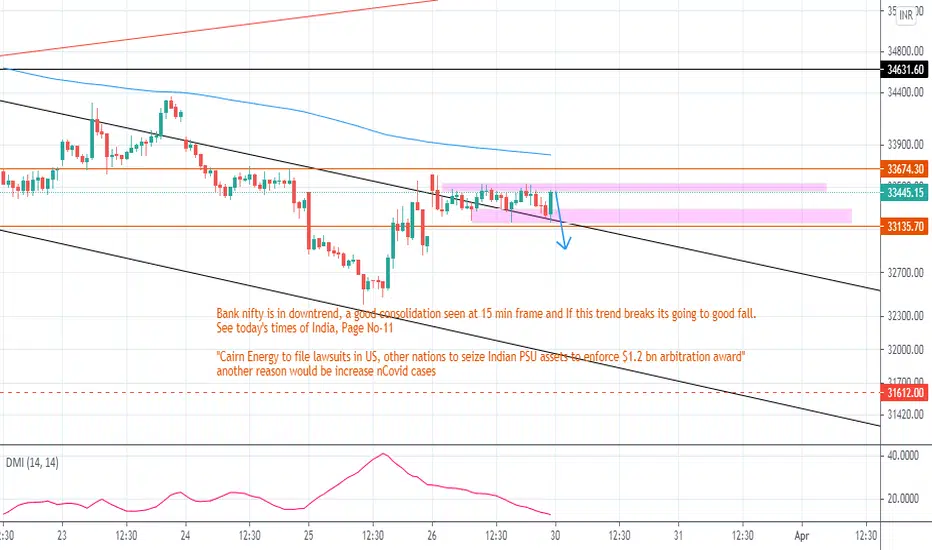
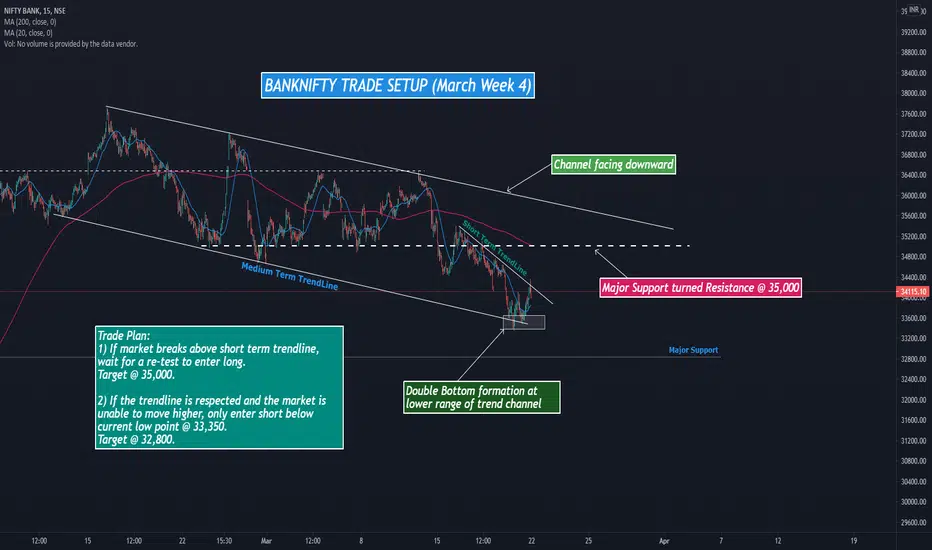
BANKNIFTY TRADE SET UP (MARCH WEEK 4)The market has been correcting for the past several days and BankNifty has moved down 11.5% from the high it made in February. This has presented some good shorting opportunities. While the market trend in the very short term remains bearish and long term trend being bullish , there is heavy volatility on either side.
After correcting for 4 consecutive sessions, the index had a good recovery on Friday, which may have trapped all the bears. If we observe the trend for the last 1 month of the 15
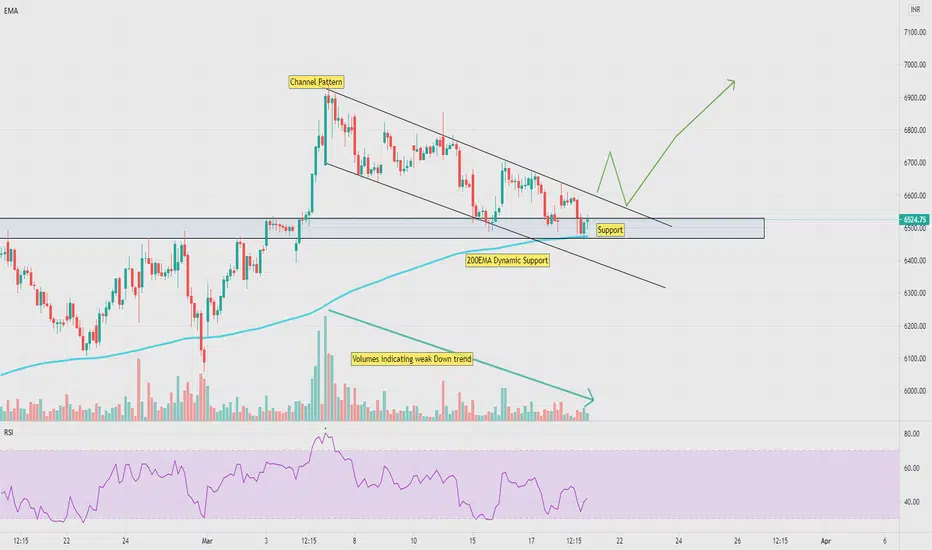
ULTRATECH CEMENT "Channel Pattern" Bullish view
Reasons:-
1.Dynamic support
2.Price support
3.Channel Pattern
4.Volumes indication of weak down trend
5.Fibo levels @ 0.5%
If not an direct upmove we might see some consolidation and then the stock may shoot in upwards direction.
The EMA and the support are very crucial levels lets see if they could sustain.
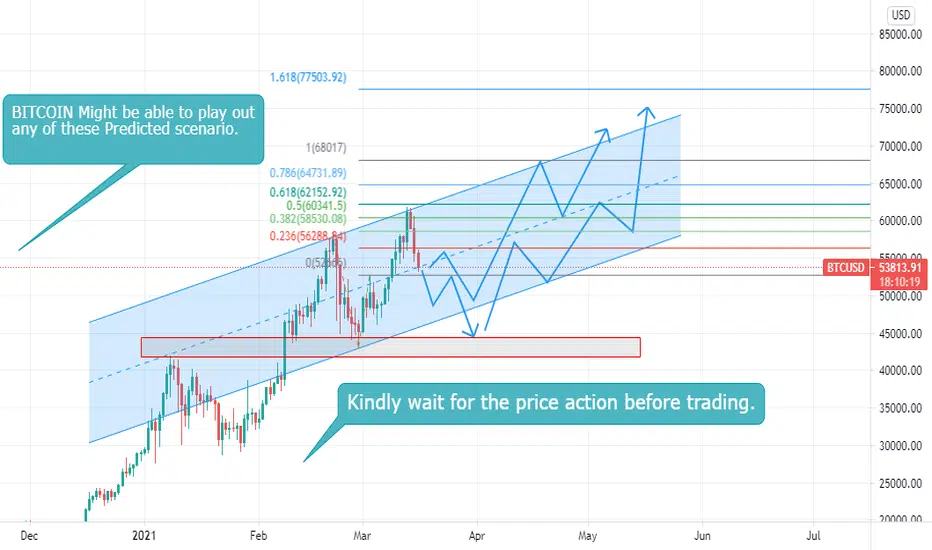
BTCUSDInstitutions are the main reason that we are witnessing a bear market in a Bull cycle. I personally think that Institutional Traders wants to get in the Bull cycle at their particular price point. So kindly wait for the price action to play out.
Watch out for the above mentioned Fib levels in the chart.
Disclaimer:
Trade at your own Risk. I am not responsible for your own actions. These are my opinion and not financial advice.