GOCOLORS - Getting ReadyGOCOLORS is getting ready and has been testing the resistance level.
- It is consistently trading above the 20 EMA. Recent high-volume candles suggest clear institutional participation. Although volume is currently drying up, the price is sustaining — a positive sign.
- The stock reversed after touching the 0.5 Fibonacci retracement level, indicating strength.
✅ If you like my analysis, please follow me as a token of appreciation :)
in.tradingview.com/u/SatpalS/
📌 For learning and educati
Fibonacci Retracement
ONWARD TECHNOLOGIES LTD📊 ONWARD TECHNOLOGIES LTD (1D) – CMP ₹313.00
📅 Published on: May 17, 2025
📈 Exchange: NSE
📌 Ticker: ONWARDTEC
🔍 Technical Chart Analysis
✅ Trendline Breakout:
A clean downtrend line breakout is visible on the daily chart, marking the end of a prolonged bearish phase. Price has decisively broken above the falling resistance trendline with a sharp bullish candle and strong volume confirmation.
✅ Volume Surge:
Breakout occurred with a 17.76% gain and significantly higher volume (1.23M), hinting a
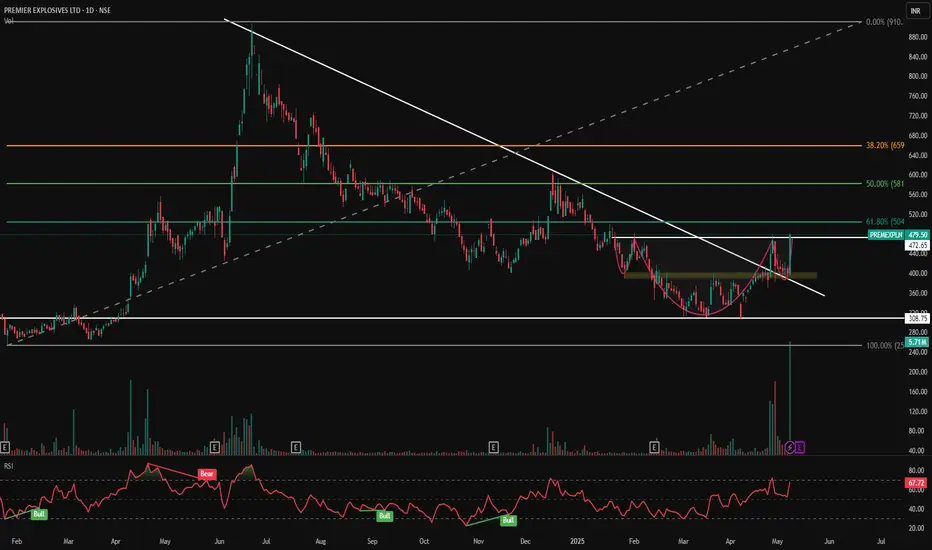
PREMEXPLN - Cup & Handle Breakout | Volume Surge📊 PREMEXPLN – Cup & Handle Breakout | Volume Surge + Key Fibonacci Confluence!
🕰️ Timeframe: 1D | 📐 Pattern: Cup & Handle | 📊 Momentum: Bullish
📈 Technical Chart Overview:
Premier Explosives has executed a clean breakout above a long-term descending trendline and a cup & handle base with a massive spike in volume, hinting at a powerful trend reversal.
Price surged nearly +19% intraday, confirming strength near the 61.8% Fibonacci retracement from the previous swing high at ₹910.30 to the swing
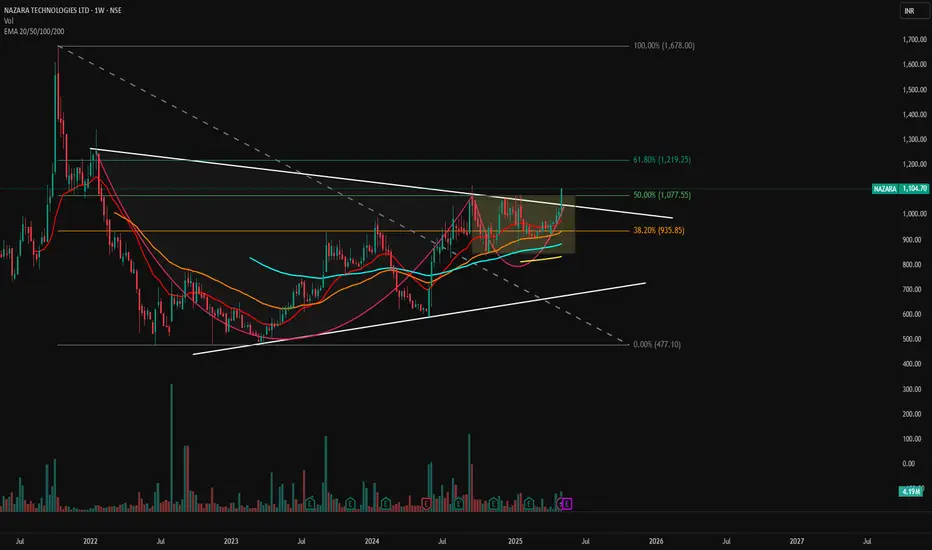
NAZARA - Breakout from Long-Term Falling Wedge📊 NAZARA – Breakout from Long-Term Falling Wedge | Strong Weekly Momentum
🕰️ Timeframe: Weekly | 💥 Pattern: Falling Wedge Breakout | 🔥 Sentiment: Bullish
📈 Chart Overview:
Nazara Technologies has broken out of a multi-year falling wedge on the weekly chart, with a strong green candle above key EMAs and Fibonacci confluence zones. Price closed the week above ₹1,100, indicating a shift in long-term momentum and a potential start of a fresh uptrend.
🔍 Technical Highlights:
📉 Falling Wedge Pattern
MARICO - Breakout & Retest Setup!Overview & Observation:
1. 70% Fib support zone.
2. Good volume support
3. Breakout & Retest done.
Trade Plan:
1. Eyeing 20% upside with 10% SL
2. RRR is okay, not great!
- Stay tuned for further insights, updates and trade safely!
- If you liked the analysis, don't forget to leave a comment and boost the post. Happy trading!
Disclaimer: This is NOT a buy/sell recommendation. This post is meant for learning purposes only. Please, do your due diligence before investing.
Thanks & Regards
Zomato is showing weakness it may test 170 soon.Zomato is weak on monthly and weakly chart. It forms Fake breakout with double top pattern on monthly chart.
As per chart showing weakness on daily chart also as RSI drag below 40. It can short on any rise or here for target 170 soon.
ZShort
Triveni Turbine - Chart of the Week NSE:TRITURBINE has a beautiful structure on the Weekly Timeframe to Qualify for my Chart of the Week idea, it saw Decent Volumes around the marked Key Levels which is 0.786% Fib Retracement Levels and also a Rising trendline which has been defending since June 2022 Several Times.
About:
NSE:TRITURBINE primarily manufactures and supplies power-generating equipment and solutions. It was a division of NSE:TRIVENI since the 1970s and was demerged w.e.f from Oct 2010 into a separate entity.
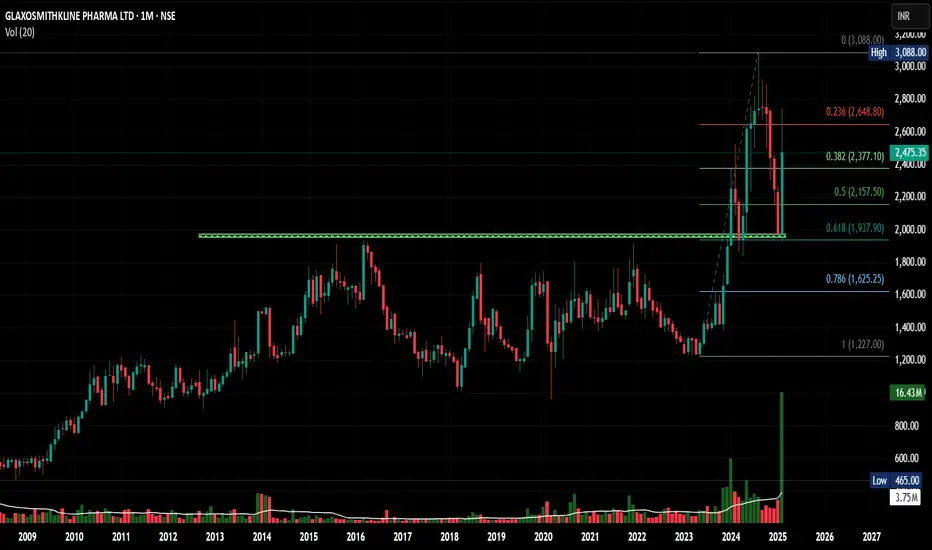
GSK Pharma - Chart of the MonthNSE:GLAXO has a beautiful structure on the Monthly Timeframe to Qualify for my Chart of the Month idea, it saw Heavy Volumes around the marked Key Levels which broke out and retested went to ATM and Again Retested and Bounced from that Place With Volumes in Last Month.
Also if we Use Fibonacci retracement it bounced from Crucial 0.618 Levels.
About:
NSE:GLAXO researches, manufactures and makes available a broad range of medicines and vaccines that benefit people, It's a Leading Global heal
Godrej Properties good to go long
Godrej Properties On Double Bottom + 61.8 Fibo ratio + RSI Diversion (clearly Show on 4 hrs & Daily)
Good to Go long for Positional buy.
Infra Sector is on good move in last 2years - this stock also correct perfectly
i thing this stock will give good returns in Next few months.
NIFTY Breaking 2020 Trendline with Monthly Big Bear CandleNifty Breakdown 2020 Trendline on Monthly Chart with Big Bear Candle - (Currently Now its show almost Full Bear power Candle near at 10:30am)
If You See the Monthly RSI Is also going to break almost Five years Low 53.30
3rd thing if you comapre RSI low 2016-2020 breakdown its Go more 39% Down in just 2 months.
Chart & Indicator both Saw Very bad Sentiments & Pattern on chart.
my prediction as below as per fibo chart shown in chart
Target as per Fibolevel
T1- 21848.50 (23.8%)
T2- 19108.65
MAHARASTRA SEAML - Aggressive Reversal Bet!Price Analysis & Overview:
1. EMA support taken.
2. Strong Fib support zone.
3. Blast above 900
4. 100%+ Potential
5. Need good volumes
6. Entry above 710 post confirmations
7. Strong buying candle formation is needed.
- Stay tuned for further insights, updates and trade safely!
- These are my personal views.
- If you liked the analysis, don't forget to leave a comment and boost the post. Happy trading!
Disclaimer: This is NOT a buy/sell recommendation. This post is meant for learning purpo
Nifty still going Down? Application of Elliott waves and FiboNSE:NIFTY has corrected by 3500 pts (13.3%) from its high of 26,277 in Sep’24.
In post COVID era this is the 2nd biggest correction in terms of % and biggest in points.
Let us use Elliot wave theory and the Fibonacci retracement tool
Wave Time Start to End Points (percentage from top)
Wave (X) ( (i) to (ii) ) Oct-21 to Jun-22 18,604 to 15,183 3,421 pts (18.4%)
Wave Y ( iii to iv ) Sep-24 to Feb-25 26,277 to 22,986 3,290 pts (13.28%)
NIFTY: New high or new low ahead?It looks like NIFTY is in wave 4 currently.
If this counting is correct, price should not break below wave 2 (23222 level). Because according to rule, wave 4 will never be parallel or below wave 2.
It means price will eventually go in wave 5.
Now, as per this counting wave 3 is shorter than wave 1.
And rule says wave 3 is never the shortest wave.
It means wave 5 will be shorter than wave 3 here.
We may assume target of wave 5 as 24034.
But if price falls below wave 2, this counting becomes inv
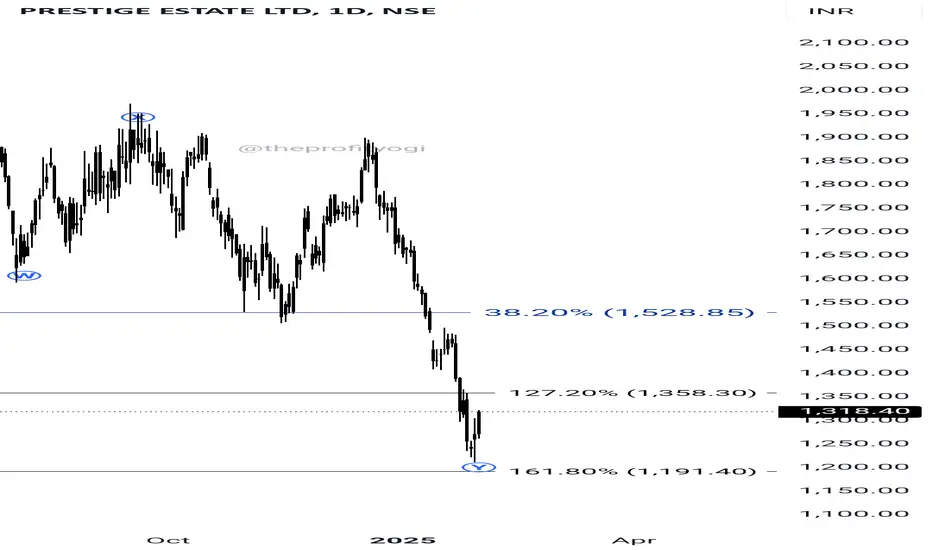
Buying opportunity in PRESTIGE ESTATE LTDPRESTIGE ESTATE LTD is in Double Correction.
The maximum target for wave (Y) of double correction is 161.8% extension.
We can see that price is near 161.8% so here we can buy this stock with stoploss below 1185.
The target will be minimum 38.2% retracement of entire move i.e. 1528
This analysis is based on Elliott Wave theory and Fibonacci.
This analysis is for educational purpose only.
Breakout Potential After Trendline BreakA possible breakout is expected once the price breaks through a key trendline. This strategy focuses on identifying significant trendlines formed by price highs or lows. When the price breaches this trendline, it could signal a change in market direction, indicating a potential breakout. Traders should monitor volume and other indicators to confirm the breakout's strength before taking action.
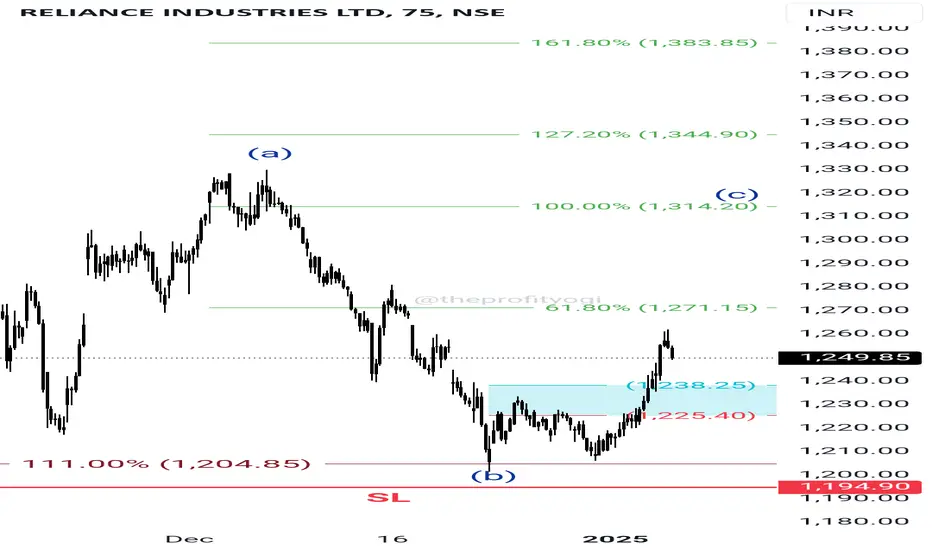
Corrective rise in Reliance The current upmove in Reliance is corrective.
The recent low was made near the 111% level, which is considered the wave B level of Flat Correction.
The price is in wave C currently.
If anyone is interested in buying Reliance, there is a buying opportunity in the blue box. The stop loss will be below wave B.
The targets are open as:
Minimum 61.8% (the price is near this level)
Rule of equality 100%
Extended golden ratio 161.8%
This analysis is based on Elliott Wave theory and Fibonacci.
Thi
Axis Bank Increased Volume and Strong support Axis Bank Seems to stay Strong at the Current level of 1070 for the past 5 Sessions , which seems to be intercepting point for Pivot, Fibonocchi and Trendline Support , Short term move upto 1150 can be expected on Stable market Condition . Repositioning Pivot around 1120 for upcoming Week may make it possible .
Setup : NSE:AXISBANK
Buy Near 1070
Book Near 1150
SL below 1030
SONATA SOFTWARE - Expecting ATH | 40% upside potential Price Analysis & Overview:
1. Prices have taken support from the fib golden zone.
2. EMA are also supporting the trend.
3. Minimum ATH resistance level will be expected.
4. Above 720 RSI will show further strength for bullish momentum.
5. RRR is favourable.
6. Retracement based trade setup.
Trade Plan:
1. ENTRY = CMP 590
2. SL = 10% 530
3. TARGET = 40% 800++
- Stay tuned for further insights, updates and trade safely!
- These are my personal views.
- If you liked the analysis, don't fo
NIFTY PREDICTIONS.... BEARISH OUTLOOK FOR DECEMBER 2024. I'll try explaining my Nifty chart analysis through Elliot waves.
Nifty, again, is likely correcting in a 5-wave pattern. After reaching an ATH of 24274, Nifty's downside waves/correction started towards the end of September.
Wave (1) moved in a 5-wave pattern and ended around 24700, as marked in the chart.
Wave (2) had a zig-zag pattern and ended around 25200.
Wave (3) also had a 5-wave pattern, falling 1.23 times wave 1 to end around 23300 levels.
Wave (4)- Nifty is currently in this
IT SECTOR OVERVIEW: Super Bullish!Observation & Overview:
1. The IT Index was beaten down in late 2022.
2. After 2023 it formed a bottom and prices started gaining strength.
3. 2024 price started forming Higher Highs & Higher Lows, touched the previous 2022 ATH and currently, taking support from the 50% of the swing and also bouncing from a D tf demand.
4. It is acting as a major support zone and good weekly candle rejection can be noticed.
5. Signs of buyers getting dominant and it should break the ATH soon.
6. I'm expecting a