Time Analysis - Elliott Wave combinationSWAN ENERGY LTD is in impulse now.
In the daily chart of SWAN ENERGY LTD, Flat Correction is getting over and the price is entering in impulse now. This can be said if we combine Time analysis with Elliott wave counting.
The detailed counting of this Flat Correction can be seen in the chart above.
The 0-B trendline is broken in half time of wave C time.
(We can see wave C took 59 bars to form and after that, the price breaks above the 0-B trendline in just 30 bars)
According to the rule, th
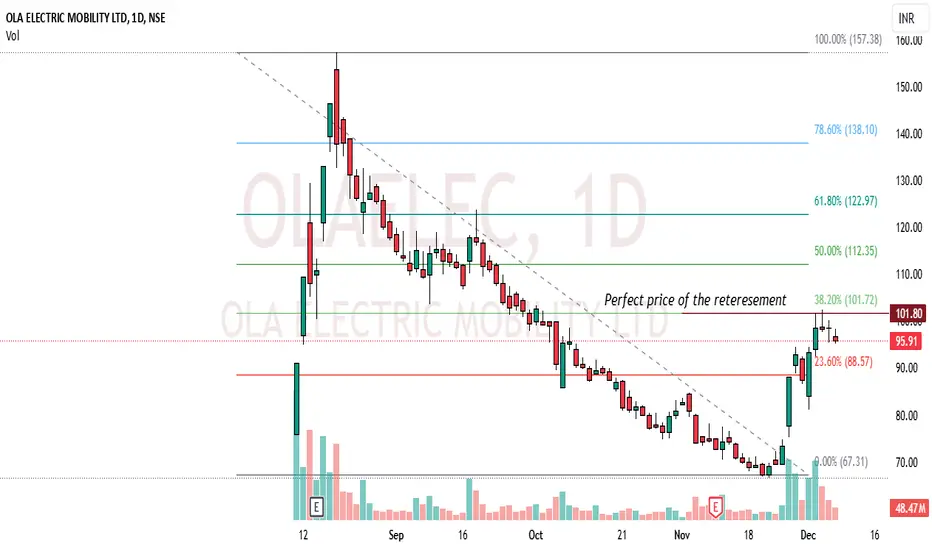
Fibonacci Retracement
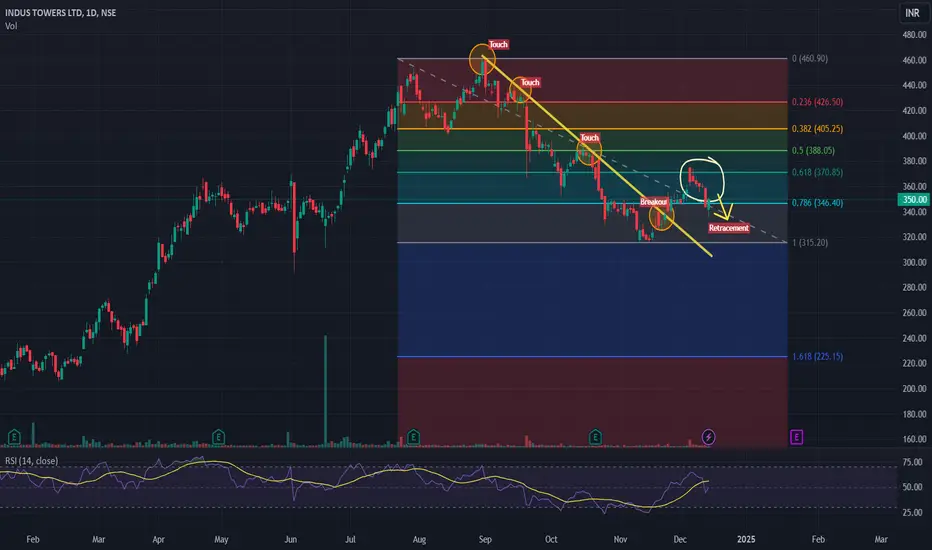
Indus Towers Technical Analysis: Fibonacci Support and BreakoutThe chart of **Indus Towers Ltd.** using Fibonacci retracement levels, trendlines, and RSI (Relative Strength Index). Here's a detailed breakdown:
### Observations:
#### 1. **Fibonacci Retracement Levels**:
- Key levels drawn: **0.236 (₹426.50), 0.382 (₹405.25), 0.5 (₹388.05), 0.618 (₹370.85), and 0.786 (₹346.40)**.
- The price has retraced significantly from the recent high and is hovering around the **0.786 retracement level (₹346.40)**, indicating a potential **support zone**.
#### 2
Is correction over in MCX?In the 75-minute chart in MCX, we can see that flat correction is going to be finished.
This can be expected as the 0-B trend line breaks in less than half a time. (See that the lowest point from the trend line is formed in 25 candles, and the trend line is broken in 10 candles.)
This is the primary indication of the end of correction.
A risky buying opportunity exists at the current market price. The stop loss for this will be below the end of wave C, i.e., below the 5820 level.
This is not
Classic Double Correction PatternThis is a classic example of Double correction (Double three) in HDFCLIFE.
Marked in the first box, we can see Flat Correction where wave B is retraced to the 81% level. We are fulfilling the minimum requirement (61.8%) of wave B. Here in wave C, we see three waves. This is the first hint of an upcoming complex correction. The whole wave is marked as W here.
In the second box, there is a perfect Zig-zag pattern. Wave B is retraced to 50% here. Also, we can see three waves in wave C, which give
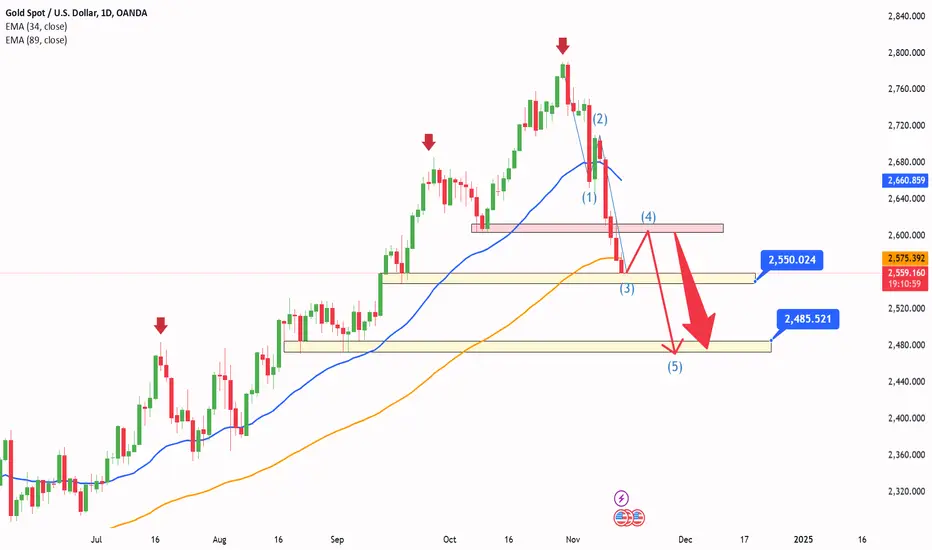
Update latest gold price today !Hello everyone!
Gold has been in a steady decline since the start of the week, currently sitting at 2561, with strong indications that this downtrend may persist. The key 2550 level is still fiercely contested, keeping traders on edge.
The market remains clouded with apprehension, especially with recent developments in the U.S. following Donald Trump's election as president. This lingering uncertainty may continue to weigh heavily on gold.
At the moment, all attention is focused on the upcomi
Adani Enterprises: 100 pts long trade.First of all Happy Deepavali to Everyone. Wish everyone a happy trading year.
* Previous ICICI Bank trade worked out very well achieving all its targets. Still following the trend channel.
* Adani enterprise after taking A strong support from 2700 level on the way to retest its swing high 3100 - 3200.
* Presently trading on fib retracement zone of 0.5 to 0.6 at 2950 level.
*Trade levels for the trade
Target levels: 3100-3200 (if resistance breaks, can take more risk)
Stop loss: 2900
can we see a bull run in crudeoil toward 6400 ???as wee can see the charts previously do support at boxx pattern and three time it tried to break it and it did break but at the same time it do follw the trend line -came from 6489 to 5383 (drawed in chart) no if we see the fibonacci suprt zone (marked as pink box) -there is possible chances of bull run from that point to wards 6400 . it sure will break the trend line ,,,
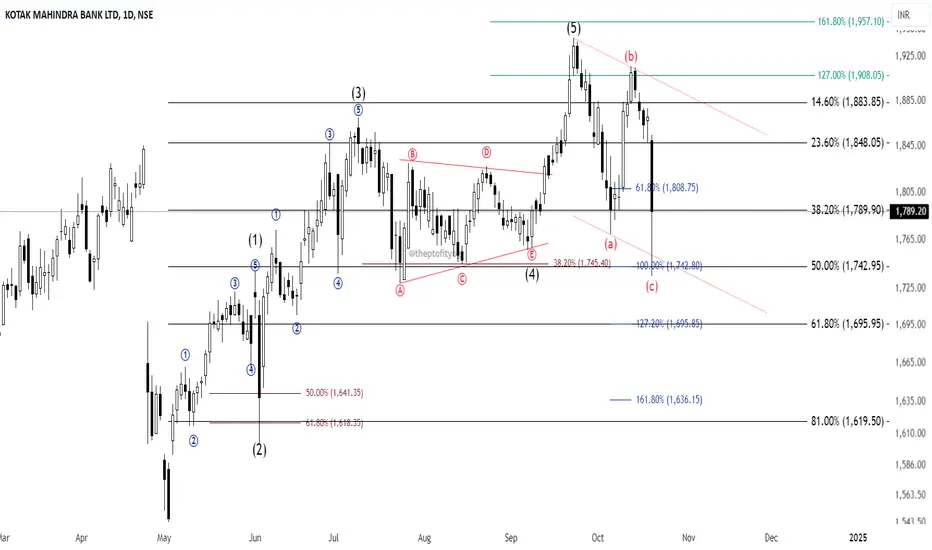
KOTAKBANK good to buy or wait for further correction?As we can see in the daily chart of KOTAKBANK, wave C of Flat Correction has reached 100% extension (which fulfills the rule of equality). The previous impulse also has a 50% retracement level around the same point, giving us a perfect cluster.
Now, can we directly buy around this level?
The answer is simple.
Suppose the recent low,1735, is broken, and the stock starts to trade below this. In that case, the further level of wave C of Flat Correction will be opened, and the stock may further fa
Nifty small upmove possibleNIFTY has clear indication now that wave c of wave B is under formation.
The recent down move has not touched 127% level, so this down move was clearly wave b of wave B.
Now if we use fib extension for target of wave c of wave B, we get cluster around 25422 and 25416 level, where 161.8% extension of wave c and 50% retracement of bigger wave A (which is the maximum target of wave B of Zig-zag).
So we have good buying opportunity here with stoploss below 24545 and target of 25420.
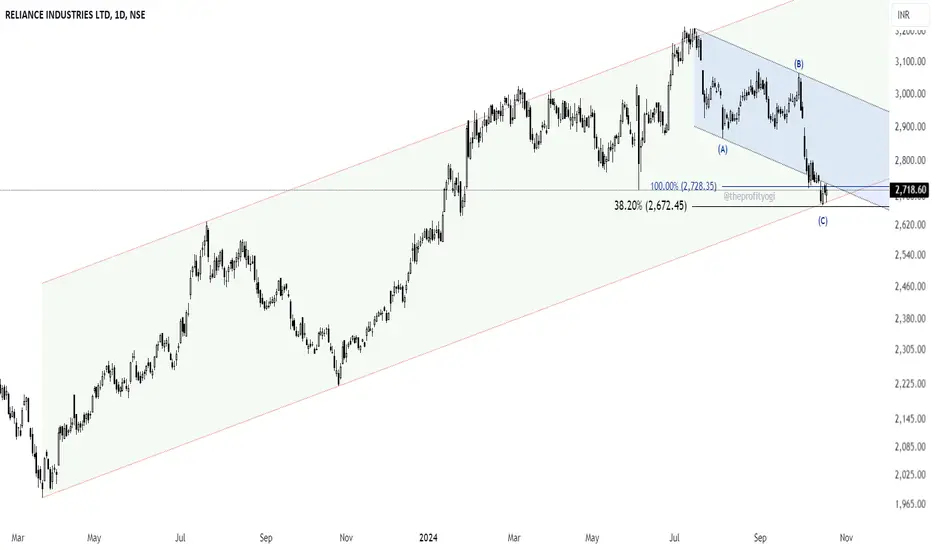
Low risk buying in RELIANCEA low-risk high probability buying setup is forming in RELIANCE.
Price is taking support at the cluster of 38.2% retracement, 100% extension of Flat correction, and trendline in red.
If the price enters and sustains in the blue channel, showing bullish pressure, it will provide a good buying opportunity with a stop loss below the recent low.
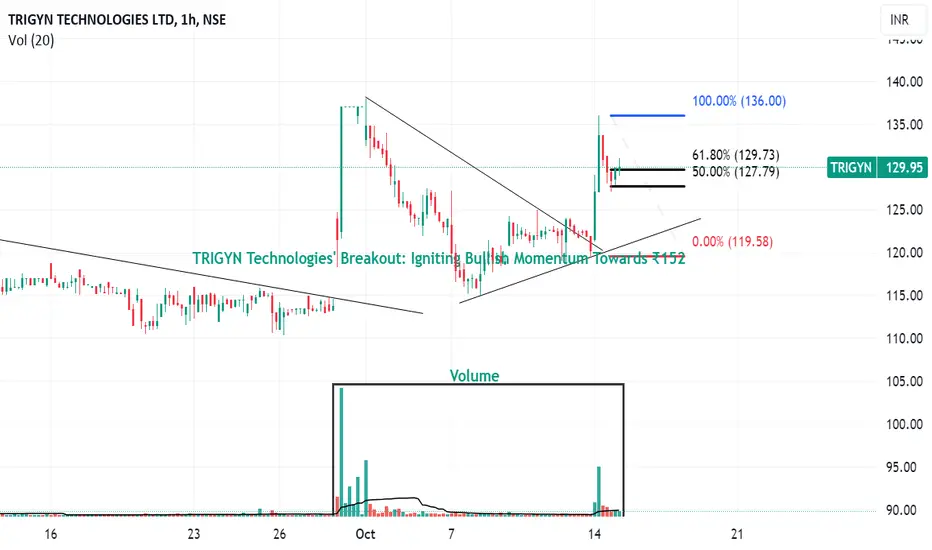
Breakout in TRIGYN May elevate Bullish MomentumToday, TRIGYN Technologies experienced a notable breakout above its established trendline, resulting in a gain of over 10% across two subsequent trading hours. This positive price movement indicates a potential shift in investor sentiment and market dynamics surrounding the stock.
A detailed examination of price action reveals that the stock has established HH and HL in its uptrend. Notably, the price has found substantial support near the 50% Fibonacci retracement level, demonstrating resili
Morepen Lab - Bullish Flag and Fibonacci RetracementMorepen Lab has formed a bullish flag pattern, and today it has successfully broken out.
The price has retested the Fibonacci level at 38, where it formed a bullish piercing pattern, signaling potential upside momentum.
Price take support of 50 period EMA.
Additionally, this level coincides with a significant demand zone on the chart, suggesting strong buying interest. Keep an eye on this stock for further upward movement
Reliance - The Elephant can Turn EverythingReliance has been in a impulse since March 2023 from lows of 1979.15 to 2630.95 was size of Wave 1 & it retrace exactly 0.618% in wave 2 as marked in chart.
Wave 3 starting from 2220.30 to 3024.90 was equal to Wave 1 in size or slightly bigger than wave 1 & Wave 4 did retrace exactly 0.382% as shown in chart.
Wave 5 is exactly inverse 1.618 of Wave 4 fall.
This entire Impulsive structure is a good example to study wave structure & understand fibonacci relations between Elliott waves & how a i
Nifty 50-October 2024 viewI feel it is time to be little cautious.
Post 4th June(the election results day), we have seen a good rally in market from 21300 to 26250 today which is almost 25% and that too without a significant pull back or correction.
The rally since past couple of weeks is mainly due to large caps.
There is no reason to be extremely bearish but as per fib retracement, we are near golden ratio of 61.8%.
We might see a pullback or consolidation here before next move towards 27000+ levels.
Important lev
61.8% Fib bullish reversal with Volumes on WeeklyNSE:HINDZINC The stock started a bullish reversal from its 0.618 Fibonacci retracement level. RSI is also supportive. A sustained move beyond 546 would lead to a strong up move shortly.
Above the 546 level trade will activate with a target of 680 and StopLoss 475
Check out my other stock ideas below until this trade gets activated, I would love your feedback.
Disclaimer: This analysis is intended solely for informational and educational purposes and should not be interpreted as financia