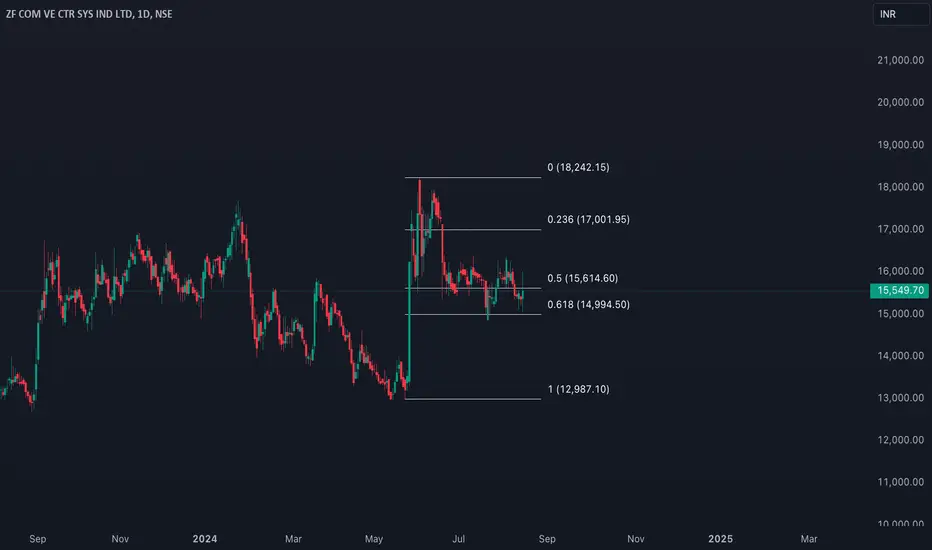
TITAGARH : Fib + 200 EMA SupportThe chart shows that the price is currently near the 200 EMA, coinciding with the 0.618 Fibonacci Retracement level, which is considered a strong support zone. These two indicators are likely providing solid support. However, it's possible that the price will consolidate or remain range-bound before making an upward move, which could further strengthen this support.
Fibonacci Retracement
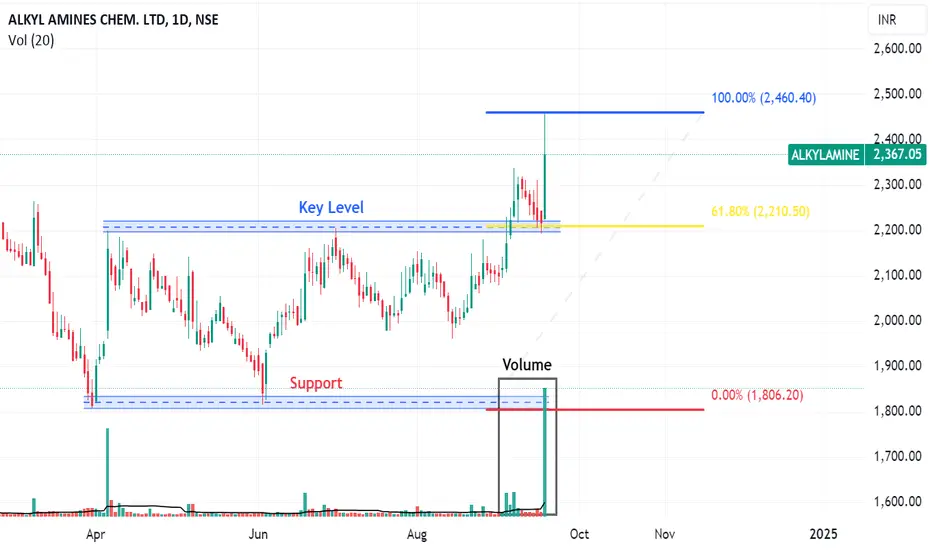
A Bullish Breakout Analysis of Alkyl AmineAlkyl Amine stock has recently exhibited a noteworthy price action following a consolidation phase that extended beyond 1,000 days. The stock has successfully retested a pivotal support level and demonstrated a robust bounce, closing above this key level, accompanied by a significant surge in buying volume. This development is indicative of a potential shift in the trend towards a bullish posture.
From an Elliott Wave analysis perspective, the stock appears to be in the early stages of a wave
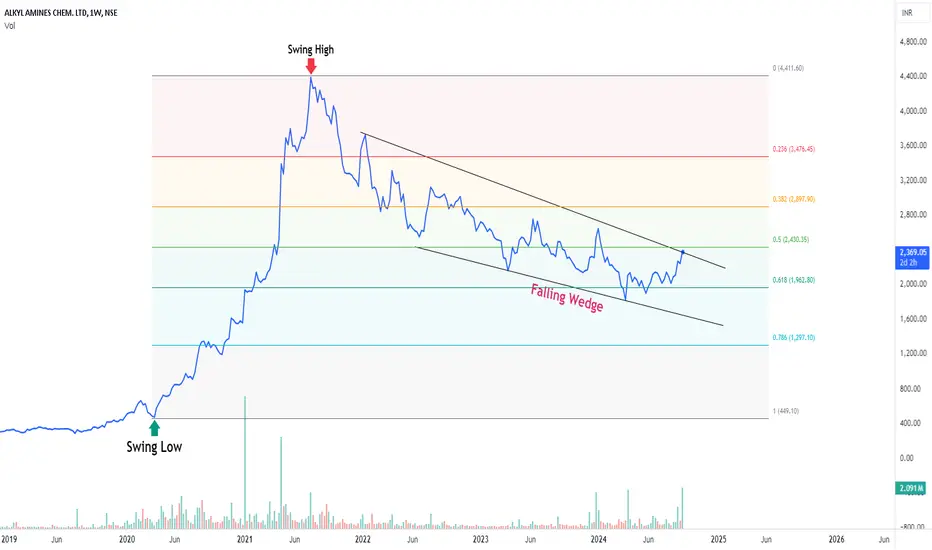
ALKYLAMINE : How to spot Trend Reversal There are 3 tools to identify a Trend Reversal
Fibonacci Retracement Indicator:
- Fibonacci retracement levels are prices, depicted as horizontal lines on a chart, that indicate where support or resistance could likely to occur.
- The indicator is useful because it can be drawn between any two significant price points, such as a high and a low. The indicator will then create the levels between those two points.
Here in this chart Swing low is 462 and Swing high is 4386
The price has fallen
Sun Pharmaceutical, Bearish - SidewaysThe stock has seen exponential rise since last many months without any intermittent major corrections. The fresh trend lines created have been breached now, and stock seems to have entered into sloping / sideways channel since Feb. Expect to see corrections upto 1300-1250 or upto the trend line which will be healthy for accumulation & gather momentum for future uptrend.
FINNIFTY (CNXFINANCE) - A BEARISH CYPHER PATTERN FORMED. NSE:CNXFINANCE
❇️Harmonic chart pattern: BEARISH CYPHER PATTERN
👉🏻The Cypher pattern is one of the most profitable harmonic patterns and is useful for risk management, because of the large success rate. Traders can minimize losses if they follow the Cypher trading rules and meet the profit target.
🚀How to use
❇️The Cypher harmonic pattern is a trading strategy that uses Fibonacci numbers to identify turning points in geometric price patterns. It can help traders predict future movemen
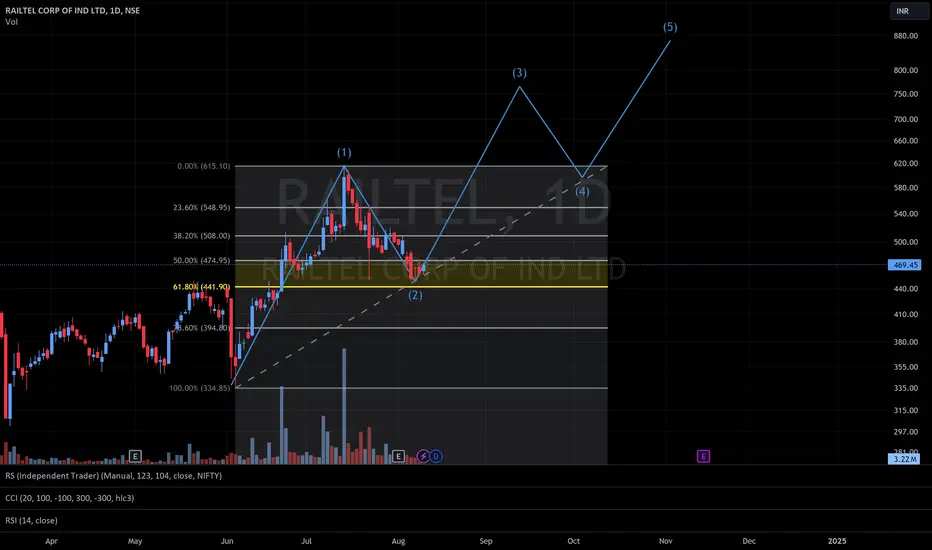
RAILTEL - AS PER FIB RETRACEMENT, CORRECTION WAVE MIGHT BE OVERHi,
This idea is about Railtel Corporation of India Ltd
ABOUT THE COMPANY
RailTel was incorporated in 2000, with the objective of creating nationwide broadband and VPN services, telecom, and multimedia network, to modernize the train control operation and safety system of Indian Railways. It is a "Miniratna" PSE of the Government of India. At present, RailTel's network passes through around 6,000 stations across the country, covering all major commercial centers
TECHINCALS
As per the pric
7"NYKKA" FSN ECOMMERSE VENTURES LTD 28 WEEKS BREAKOUT WITH 1. NYKKA given a breakout in 135 days (28 Weeks) high and packed with the volume of 53.22M, And NYKAA' s last 30days average volume is 7.33M.
2. It was Created a range contraction between 139.8 to 195.50 (55.70 points, 39.84%), After this breakout this range might expand up to 111.4 points. In price levels the expansion will be leads to 306.9 levels.
3. Based on the Historical price action from 11th April 2022 to as of now there is no potential supply zones in Higher Timeframe like Weekly
IndoBorax - Fibonacci Targets in sight after Breakout - DailyIndo Borax & Chemical Ltd. has recently broken out cleanly from a descending trendline. The Fibonacci retracement levels provide clear targets for the upcoming price action, making this an interesting setup.
Technical Analysis:
Descending Trendline Breakout: The stock has decisively broken out from a descending trendline, indicating a shift in momentum from bearish to bullish.
Fibonacci Retracement Levels: The Fibonacci retracement levels drawn from the recent high to the low indicate po
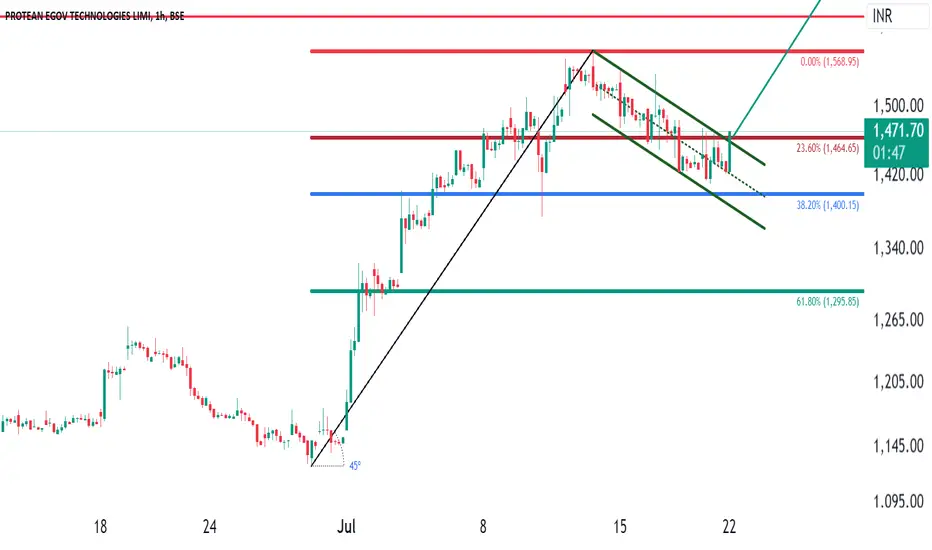
PROTEAN - Bullish Flag, Morning Star, Fibonacci Retracement 38.2In the chart of "PROTEAN," a Bullish Flag pattern has emerged, suggesting a potential continuation of its upward trend. The pattern is characterized by a sharp upward move (pole) followed by a consolidation period (flag), forming a rectangular shape on the chart.
The entry point for this pattern is identified above 1466, indicating a breakout from the consolidation phase. A stop-loss is set below 1410 to manage risk in case of a reversal.
The target for this trade is set at 2000, aligning with
APLLTD [pitchfan tool]APLLTD ...
pitchfan trading :- first time i share this tool i use in my technical study purpose . The chart has several green and yellow circles highlighting significant zones. These typically represent areas of interest, such as support, resistance, or breakout points.
show potential support and resistance levels. They suggest the market could reverse its direction or experience a significant price movement along these lines.
Price Targets:
1st Target (1st TRG): The first target
Carborundum-A quick breakout swing tradeLogic:Breakout retest done and fresh flag breakout of consolidation
Targets are based on Fibonacci retracements.
Company has strong fundamentals. Good stock to invest on dips as well.
Idea is shared as a swing trade for educational purposes. It will help you understand power of flag breakout and continuation patterns.
KPIL KPIL
High Risky Stock is 3.06x as volatile as Nifty
News
Mumbai | Thursday, 11 July 2024: Kalpataru Projects International Limited (KPIL), one of the largest
Engineering & Construction companies listed in India along with its Joint Ventures (JVs) and international
subsidiaries have secured new orders/notification of awards of ₹ 2,995 Crores.
The details of the aforesaid new orders are as follows:
• Orders in the Transmission & Distribution (T&D) business in overseas markets
• EPC Order
YESBANK (fibo )YESBANK
SL compulsory.
This Elliott Wave theory and understand how to effectively trade using this technique. Ralph Elliott discovered a very important pattern in the markets in early 20th century.
yes bank move with high volume with breakout still wait for retext .
targets and sl asper fibo .
for MORE check in my Tv-id " in.tradingview.com "
If You LIKE👌👌 MY Idea ......Boost.🔥🔥🔥.. its.
"Disclosure : I am not Sebi-registered." This channel is for only educational purpose. An
Bull Run Over? Will Nifty Return to 19K? | Nifty50 Wave AnalysisWave has already shared the Nifty wave counting (2020-24) earlier. Please refer to the following links:
Nifty Elliott Wave Analysis 2020-24 With Subordinates Counting
Strong Wave 5th is Happening: Nifty Wave Analysis in DTF
The big wave 5th of the impulse, which started from the 2020 COVID bottom, has hit 261.8%, and we have to go for a degree correction.
Three possibilities:
1. Rally Continues : Wave 5th can go in extension further if Nifty can sustain weekly candles above 24,127. It