ZINC: Pullback to Breaker Block-Watching for Trend ContinuationMCX:ZINC1!
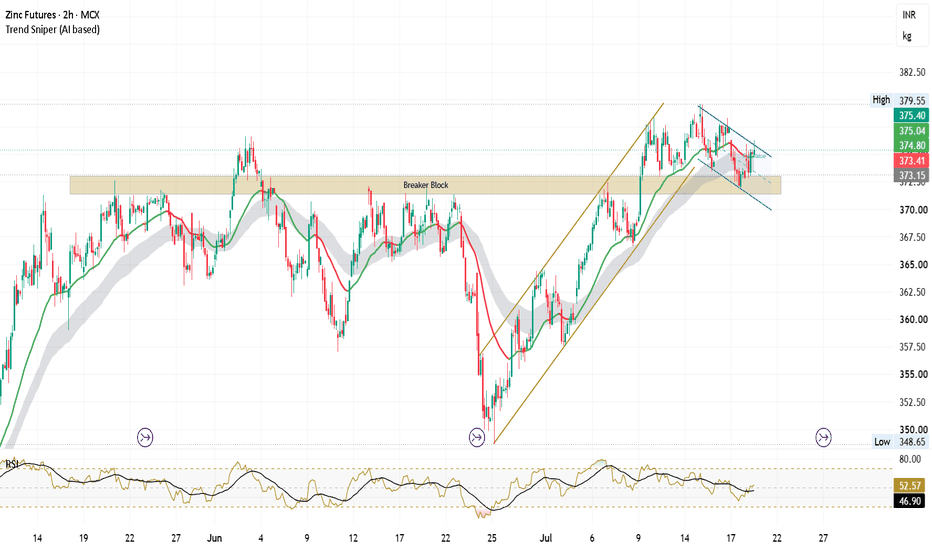
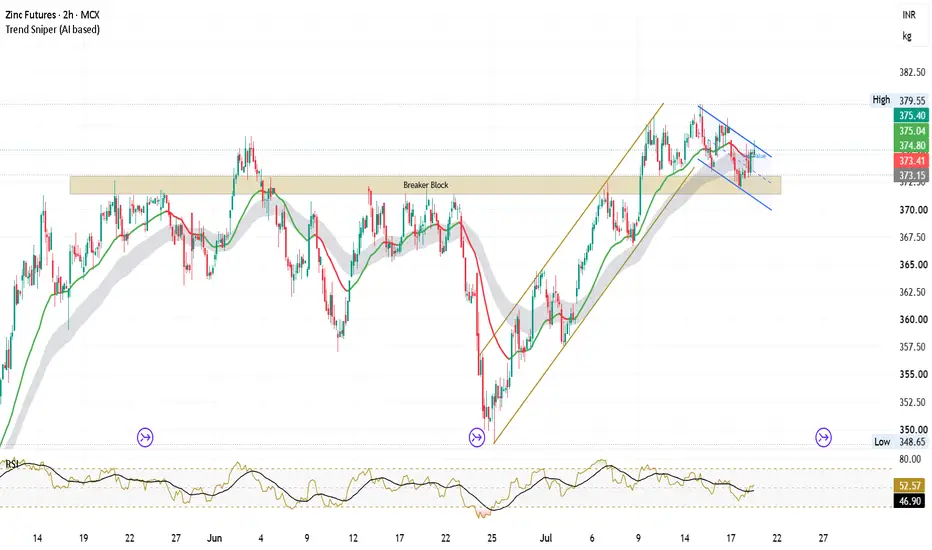
Zinc Futures are retesting a previously respected breaker block, which aligns with an important support zone after a strong impulsive rally.
The current decline appears corrective , forming a short-term falling channel while the broader market structure remains constructive. A sustained hold above the marked demand area, followed by a breakout from the channel, could indicate renewed bullish momentum.
For now, the reaction around this support zone remains the key area to watch.
Key Levels to Watch
Immediate Support : Breaker Block / Demand Zone around ₹372–373
Major Support : Previous swing low near ₹368–370
Immediate Resistance : Falling channel resistance
Major Resistance : Recent swing high around ₹379–380
Educational Note
This setup highlights how breaker blocks, trend structure, and corrective channels can work together to identify high-probability areas where demand may re-enter the market. Waiting for confirmation before acting is generally more prudent than predicting the next move.
Disclaimer: Shared for educational purposes only. This is not financial advice. Always wait for confirmation and manage risk appropriately.
Flag
Websol Energy System Ltd – Bullish Pennant/Flag Breakout WatchNSE:WEBELSOLAR | Chart: Daily | CMP: ₹104.29
Setup:
WEBSOL had a strong impulsive rally from the ~₹50 zone in March 2026 to ~₹130 in April — a sharp "flagpole" move on rising volume. Since then, the stock has been consolidating in a tightening descending/symmetrical wedge pattern for nearly 3 months, with lower highs and a flattening base near ₹95–100.
This structure resembles a classic bullish flag/pennant continuation pattern.
Key levels:
Flagpole base: ₹50
Flagpole high: ₹130
Consolidation support: ₹95–100
Trendline resistance (upper boundary of flag): ~₹110–115
Breakout trigger: Close above ~₹110 with volume expansion
Projected targets (if breakout confirms):
Using the measured-move method (flagpole height added from breakout point):
Target 1: ₹150–160
Target 2: ₹185–200
Invalidation:
A daily close below ₹95 would invalidate the bullish structure and suggest continuation of the range/consolidation rather than a breakout.
Volume note:
Volume has been relatively muted during the consolidation phase (typical for flags), but a genuine breakout should ideally come with a noticeable volume spike above the recent average — without that, treat any upside move with caution as it could be a false breakout.
Disclaimer:
This is purely a technical pattern observation for educational purposes, not investment advice. Flags/pennants don't always resolve in the expected direction — always confirm with volume, price action, and your own risk management before acting.
L&T Technology Services (LTTS) | Bull Flag on 15-Min ChartL&T Technology Services (LTTS) | Bull Flag on 15-Min Chart | Short-Term Momentum Setup
After a strong impulsive rally, LTTS is taking a healthy pause inside a Bull Flag (falling channel). Instead of giving back gains aggressively, the stock is consolidating near the highs, which is generally a sign of strength.
The current structure suggests that buyers are absorbing supply, and a breakout above the flag could trigger the next leg of the uptrend.
Why I’m Bullish
* Strong momentum move followed by controlled consolidation.
* Price continues to hold above immediate support around ₹3,500.
* The falling channel represents a classic bullish continuation pattern.
* Risk-to-reward remains favorable as long as the lower boundary of the flag holds.
Levels to Watch
📈 Entry: Above ₹3,520 (15-minute closing basis)
🛑 Stop Loss: ₹3,470
🎯 Target 1: ₹3,580
🎯 Target 2: ₹3,640
🎯 Target 3: ₹3,705–3,715
Trading Plan
A decisive breakout with increased volume would confirm the continuation pattern. Until then, patience is key. Avoid anticipating the breakout—let the market confirm the move.
If the stock closes below ₹3,470, the setup becomes invalid and it’s better to wait for a fresh structure.
⸻
Chart Summary
Entry: Above ₹3,520
Stop Loss: ₹3,470
Target 1: ₹3,580
Target 2: ₹3,640
Target 3: ₹3,705–3,715
⸻
Disclaimer: This analysis is purely based on price action and chart structure. It is shared for educational purposes only and should not be considered investment or trading advice. Always manage your risk and position size.
⸻
If you like to see more posts, please do show appreciation by liking this post and following me on:
in.tradingview.com
Bullish Flag Chart Pattern Bullish Flag Chart Pattern
-------------------------------------------------------------
Overview
The Bullish Flag Chart Pattern is a continuation pattern that typically develops after a strong bullish impulse. Following the initial upward move, price enters a temporary consolidation phase within a downward-sloping channel. This pause allows the market to absorb profit-taking before the prevailing trend attempts to resume. A confirmed breakout above the flag may indicate the continuation of the existing bullish trend.
---------------------------------------------------------------
Definition
A Bullish Flag consists of two main components: a strong upward movement known as the flagpole followed by a downward-sloping consolidation known as the flag . The consolidation represents a temporary pause in bullish momentum rather than an immediate trend reversal. The pattern is considered complete only after price confirms a breakout above the upper trendline.
--------------------------------------------------------------
Concept
The Bullish Flag reflects a healthy pause within an established uptrend. During consolidation, buyers and sellers temporarily reach equilibrium while the market digests the previous advance. As selling pressure gradually weakens and buyers regain control, price may attempt to continue in the direction of the prevailing trend.
--------------------------------------------------------------
Chart Explanation
- A strong bullish impulse forms the **flagpole**.
- Price consolidates within a downward-sloping channel.
- The channel represents a temporary pause in the prevailing uptrend.
- The upper trendline acts as dynamic resistance during consolidation.
- The lower trendline provides temporary structural support.
- A confirmed breakout above the flag may signal bullish trend continuation .
--------------------------------------------------------------
Key Observations
- Strong buying momentum creates the initial flagpole.
- Price remains confined within a downward-sloping channel.
- The consolidation phase develops after a sharp upward move.
- Buyers gradually regain strength near the upper boundary.
- The broader bullish structure remains valid while the flag is respected.
--------------------------------------------------------------
Why It Matters
Understanding the Bullish Flag helps market participants recognize temporary consolidations within an existing uptrend. Instead of interpreting every pullback as a reversal, this pattern demonstrates how markets often pause before continuing in the direction of the prevailing trend. Waiting for breakout confirmation encourages a disciplined approach to price action analysis.
-------------------------------------------------------------
Conclusion
The Bullish Flag is a classic continuation pattern that combines a strong bullish impulse with a period of orderly consolidation. While the pattern remains intact, the flag boundaries define the current market structure. A confirmed breakout above the upper trendline may indicate the continuation of bullish momentum, whereas failure to maintain the structure may result in extended consolidation.
-------------------------------------------------------------
⚠️ Disclaimer
📘 For educational purposes only.
🙅 Not SEBI registered.
❌ Not a buy/sell recommendation.
🧠 Purely a learning resource.
📊 Not Financial Advice .
MSTC Ltd. – Bull Flag After a Strong Impulsive Move?After a sharp vertical rally from the ₹450 zone to around ₹725, MSTC has been consolidating inside a well-defined bull flag. This type of consolidation often acts as a pause before the next leg higher if buyers regain control.
The recent pullback has remained orderly without giving back a significant portion of the previous impulse, suggesting that the broader trend is still intact.
A decisive breakout above the upper boundary of the flag could trigger the next momentum move. Using the flagpole projection, the measured target comes near ₹955–960, offering an attractive risk-to-reward setup.
As always, confirmation is more important than anticipation. Waiting for price to reclaim the flag resistance with strong participation increases the probability of a successful trade.
Trade Setup
Entry: ₹725–735 on confirmed breakout above the flag
Stop Loss: ₹670 (below the flag support)
Target 1: ₹820
Target 2: ₹900
Final Target: ₹955–960 (Flag Pole Projection)
Invalidation: A decisive close below ₹670 would weaken the bullish structure and invalidate the setup.
This analysis is purely for educational purposes and should not be considered investment advice. Always manage your risk before taking any trade.
If you like to see more posts, please do show appreciation by liking this post and following me on:
in.tradingview.com
Adani Energy Solutions: Multi-Year Breakout Signals new UptrendAdani Energy Solutions: Multi-Year Breakout Signals Potential Start of a New Uptrend ⚡📈
Adani Energy Solutions has finally broken above a multi-year consolidation range, a development that often marks the beginning of a sustained trending phase.
Key Observations
• Price spent nearly 2.5 years consolidating within a broad range, allowing supply to be absorbed.
• A decisive breakout above the range has shifted the long-term trend in favor of the bulls.
• The current consolidation near the highs appears constructive and resembles a healthy pause after the breakout rather than a reversal.
As long as the stock continues to hold above the breakout region, the primary trend remains positive.
Key Levels
* Support: 1450–1500
* Immediate Resistance / Target: 1875
Long-Term Targets
🎯 Target 1: 1875
🎯 Target 2: 2800
🎯 Target 3: 3400
A sustained move above the first target could open the door for the next phase of the long-term trend.
My view:
Multi-year breakouts often create some of the strongest positional opportunities. While short-term volatility is always possible, the overall structure remains constructive as long as the breakout zone continues to hold.
Not financial advice. Always manage your risk.
#AdaniEnergySolutions #PowerSector #TechnicalAnalysis #SwingTrading #NSE #ChartAnalysis #BreakoutTrading
If you like to see more posts, please do show appreciation by liking this post and following me on:
in.tradingview.com/u/lovishkhanduja/
Zydus Lifesciences: Bullish Pennant After Strong RallyZydus Lifesciences: Bullish Pennant After Strong Rally | Continuation Setup 📈
Zydus Lifesciences is showing a strong bullish continuation structure after a sharp impulsive move.
Previously, the stock delivered a clean Inverse Head & Shoulders breakout, however the target didnt hit at the right time and the breakout could not sustain. Now, price appears to be forming another bullish continuation setup.
Key Observations:
• Strong breakout rally forming the flagpole
• Tight consolidation near highs
• Higher lows indicating sustained buying pressure
The current structure resembles a bullish pennant / tight flag, which often acts as a continuation pattern in strong uptrends.
Breakout Zone
A decisive breakout above 1125–1145 can confirm the next leg higher.
Targets
🎯 Target 1: 1225
🎯 Target 2: 1326
🎯 Extended Target: 1400+
Risk Management
Key support lies near 1045–1080.
A breakdown below this zone weakens the bullish setup.
My view:
Bulls remain in control as long as price holds the consolidation range. A clean breakout may trigger fresh momentum.
Not financial advice. Manage risk properly.
#Zydus #PharmaStocks #TechnicalAnalysis #SwingTrading #ChartAnalysis #NSE
If you like to see more posts, please do show appreciation by liking this post and following me on:
in.tradingview.com/u/lovishkhanduja/
Adani Energy Solutions Ltd. – Daily Chart ReviewAdani Energy Solutions Ltd. – Daily Chart Review
Adani Energy Solutions continues to trade in a strong primary uptrend, but the price has spent the last several weeks consolidating in a narrow range between ₹1,465 and ₹1,560. This appears to be a healthy pause after a sharp impulsive rally rather than a sign of trend reversal.
Technical Observations
* Rectangle Consolidation: Price is respecting a well-defined sideways range. Such consolidations often act as continuation patterns when they occur after a strong rally.
* Trend Structure: Higher highs and higher lows remain intact on the daily timeframe, indicating bulls are still in control.
* Volume: Volume has moderated during consolidation, which is constructive. A breakout accompanied by above-average volume would significantly improve the probability of trend continuation.
* RSI: RSI is around 61 and has turned upward after cooling off from earlier highs. This suggests bullish momentum is rebuilding. No major bearish divergence is visible at the moment.
Key Levels
* Immediate Resistance: ₹1,560–1,565
* Major Support: ₹1,465
* Positional Support: ₹1,250
Trading Plan
Bullish Scenario
* A decisive daily close above ₹1,560–1,565 with strong volume can trigger the next leg of the uptrend.
* Possible upside targets:
* ₹1,650
* ₹1,730
* ₹1,820 (if momentum remains strong)
Bearish Scenario
* Failure to hold ₹1,465 may result in profit booking towards ₹1,380–1,350 initially.
* The broader trend remains bullish unless the stock starts closing below ₹1,250.
Conclusion
The stock is showing characteristics of a bullish continuation setup. Consolidation after a sharp advance generally strengthens the trend by allowing momentum indicators to cool off. Traders should watch for a high-volume breakout above the range rather than anticipating it prematurely. Until the range is resolved, expect choppy price action.
Disclaimer: This analysis is for educational purposes only and reflects my personal interpretation of the chart. Please conduct your own research and manage risk appropriately before making any investment decisions.
PNC INFRATECH LTD (NSE) | DAILY CHART | BULL FLAG BREAKOUTPNC Infratech is showing a bull flag pattern on the daily timeframe .
Structure :
Sharp impulsive rally (flag pole) from the March lows into April
Price consolidated in a descending flag channel, holding above the demand zone (215–225)
Breakout candle confirms move out of the flag channel with strong volume/momentum
Trade Setup:
Entry/Trigger: Breakout above flag channel resistance
Stop Loss: 194.50 (below demand zone)
Target 1: 292.10 (~48% of flag pole projection)
Target 2: 316.35 — trail stops after Target 1 is hit
Projection Basis:
Targets are projected using the measured-move method — the % gain of the flag pole is applied from the breakout point, a common technique for flag/pennant continuation patterns.
Disclaimer: Not investment advice — for educational purposes only. Manage risk and position size according to your own plan.
Olectra Greentech: History Repeating? Another Bull Flag SetupOlectra Greentech: History Repeating? Another Bull Flag Setup in EV Sector 🚍⚡
Olectra Greentech appears to be forming a multi-year bull flag / descending channel, similar to its previous major accumulation phase.
Key Observations:
• Previous bull flag delivered a strong breakout and target completion
• Current structure shows a similar consolidation pattern after a sharp impulse move
• Price is approaching the upper boundary of the descending channel
The 980–1000 zone has acted as strong long-term support and remains critical for bullish structure.
Bullish Trigger
A decisive monthly breakout above the channel resistance (1560–1650) with strong volume can confirm the next major leg up.
Targets
🎯 Target 1: 1640
🎯 Target 2: 1900–2000
🎯 Extended Target: 2400+
Risk
A sustained breakdown below 980 weakens the bullish setup.
My view:
The structure is promising, but this remains a pre-breakout setup until resistance is decisively cleared.
Not financial advice. Manage risk properly.
#Olectra #EVStocks #TechnicalAnalysis #SwingTrading #NSE #ChartAnalysis
If you like to see more posts, please do show appreciation by liking this post and following me on:
in.tradingview.com/u/lovishkhanduja/
Satin Creditcare — Flag & Pole Pattern Signaling Continuation?Satin Creditcare — Flag & Pole Pattern Signaling Continuation? 🚩
Satin Creditcare appears to be forming a classic bullish flag-and-pole continuation pattern after a sharp impulsive rally.
The stock rallied strongly from the ₹140 zone to ₹240, and has since been consolidating in a tight range — often a sign of healthy profit booking before the next move.
Key levels to watch:
* Breakout zone: ₹240–245
* Support / Stop-loss zone: ₹220
* Consolidation base: ₹205
A decisive breakout above ₹245 with strong volume could trigger the next leg higher.
Potential upside targets:
* Target 1: ₹274
* Target 2: ₹309 (Fibonacci extension)
* Target 3: ₹345–350 (flag & pole measured move)
The tighter the consolidation near highs, the stronger the probability of a continuation breakout.
Keep this one on the radar for a momentum move. 📈
Disc: Not SEBI registered. For educational purposes only. Please manage risk.
✅ If you like my analysis, please follow me here as a token of appreciation :)
in.tradingview.com
NACL Industries Ltd. – Bull Flag Breakout Attempt | High Volume NACL Industries Ltd. – Bull Flag Breakout Attempt | High Volume Confirmation
After a prolonged consolidation between ₹155–₹177, the stock has finally delivered a strong range breakout with exceptional volume, indicating aggressive institutional participation.
The recent rally from the breakout zone paused near ₹210, where price formed a bull flag / pennant. Today’s candle has closed above the flag resistance with another surge in volume, suggesting the continuation of the uptrend.
Technical Observations
* ✅ Multi-week consolidation breakout already confirmed.
* ✅ Bull Flag breakout after a sharp impulsive move.
* ✅ Fresh volume expansion supports the breakout.
* ✅ RSI around 68—strong momentum without entering extreme overbought territory.
* ✅ Price is making higher highs and higher lows, maintaining bullish market structure.
Key Levels
* Immediate Resistance: ₹220–223 (today’s closing zone)
* Next Targets: ₹240 → ₹255 → ₹270
* Major Support: ₹197 (flag breakout level)
* Strong Demand Zone: ₹182.5–177
* Invalidation: Sustained close below ₹197 may result in a retest of the ₹182–177 zone.
Trading Plan
* Aggressive traders may consider entries on sustained trade above ₹221–223 with strong volume.
* Conservative traders can wait for a pullback and successful retest of ₹197–205 before initiating fresh positions.
* Trail stop-loss below each higher low instead of booking profits too early if momentum continues.
Risk Factors
The stock has rallied sharply in a short period. A brief consolidation or pullback would be healthy and should not be viewed as bearish as long as ₹197 remains intact.
⸻
Disclaimer: This analysis is purely for educational purposes and reflects my personal interpretation of the chart. Please do your own research and use proper risk management before taking any trading decision.
Pole & Flag Pattern : Understanding the Story BehindPole & Flag Pattern :
Markets move in phases: impulse, consolidation, and continuation . The Pole & Flag pattern represents this natural rhythm of price action.
A pole is the strong directional move where buyers or sellers aggressively take control. This phase is usually supported by increasing volume, showing strong participation and momentum.
After a sharp move, the market often pauses. This creates the flag, a short consolidation phase where early participants book profits and new participants enter. A healthy flag is usually smaller than the pole, with controlled retracement and decreasing volatility.
The real opportunity comes when price breaks out of the flag structure.
✅ A quality Pole & Flag setup usually has:
• Strong impulsive pole
• Controlled retracement (not a deep reversal)
• Tight consolidation
• Volume expansion on breakout
• Price closing above the flag boundary
For a bullish setup:
Pole = buyers gaining control
Flag = temporary pause / absorption
Breakout = continuation of demand
Target projection is commonly measured using the pole height from the breakout point.
However, remember:
A pattern is not a guarantee. The context matters:
• Overall market trend
• Volume behavior
• Support and resistance zones
• Risk-to-reward before entry
The pattern is not about drawing two lines — it is about understanding the market psychology behind accumulation, hesitation, and renewed momentum.
📈 Price tells the story. Volume reveals participation.
Few other examples:
NSE:IOLCP
NSE:MOTILALOFS
NSE:AEROENTER
==============================================================================
Disclaimer:
This post is purely for educational and technical analysis purposes. I am not a SEBI registered analyst. This is not a recommendation to buy, sell, or hold any security. Markets involve risk; always do your own research and follow proper risk management.
Jana Small Finance Bank — Compression Near Resistance, BreakoutJana Small Finance Bank looks interesting after a strong recovery from the ~₹330 zone.
After rallying sharply, price has entered a consolidation box between ₹440–₹505, indicating healthy absorption rather than aggressive profit booking.
Key levels to watch:
* Support: ₹440–445
* Resistance / Breakout level: ₹505
A decisive breakout and close above ₹505 could trigger the next leg higher.
Upside target: ₹600+ (~35% potential)
Invalidation: Sustained move below ₹440 may weaken the bullish structure.
The longer price spends consolidating near resistance, the stronger the eventual move can be.
Patience may reward here. 📈
Disc: Not SEBI registered. For educational purposes only. Please manage risk.
✅ If you like my analysis, please follow me here as a token of appreciation :)
in.tradingview.com
Coffee Day Enterprises — Deep Value Reversal Brewing?Coffee Day Enterprises — Deep Value Reversal Brewing? ☕
Coffee Day Enterprises Limited is showing signs of a potential long-term reversal after spending months near major historical support.
The monthly chart highlights a strong base around ₹21–22, while the weekly chart suggests price is attempting to build higher lows after recent accumulation.
Technical Setup:
✅ Strong long-term support near ₹21
✅ Weekly recovery from recent lows
✅ Potential momentum trigger above ₹43.3
✅ Major breakout confirmation above ₹51
Right now, the stock remains in an accumulation phase. The real move begins only once overhead resistance gets absorbed.
Trade Plan:
Accumulation Zone: ₹30–34
Aggressive Add: Near support on dips
Fresh breakout buy: Only above ₹43.3
Stop Loss:
₹28 closing basis
(Positional traders can keep wider SL near ₹21 depending on risk appetite)
Targets:
🎯 Target 1: ₹43.3
🎯 Target 2: ₹51
🎯 Target 3: ₹62–67
Major breakout trigger:
A decisive breakout above ₹51 can open the path toward ₹66–70 (weekly Fibonacci projection).
My View:
This is clearly not a low-risk setup — volatility is high and fundamentals remain weak versus stronger consumer names.
This is more suitable for traders comfortable with speculative turnaround plays.
Fundamentals Snapshot:
* Operates under the well-known Café Coffee Day brand.
* Business restructuring and debt reduction remain key monitoring factors.
* Turnaround potential exists, but balance-sheet risk is still elevated.
* Needs sustained profitability improvement for long-term rerating.
Risk:
Failure to hold ₹28 may lead to retest of major support near ₹21.
Disclaimer:
This analysis is for educational purposes only and not financial advice. Small-cap / turnaround stocks carry elevated risk. Please manage position sizing carefully.
✅ If you like my analysis, please follow me here as a token of appreciation :)
in.tradingview.com
Bullish Continuation.Bullish Continuation.
The breakout from a multi-year consolidation pattern usually carries high-probability momentum. As long as SUNPHARMA sustains daily closes above the immediate support shelf ($1,830 - 1,850$ INR), the path of least resistance remains firmly to the upside, targeting a breakout into unchartered territory above $1,920$ INR
AUDJPY Bearish ScenarioOn Daily chart it created a bearish divergence. Since then, its trading within the channel.
On top of it There is a sharp retracement from its daily FVG within the channel.
I am still waiting for it to cross my Bearish Area to go Bearish and eying onto 109.50
Sell around 112.25 area but wait for breakdown and then price retracement. A bearish closing after touching 112.25 will give us a buy entry.
SL: will be determind upon entry if there is any retracement done.
Target 1: 111.25
target 2: 109.42
Apollo Hospitals – Bullish Flag with PoleApollo Hospitals has successfully completed a Bullish Flag pattern, a classical continuation setup that usually forms after a strong impulsive rally.
The stock witnessed a sharp upside move forming the flag pole, followed by a controlled downward consolidation within a falling channel. The recent price action suggests that the consolidation phase is over and the stock is attempting to break out of the flag structure, indicating renewed buying momentum.
A notable feature of this setup is the declining volume during the flag formation, which suggests that the correction was primarily due to profit booking rather than aggressive selling. This improves the reliability of the bullish continuation pattern.
Technical Observations:
1. Bullish Flag pattern completed
2. Strong flag pole indicating bullish strength
3. Consolidation inside a falling channel
4. Volume declined during correction phase
5. Breakout attempt visible near flag resistance
6. RSI above 60 indicating positive momentum
Outlook: If price sustains above the breakout zone on a closing basis, the stock may witness further upside momentum. The overall structure remains bullish as long as the breakout level holds. The combination of strong trend, healthy consolidation, and improving momentum makes Apollo Hospitals an interesting stock to watch in the short term.
Disclaimer: This research is only for educational purposes and not investment advice. Please consult your registered financial advisor before investing. I am only a SEBI Certified Research Analyst.
Sona BLW Precision Forgings (SONACOMS) – Daily ChartSona BLW Precision Forgings (SONACOMS) – Daily Chart -Breakout/breakdown Awaited
The stock has been consolidating in a well-defined range between ₹565 and ₹607 for the last several weeks after a sharp upmove. This type of sideways movement often acts as an accumulation phase before the next directional move.
Key Observations:
* Price is trading near the upper boundary of the consolidation zone (₹607).
* Multiple attempts to cross ₹607 have faced resistance, making it a crucial breakout level.
* Volume has declined during consolidation, indicating volatility compression.
* RSI is around 56, holding above the 50 mark, which suggests a mildly bullish bias.
Trading Levels
Bullish Scenario
* Sustained close above ₹607 may trigger a breakout.
* Immediate targets: ₹650–₹680
* Positional targets: ₹714 and ₹759
Bearish Scenario
* Breakdown below ₹565 could invalidate the setup.
* Downside support zones: ₹540 and ₹520
Pattern View
The chart resembles a rectangle/consolidation pattern after an impulsive rally.
Support: ₹565, ₹540
Resistance: ₹607, ₹650
Targets: ₹714, ₹759
Disclaimer: This analysis is for educational purposes only and should not be considered investment advice. Please conduct your own research and use proper risk management before taking any trade.