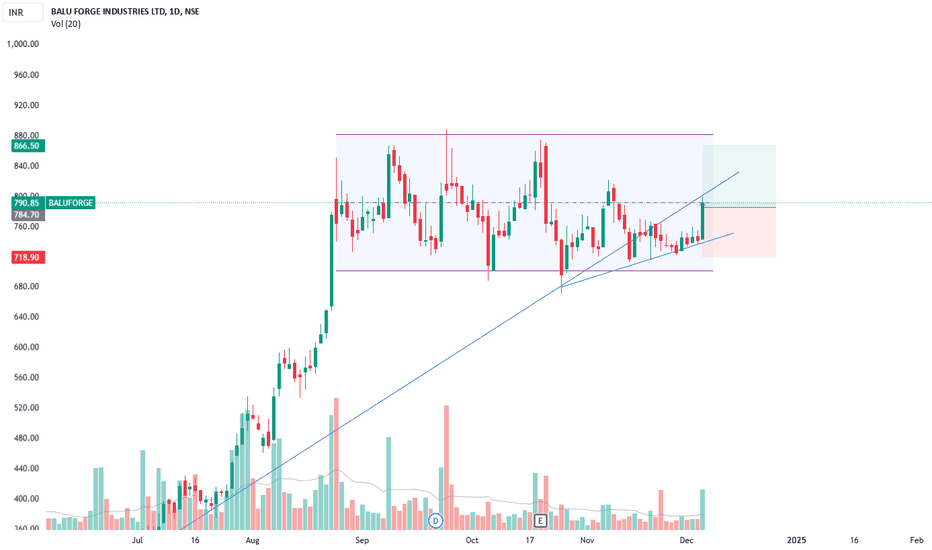
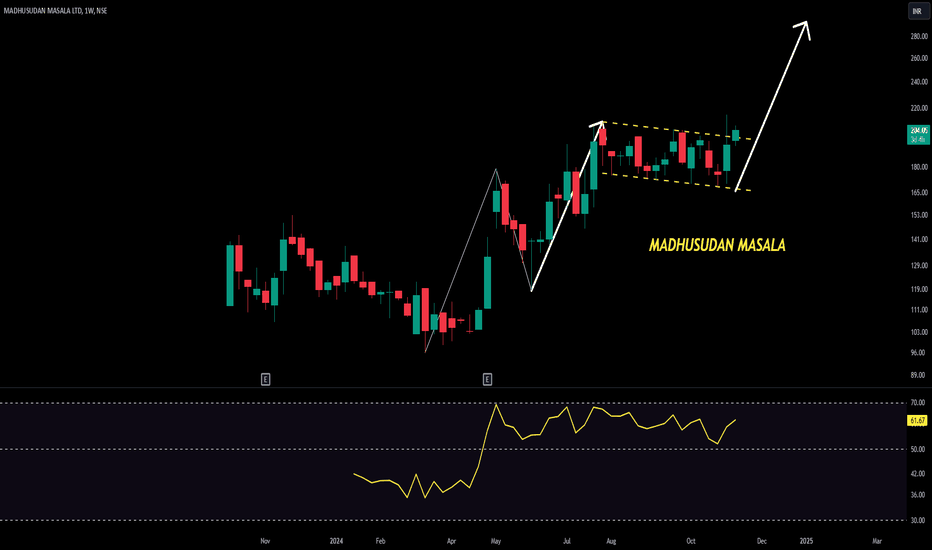
Ramco cements bullish triange flagRamco cements above 1010 super bullish and targets are intact as above. But ones it breaks 1010 1000 below then this analysis will be failed and it can take down turn to fill the triangle pattern. But that chances are low unless market takes bearish turn.
Keep this in mind. Options is a dangerous instrument to play. Please do not go wild on anything unless you know exactly what you doing. Even though your direction is right still you tend to loose in option buying. And market can always prove me wrong and i take that rights too. Experience traders also fail in this market. Only risk management will give you an edge. Don’t take any trades without SL. Respect the market, Ungli nahi katoge to pura hath katna padega. Beware.
DISCLAIMER: I AM NOT SEBI REGISTERED ANALYST. ALL POSTS ARE EDUCATIONAL PURPOSES.NON ADVISORY, DISCRETIONAL NO CLAIMS, RIGHTS RESERVED. I AM NOT RESPONSIBLE FOR YOUR PROFIT OR LOSS.
Flag
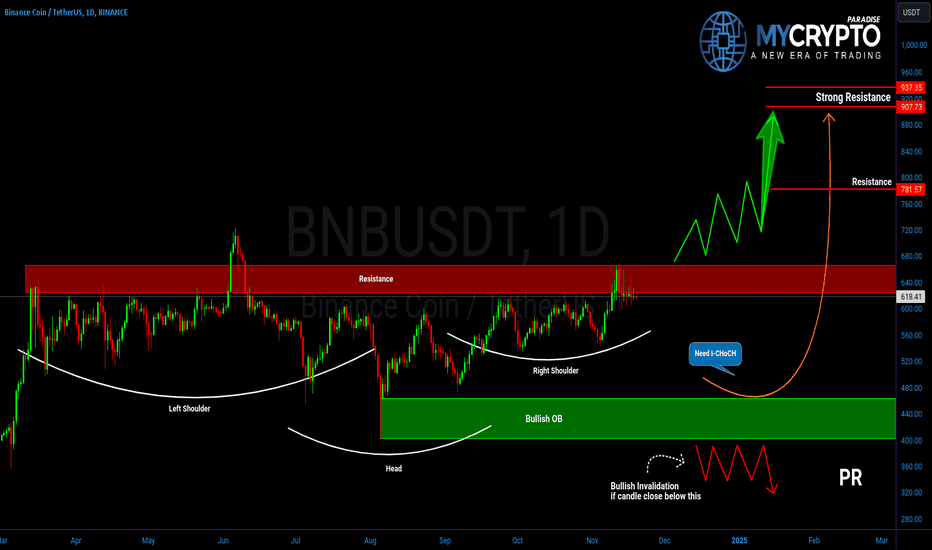
BNBUSDT: A Bullish Setup or a Trap? Key Levels to WatchYello Paradisers! Have you noticed the recent move in BNBUSDT? 📈 Could this be the breakout we’ve been waiting for, or is a retracement lurking in the shadows? Let’s break it down.
💎BNBUSDT has recently formed an inverse head and shoulders pattern, which also aligns with a bull flag formation on the higher timeframe—both strong indications of bullish potential. However, as disciplined traders, we must remain cautious and consider all scenarios.
💎If BNBUSDT breaks out and closes a candle above the resistance zone, the likelihood of a sustained bullish move significantly increases. This would confirm the breakout and signal a potential rally.
💎On the other hand, the probability of a retracement remains on the table. Should this happen, we would look for a bounce from the bullish order block (OB). To further increase the probability in our favor, waiting for a bullish internal change of character (I-CHoCH) would be prudent before entering any positions.
💎However, in the case of a breakdown with a candle close below the Bullish OB, the entire bullish idea would be invalidated. If this happens, patience will be key—waiting for stronger price action at better levels will provide higher-probability setups.
🎖This is why, Paradisers, we emphasize the importance of strategy and discipline in trading. Whether it's a breakout or breakdown, sticking to your plan is the only way to achieve long-term success. Stay vigilant, stay patient, and always trade smart. 💪
MyCryptoParadise
iFeel the success🌴
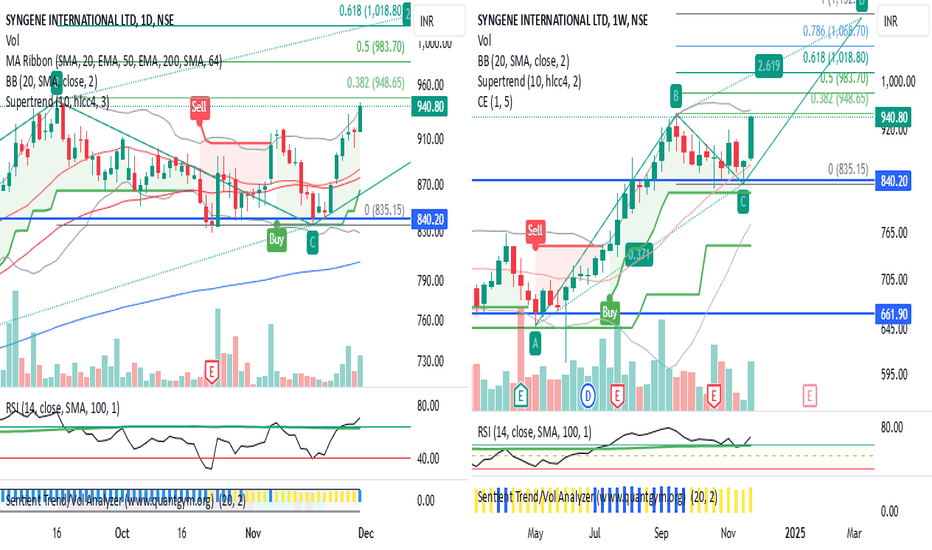
SYNGENE INTERNATIONAL A STOCK IN MOMENTUM Syngene International Ltd. is an interesting chart in momentum with following
1. RSI on all time frames (DWM) above 60
2. Narrowing Bollinger Bands on daily chart with price walking on upper band
3. Huge Anchor candle formed on weekly chart with high volume
4. Major price supports
20 SMA (daily) 883
50 EMA (daily) 875
20 SMA (Weekly) 864
Super Trend (daily) 864
with cluster of supports in zone of 864 to 885 and Fibonacci extension targets of 980-1018-1068 stock can be good risk reward option to keep on radar
Lets See How it Evolves.
Disclaimer: NOT A BUY / SELL RECOMMENDATION I am not an expert I just share interesting charts here for educational purpose and not to be taken as buy/sell recommendation. Please seek expert opinion before investing and trading as trading/ investing in market is subject to market risks. I do not hold any position in the stock as on date but I may look to take some position with my own Risk Reward matrix.
XAU USD From Dec 2nd to Dec 6th (target1000 pips )These levels are valid from Dec 2nd to Dec 6th.
XAUUSD should touch 2672 and from 2672 to 2674 we can see good selling opportunity SL can be 2681 and target 2562 and 2552 is the last target(1000 pips).
From 2649 we can see good buying opportunity up to 2569 (200 pips).
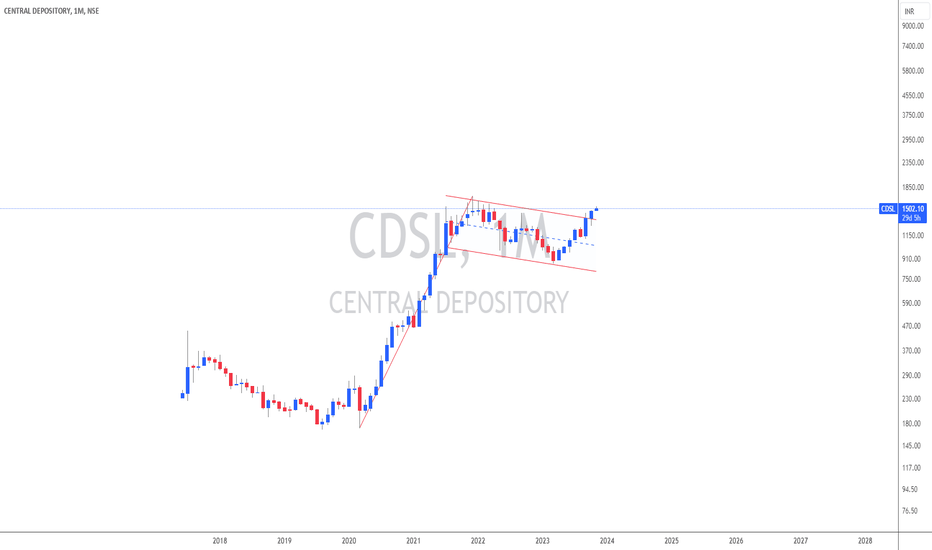
Trent - Perennial bullishnessTrent is a consistently bullish stock, offering strong long-term investment opportunities.
Key Points:
1.] The stock maintains its bullish momentum by consistently taking support at the uptrend line.
2.] Frequent formation of flag patterns indicates a continuation of its upward trajectory.
3.] The stock rarely dips below the 360-day moving average, making it an excellent buy when near this level for long-term gains.
Dixon Tech either buy or wait to buy??
Dixon is trading in a parallel channel for a while and now it is holding on to the higher levels.
The company is a EMS (Electronic Manufacturing Services) and provides them to the listed companies.
On the monthly charts, the stock has been travelling and given 150% returns in the current year.
Much of the movement is given this year and still the targets of 20k is being recommended by some rating services company.
As for now the stock is holding on to the higher levels and creating a Flag and pole pattern.
400 points range the stock is consolidating and the bullish flag break out can take the stock to the higher levels.
A low volume accumulation in happening in the stock and the target levels of around 17800 can be seen in the coming weeks.
Targets :- 16700, 17700
Wait for the price action around the break out level and enter as per the setup.
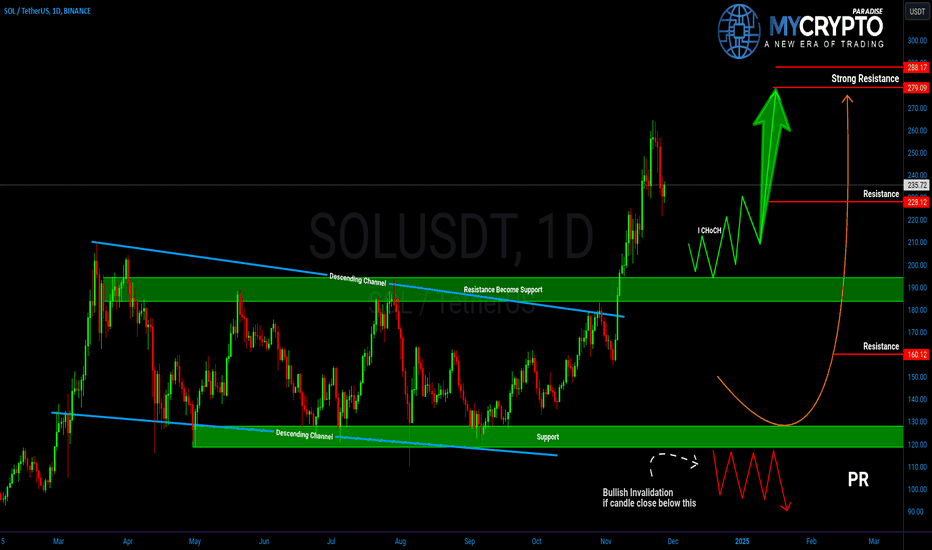
Will SOLUSDT’s Breakout Trigger the Next Bullish Wave?Yello Paradisers! SOLUSDT has delivered an impressive move, breaking out of a descending channel—commonly referred to as a bull flag in higher timeframes. This formation typically signals continuation after a period of consolidation, where the channel resembles a flag following a strong bullish pole.
💎If SOLUSDT retests the broken resistance zone and forms a bullish I-CHoCH (Internal Change of Character) in lower timeframes, this would significantly increase the probability of a continuation toward the next major resistance levels.
💎Should the market experience panic selling, patience will be crucial. Waiting for the price to reach the key support zone below could offer a potential bounce. However, to confirm this move, look for a bullish I-CHoCH to ensure higher confidence before entering any positions.
💎On the flip side, if SOLUSDT breaks below the support zone and closes a candle beneath it, this would invalidate the bullish scenario. In such a case, stepping back and waiting for a clearer, more favorable price action setup would be the wiser strategy.
Trading in such a dynamic environment requires discipline and adaptability. React to the price action with caution, follow the levels and confirmations discussed, and avoid impulsive decisions. This market rewards patience and precision. Stay focused, and let the opportunities come to you!
MyCryptoParadise
iFeel the success🌴
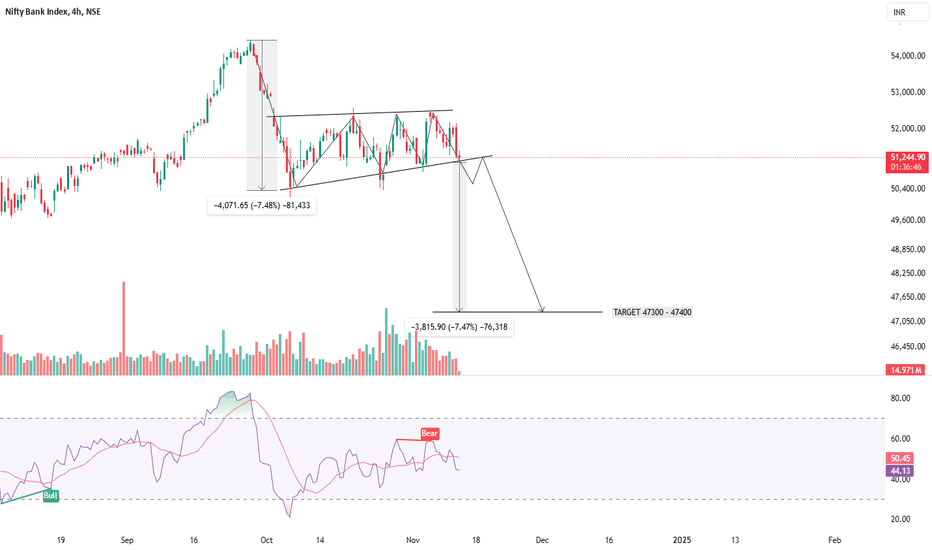
BEARISH FLAG IN BANK NIFTY - TIME FOR A SHORT TRADE ?Symbol - BANKNIFTY
CMP 51350
BankNifty has turned its trend from bullish to bearish & sideways making lows - lows on daily time frame & It was trading in a bearish channel. We can see a Bearish Flag pattern getting formed in BankNifty. Such patterns on larger time frame don't usually fail. BankNifty is currently trading near break down trendline of this pattern. Breakdown & sustaining below this trendline zone 51150 - 51000 will get this pattern activated & we can see big target towards downside.
Target on downside can be 47400
P.S. : My short position is already active from 51800
Disclaimer - Do not consider this as a buy/sell recommendation. I'm sharing my analysis & my trading position. You can track it for educational purposes. Thanks!
BULL FLAG PATTERN IN INDIA CEMENTS - POSITIONAL LONG TRADESymbol - INDIACEM
CMP - 353
India Cements is forming a Bullish Flag pattern after a good run. It is consolidating at higher levels & buyers are looking strong & not giving up. Breakout of this Flag pattern can lead the stock price towards 650 which is approx. 90% upside from current price. I have made a long position at CMP and will add more position around 390, which is breakout zone. Stoploss I am following is 330.
Disclaimer - Do not consider this as a buy/sell recommendation. I'm sharing my analysis & my trading position. You can track it for educational purposes. Thanks!
Morning Star + Flag pattern - Trend ReversalMorning Star - The Morning Star pattern is a classic bullish reversal pattern in technical analysis. The pattern consists of three candlesticks: two large ones with different directions and a smaller candlestick between them.
Flag Pattern - A sudden move in either direction followed by the price consolidates in a range following the sharp move, and the price then continues to move in the same direction after it breaks out of the range. Its visual resemblance to a flag and a pole
MEducation
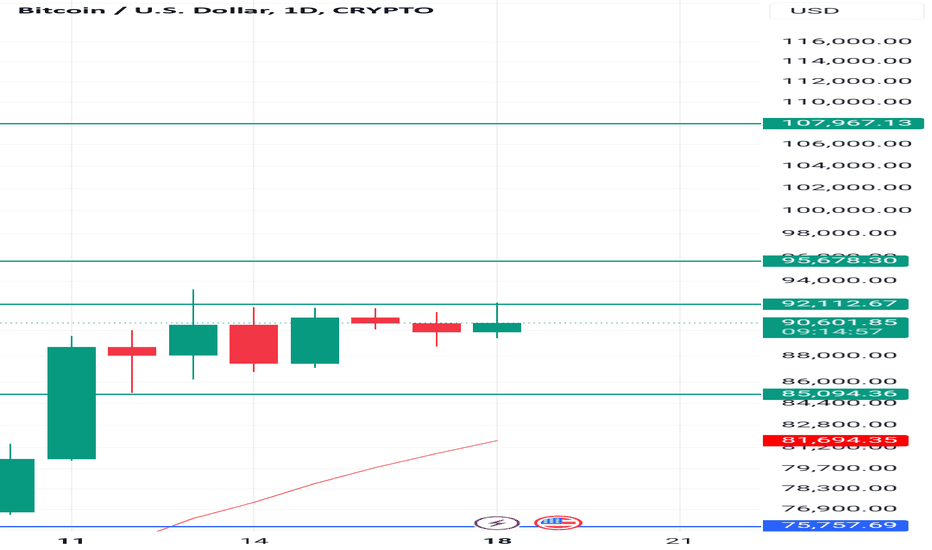
Bitcoin Strategy: Cup & Handle, Flag Pole, Parallel ChannelIf you're aiming to maximize gains using multiple setups across different timeframes, this strategy combines three powerful patterns: the Weekly Cup & Handle, Flag Pole, and Daily Parallel Channel. Here’s how to execute this structured approach for optimal entry, exit, and profit potential.
Weekly Cup & Handle
Timeframe: November 15, 2021 – October 14, 2024
Breakout: Achieved on October 14, 2024
Target: 82,000 (same as the Flag Pole)
The breakout from this long-term Cup & Handle pattern suggests strong bullish momentum and a solid foundation for long-term gains. This setup aligns with the target and stop-loss criteria from the Flag Pole pattern for a consistent strategy.
Weekly Flag Pole Pattern
Timeframe: October 16, 2023 – March 11, 2024
Target: 1 lakh
Stop Loss (SL): 66,000 (below the last swing low)
The weekly Flag Pole pattern reinforces the Cup & Handle trend, providing a shorter-term opportunity within the larger uptrend. Enter in tranches to capture initial momentum and add on pullbacks.
Daily Parallel Channel
Timeframe: March 5, 2024 – October 18, 2024
Breakout: October 18, 2024 (retest completed)
The breakout and retest of the daily Parallel Channel on October 18 offer a shorter-term entry point. Targeting 1 lakh on this setup aligns with the long-term patterns, with Target 1 at 82,000 and Target 2 at 1 lakh.
Execution Strategy
Enter in Tranches: Start your position now and add on each pullback.
Confirm Pullbacks: Look for a reversal on the daily candlestick pattern after each pullback.
Manage Risk: Keep the SL at 66,000, set below the last swing low, to protect your capital.
Summary of Targets
Target 1: 82,000 (aligned with Cup & Handle and Flag Pole)
Target 2: 1 lakh (Parallel Channel breakout)
By combining these setups, you capture both long-term and short-term price movements, maximizing your potential for profit while managing risk effectively.
Jupiter Infomedia - Ready to breakout for a good move!Jupiter infomedia made a tall pole breakout last year and since then it has been consolidating. Stock has shown great volume during the pole construction and even during the consolidation volume has shown growth with small spike regularly.
Stock is now showing potential to come out of its range and breakout from the flag pattern.
CMP 41
Potential upside of about 40%
Watch out for breakout before you dive-in
Disclaimer: I'm not a registered analyst. I'm only sharing my opinion on the platform for others to benefit in learning from my market understanding. Please do your due diligence before making a trade.