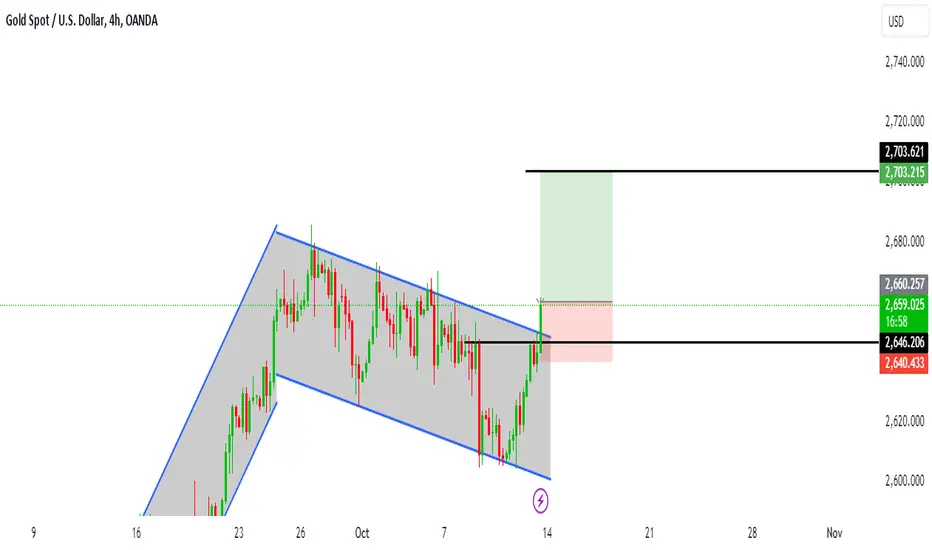
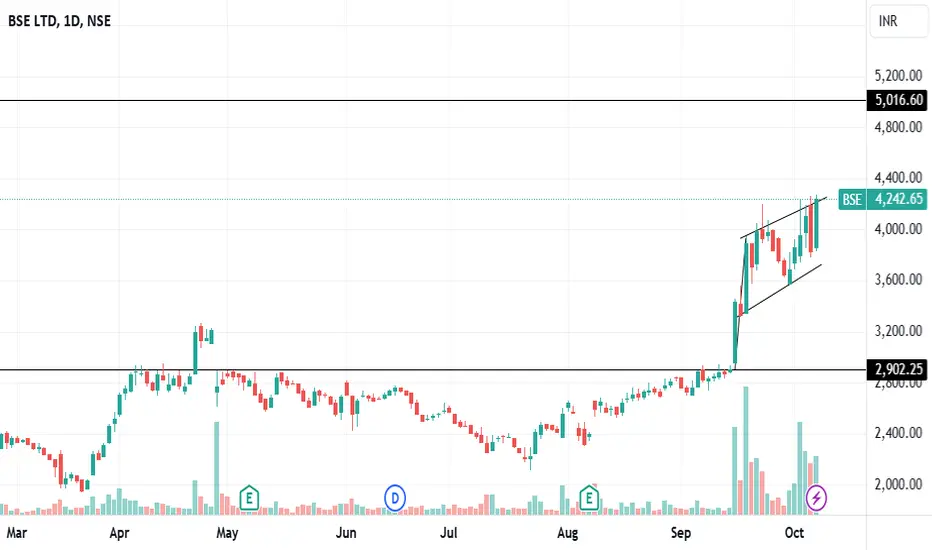
INDRAMEDCO - Bullish Flag PatternINDRAMEDCO - Has shown a Bullish Flag pattern in the Daily time frame - This shows strength in the stock and also means potential upside in the near future.
The company has a fantastic history and fundamentally has very attractive numbers, not only this is a good entry point for swing traders but also a good stock to hold for a long term.
Note: These views are personal and for informative/ educational purpose only. Please conduct your own research before making any investment decision.
Flag
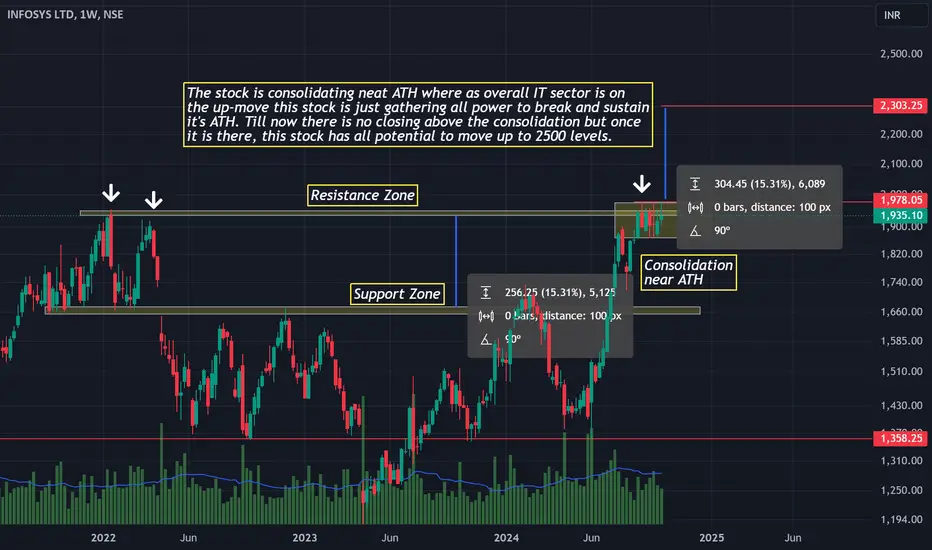
INFY: Consolidation near ATHThe stock is consolidating neat ATH where as overall IT sector is on the up-move.
This stock is just gathering all power to break and sustain it's ATH.
Till now there is no closing above the consolidation but once it is there, this stock has all potential to move up to 2500 levels.
DISC: The publication idea is just a technical analysis and should not be considered a buy or sell recommendation. Please consult your financial advisor before taking any trade.
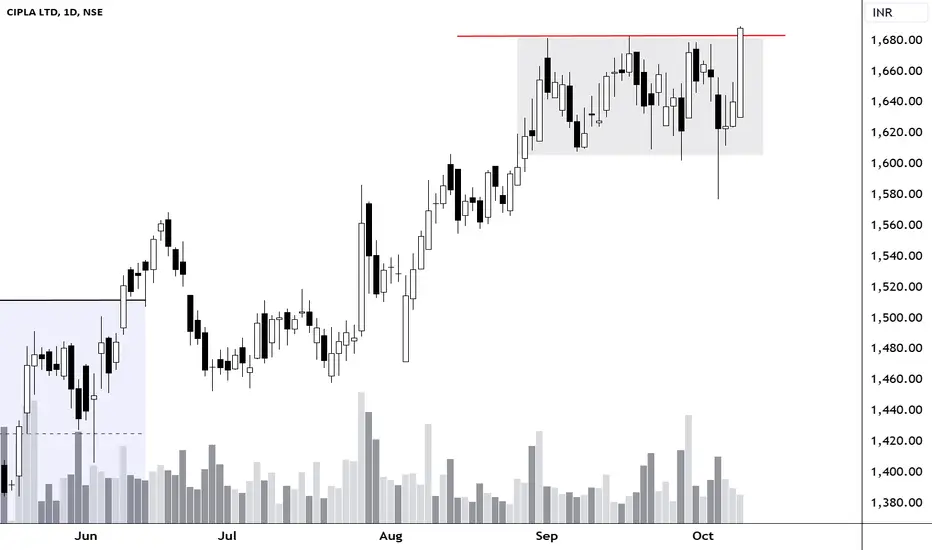
Cipla Pole and Flag patteStock Analysis Report for Cipla Limited
01. Pattern Analysis
Pattern Name: Pole and Flag Pattern
Cipla has formed a Pole and Flag pattern, which is a bullish continuation pattern. The flag represents a consolidation phase after a strong upward move (pole), typically occurring before a breakout to the upside. The stock is at its all-time high, with a breakout from a narrow consolidation range. This is a positive signal that indicates potential for continued upward movement.
02. Volume Analy
Morepen Lab - Bullish Flag and Fibonacci RetracementMorepen Lab has formed a bullish flag pattern, and today it has successfully broken out.
The price has retested the Fibonacci level at 38, where it formed a bullish piercing pattern, signaling potential upside momentum.
Price take support of 50 period EMA.
Additionally, this level coincides with a significant demand zone on the chart, suggesting strong buying interest. Keep an eye on this stock for further upward movement
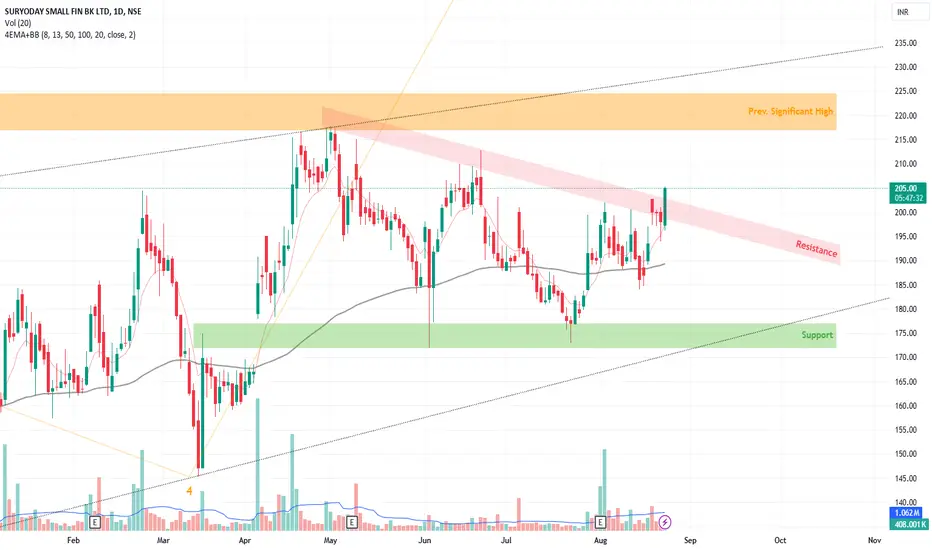
SURYODAY SMALL FIN BANK BY KRS ChartsDate:23rd Aug 2024
Time: 9:26 AM
WHY SURYODAY❓❓
1. All overview, Stock was in Consolidation for long time since listed and in Jun 22 it made lowest low , after that it is in continues HH HL pattern.
2. Wave Count is visible perfectly and it is in 3rd leg of 5th wave as we can see in above chart.
3. 100 Ema is right underneath in Hourly and Daily TFs
4. Today it has broken the resistance of Flag pattern and likely to sustain above it.
5. In bigger picture, Suryoday is mak
Infosys ready for Flag pattern breakout in coming daysNSE:INFY Ready for flag pattern breakout in coming days
Consolidated pattern since many days now ready for breakout in coming days
Follow for more trading signals or analysis.
Target 10% approx
Stoploss 3%
Do as directed in the chart
This is not the trading recommendation or advise 🚨
Do your analysis before taking any step.
COLPAL RANGE BREAKOUT WITH MASSIVE VOL A range breakout occurs when the price of a stock moves outside a defined range of support and resistance levels. This can signal a potential trend change or continuation, depending on the direction of the breakout. Here are some key points to consider:
Identifying a Range
Support and Resistance: Identify the horizontal levels where the price has repeatedly bounced off (support) and where it has faced resistance.
Consolidation: Look for a period where the price moves sideways within these level
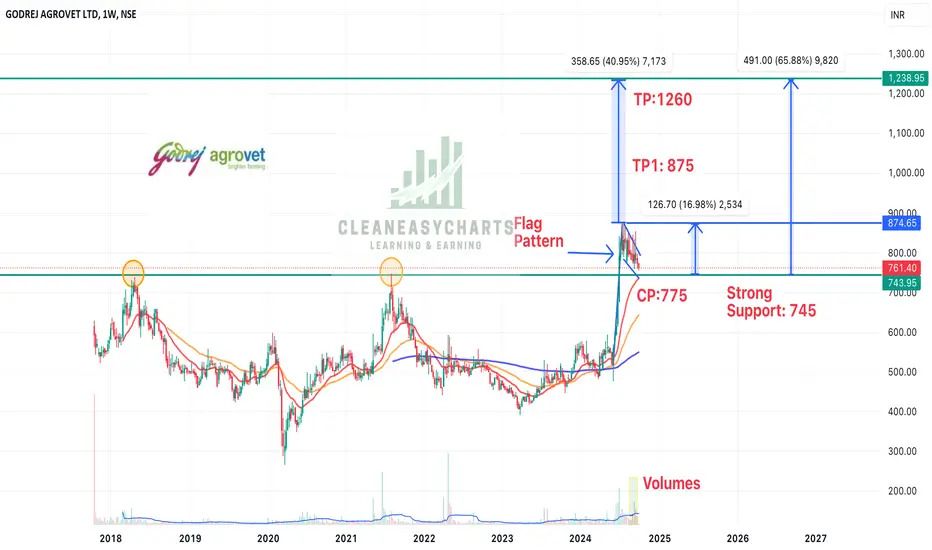
Godrej Agrovet - Flag Pattern!!Godrej Agrovet has given a breakout of its 2018 price and has not retesting the same. It has created a flag pattern and a breakout of same can give a massive 65% return. Other factors:
1. 2018 price breakout and retesting - strong set-up
2. Flag pattern on DTF
3. Largest palm oil plantation in India with 75000 hectares and by 2027 to increase to 100k hectares
4. Recent custom duty increase on import of palm oil will benefit Godrej Agrovet
5. Contracts with Nestle & Pepsi for purchase of palm oi
Getting Accumulated Making A Flag and PoleNSE:INDIACEM is getting Accumulated and Making Flag and Pole Patterns a Breakout on the Upside we see a Swift Swing Trade. Keep in Radar.
Check out my other stock ideas below until this trade gets activated, I would love your feedback.
Disclaimer: This analysis is intended solely for informational and educational purposes and should not be interpreted as financial advice. It is advisable to consult a qualified financial advisor or conduct thorough research before making investment decisio
Midcap Nifty - Sep 30Price is consolidating in a small range and it has formed a bull flag which is a bullish pattern. Sustaining above 13300 is important to be bullish.
Buy above 13320 with the stop loss of 13280 for the targets 13360, 13400, 13440 and 13480.
Sell below 13240 with the stop loss of 13280 for the targets 13200, 13160 and 13120.
Check the live market updates.
Hit the like button to Rock !! Show some energy !!
Note : This is my pre market analysis and my trading journal. Not a suggestion to buy or s
UBL bullish flag pattern breakoutUBL has great bullish triangle flag breakout and re-tested in day time frame. Targets are intact. Festival season also coming can boost this counter too. So price action is favourable.
Keep this in mind. Options is a dangerous instrument to play. Please do not go wild on anything unless you know exactly what you doing. Even though your direction is right still you tend to loose in option buying. And market can always prove me wrong and i take that rights too. Experience traders also fail in th
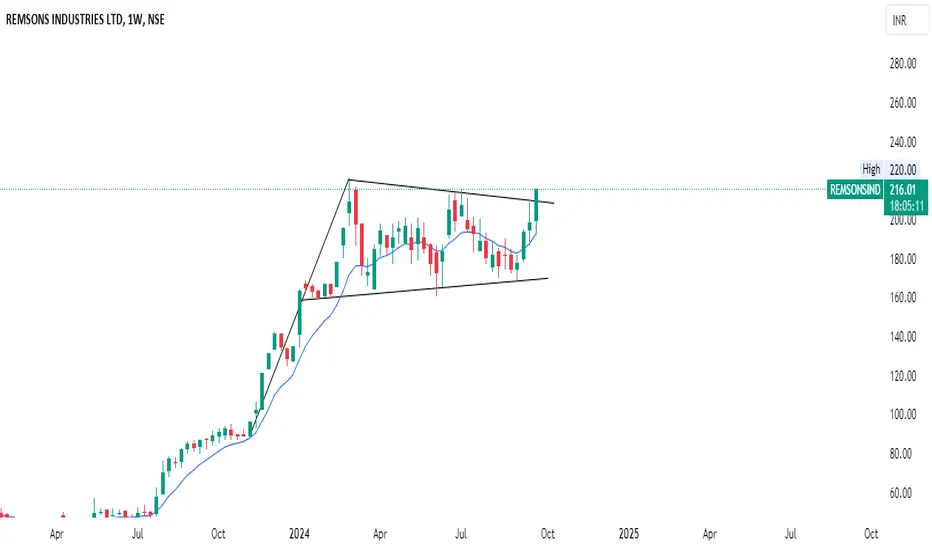
REMSONSINDREMSONSIND - The stock has broken out by forming a pole and flag pattern
Hello traders,
As always, simple and neat charts so everyone can understand and not make it too complicated.
rest details mentioned in the chart.
will be posting more such ideas like this. Until that, like share and follow :)
check my other ideas to get to know about all the successful trades based on price action.
Thanks,
Ajay.
keep learning and keep earning.
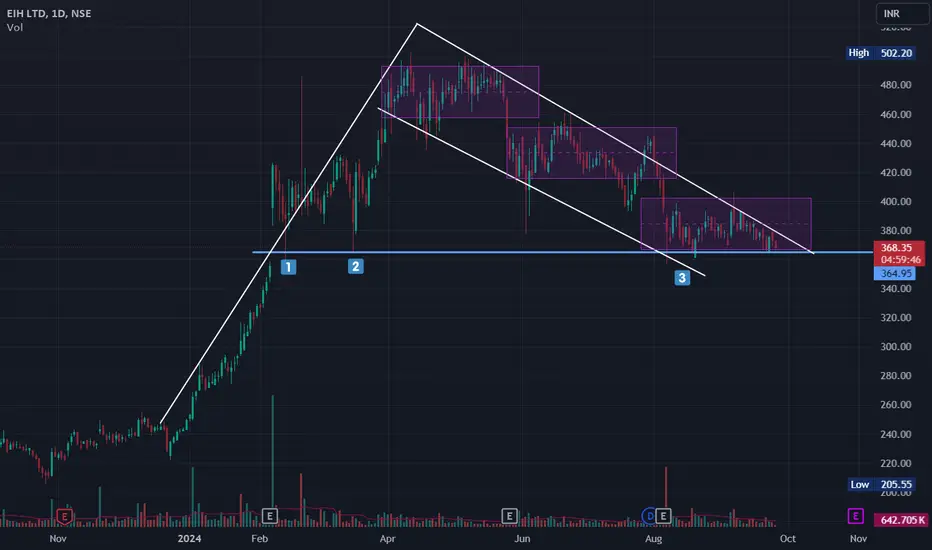
Flag Pattern and Support LineThis appears to be a strong support line, as it has been tested more than three times, and a FLAG pattern has also formed. It seems to be creating BOXES. Waiting to see if it breaks below this box to make lower lows.
In comparison to its peers, its P/E ratio is only 36.23, while Indian Hotels, Chalet Hotels, Lemon Tree Hotels, Juniper Hotels, and Mahindra Holidays have P/E ratios of 78.69, 80.92, 67.23, 176.39, and 66.61, respectively. Trident and Oberoi Hotels, renowned for their presence in t
JSW Steel channel consolidation breakout bullrunJSW steel has good move pending on higher levels. above 920 it can break the channel patten. Mostly bullish upmove possible. 760 is major support range below the channel breakdown it can give good fall till 400 which is more unrealistic. Expecting bull run in this stock. Jindal steel already given. JSW steel has pending move. Focus. Although this flag patten is slightly bearish pattern but now a days these pattern upper side breakout give rocket move too.
Keep this in mind. Options is a dangero