MANKIND -Flag and Pole -Daily - Breakout **Mankind Pharma Ltd.** shows a clear **flag and pole pattern**, indicating a potential continuation of the uptrend. Here's a breakdown of the technical analysis:
### Key Observations:
1. **Flag and Pole Pattern**:
- The pattern consists of a sharp upward movement (the pole) followed by a consolidation phase (the flag), forming between parallel lines.
- The breakout above the flag pattern suggests a bullish continuation, with a price target typically equal to the length of the pole adde
Flag
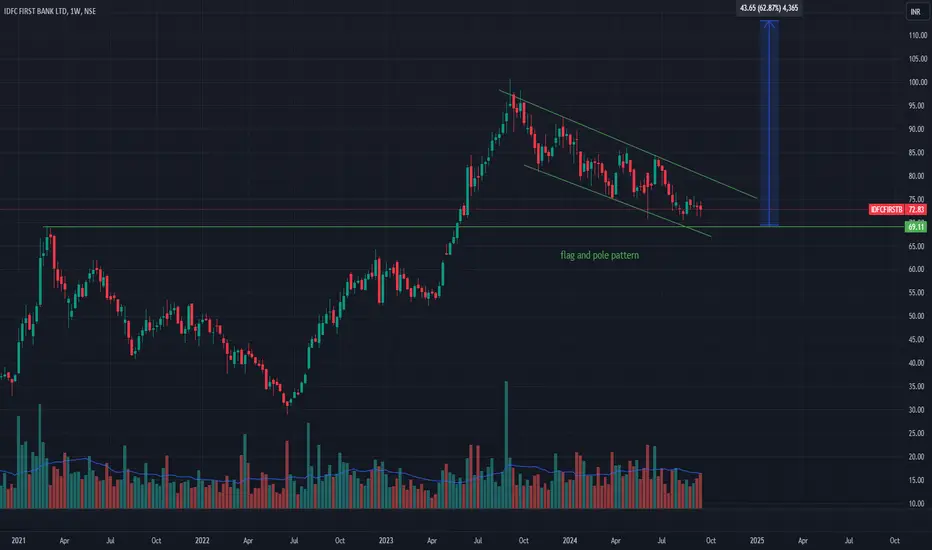
Stock Alert: IDFC First BankPotential breakout in the making!
IDFC First Bank is showing a flag and pole pattern on the weekly timeframe, which indicates a strong continuation signal. This pattern generally forms after a sharp price move (the "pole") followed by a consolidation phase (the "flag"). We are now approaching a potential breakout point.
🔍 Key Highlights:
Pattern: Flag and pole
Timeframe: Weekly
Potential breakout zone: Trendline
Volume activity: Watch for a volume surge during the breakout.
If this breaks out
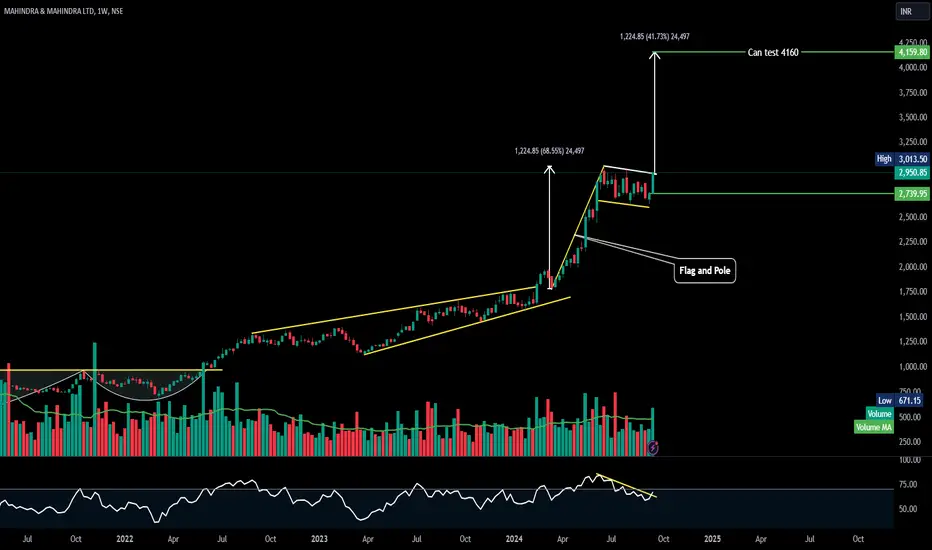
M_M - Flag and Pole - WklyM_M - Flag and Pole - Wkly
Let's analyze the key aspects:
1. Overall Trend: The stock has been in a strong uptrend since early 2023, with significant acceleration in late 2023 and early 2024.
2. Recent Price Action:
- The stock recently broke out of a consolidation pattern (labeled "Flag and Pole" on the chart).
- Current price is 2,950.85 INR, up 7.73% on the day.
3. Key Patterns and Levels:
- A "Flag and Pole" pattern is identified, which is typically a bullish continuation patte
Godrejpro reverse bullish flag patternVery good breakout in the reverse bullish flag pattern. Day candle with good volume too. Follow the target study in the chart. Looking very strong. Special diwali pick.
Keep this in mind. Options is a dangerous instrument to play. Please do not go wild on anything unless you know exactly what you doing. Even though your direction is right still you tend to loose in option buying. And market can always prove me wrong and i take that rights too. Experience traders also fail in this market. Only r
Bankex - Sep 16Price consolidated and formed bull flag. This pattern will be valid if it sustains above 59000.
Pattern : Bull flag.
Range : Medium.
Trend strength : Normal.
Buy Above : 59020.
Stop Loss : 58920.
Targets : 59220, 59300, 59380, 59460 and 59560.
Sell below : 58820.
Stop Loss : 58900.
Targets : 58720 ,58620, 58520, 58400 and 58320.
Check the live market updates.
Hit the like button to Rock !! Show some energy !!
Note : This is my pre market analysis and my trading journal. Not a suggestion to bu
Bullish Breakout: THE INDIA CEMENTS LTD (INDIACEM)THE INDIA CEMENTS LTD (INDIACEM) appears to be in an uptrend. The price has been consistently making higher highs and higher lows, indicating bullish momentum. Additionally, there's a potential flag pattern forming, which can signal a continuation of the uptrend after a brief pause.
Entry:
Breakout: Wait for the price to break out of the flag pattern to the upside, with increasing volume. This could confirm a bullish breakout.
Disclaimer: This analysis is based on historical data and techni
Asianpaint near to flag pattern breakoutAsian paint is very near to the bullish flag breakout. Short term targets and long term targets are both clear. Please follow the chart levels. Will keep updating the post.
Keep this in mind. Options is a dangerous instrument to play. Please do not go wild on anything unless you know exactly what you doing. Even though your direction is right still you tend to loose in option buying. And market can always prove me wrong and i take that rights too. Experience traders also fail in this market. O
Industower - Few things happening hereIndustower is currently exhibiting a bearish trend with several concerning signals: a fake breakout, a bearish flag breakdown, and the formation of lower highs. Traders should be cautious as these indicators suggest a potential continuation of the downtrend. The fake breakout implies that the recent upward move lacked genuine strength, while the bearish flag breakdown reinforces the bearish sentiment. Additionally, the pattern of lower highs signals weakening bullish momentum. However, if the st
Kotak Bank a weekly bull flag formationTraders should keep a close watch on Kotak Mahindra Bank, as it has formed a bullish flag pattern on the weekly chart, signaling potential for a significant breakout. The key levels to monitor are around 1860-1870, where a breakout could trigger strong upward momentum. The longer the consolidation within the flag, the more powerful the breakout may be, offering an opportunity for swift price movement. With strong technicals in place, traders should be prepared to act quickly once the price breac
Ask Automotive : Breakout Stock#Askautoltd #vcp #Flagpattern #chartpattern #breakouttrading
ASK AUTOMOTIVE LTD : Swing Trade
>> Basing Patern at 10EMA (VCP Forming)
>> Flag Breakout
>>Trending Setup
>> Good Strength & Volume Rising
>> Upside Potential upto 16%
Swing Traders can lock Profit at 10% and Keep trailing
Follow us, Boost the Trading Ideas if u Like our Analysis
Disclaimer : Charts Shared are for Learning Purpose, not a Trade Recommendation
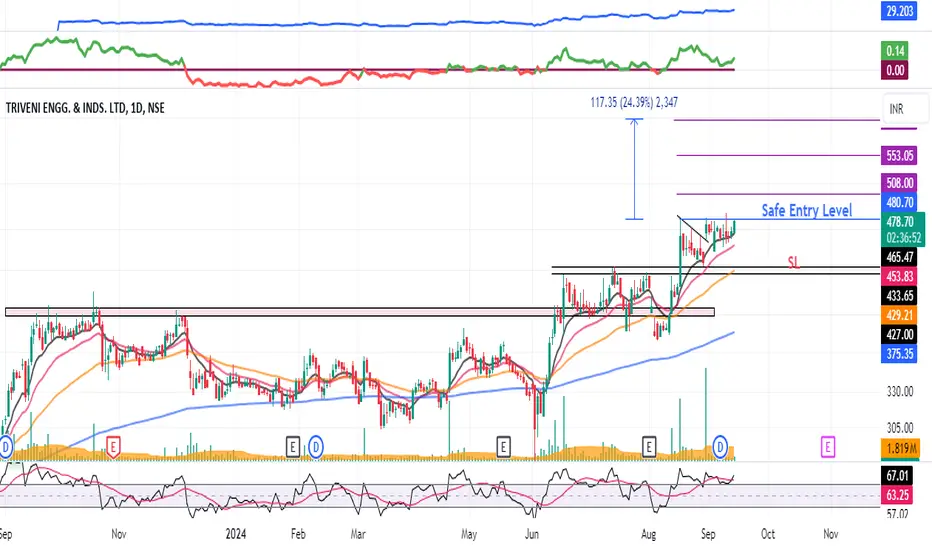
Triveni : Breakout Candidate#Triveni #VCP #Breakout #trendingstock
Triveni : Swing Trade
>> Breakout Candidate
>> Trending Setup
>> Low PE Stock
>> VCP Visible
>> Good Strength & Volumes
>> Upside Potential ore than 20%
Swing Traders can lock Profit at 10% and keep Trailing
If u Like the Analysis. Boost it and Follow us
Disclaimer : Charts shared are for study purpose only
Edelweiss - Multiple confluence points - Cup&handle, Flag patterEdelweiss is at multiple confluence points at monthly time frame - it has made cup & handle patter, flag pattern and a rectangular pattern. A breakout of the stock will definitely looking to move upwards. Other factors:
1. See volumes - building / consolidating
2. MACD is improving
3. RSI is above 60
4. Fundamentally also, good Q1 result, selling stake for 1.5k - 2k crores, improvement in processes and we can RBI restrictions moving away
Keep in your radar
"Cleaneasycharts"
Right Stock at
IWEL -- Flag and Pole - Breakout -DailyName - IWEL
Pattern - Flag and Pole Breakout
Timeframe - Daily
Volume - Good
Cmp - 12748
Target - 16400
SL - 12100
Always welcome for any comments with your feedback or give it a like if you find it useful.
ILong
Wanbury : Flag Breakout#wanbury #chartpattern #flagpattern #flagandpolebreakout #trendingstock #momentumstock #breakout #swingtrade
Wanbury : Breakout Soon
>> Flag Breakout
>> Trending stock & Setup
>> Good Strength
>> Volume Expansion soon
>> Upside potential upto 25%
Swing Traders can Lock profits at 10% and keep trailing
If u like the Analysis, Like it, boost it, Follow us for more
Disclaimer : Charts shared are for Learning purpose not a Trade Recomendation.
A STRONG BREAKOUT STOCK - INOX WINDNSE:INOXWIND
❇️ Strong breakout on weekly chart.
❇️ Flag and poll pattern in 30mint time frame.
❇️ Stock can achive 250-270 targets in upcoming days.
❇️ Short and log terms targets 300+.
❇️ Nearby support 215-220.
❇️ Above 236 we can see a real move🔥
👉🏻 thetradeforecast 🇮🇳