Flag
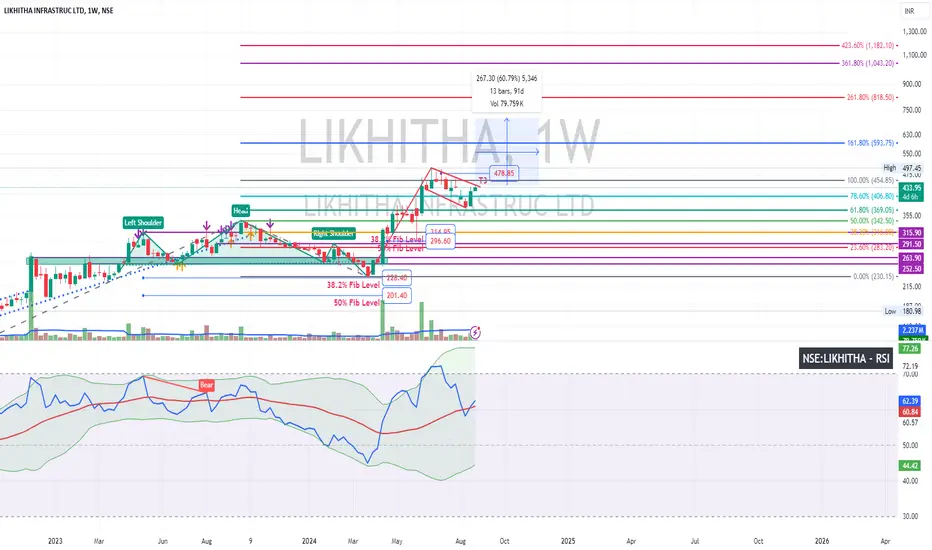
AGI Greenpac Ltd: Inverted H&S Pattern.AGI Greenpac Ltd: Inverted H&S Pattern.
43 % upside potential
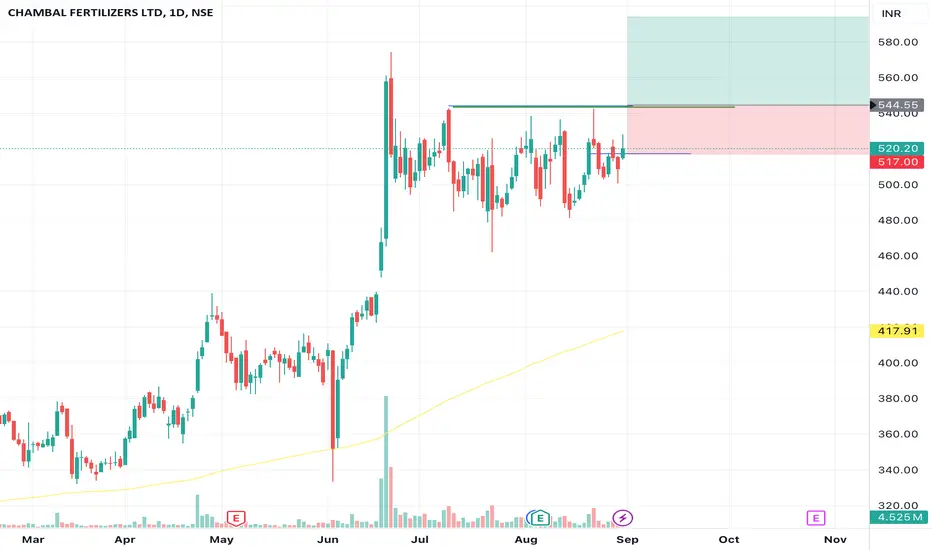
Stock breaks out through the neckline and consolidate on neckline.
Consolidation shaped as a 2 weeks long Bull Flag.
Levels mentioned on chart & Given targets seems achievable.
Plan your trade accordingly.
Views are for ‘’EDUCATIONAL PURPOSE ONLY’’,trade at your own risk.
"Trade what you see, Not what You Think"
Happy Trading(:)
HEROMOTOCO - Flag and Pole - Breakout -DailyHEROMOTOCO - Flag and Pole - Breakout -Daily
Name - HEROMOTOCO
Pattern - Flag and Pole
Timeframe - Daily
Status - Breakout
Volume - Good
Cmp - 5578
Target - 7145
SL - 5266
Pattern : Flag and pole
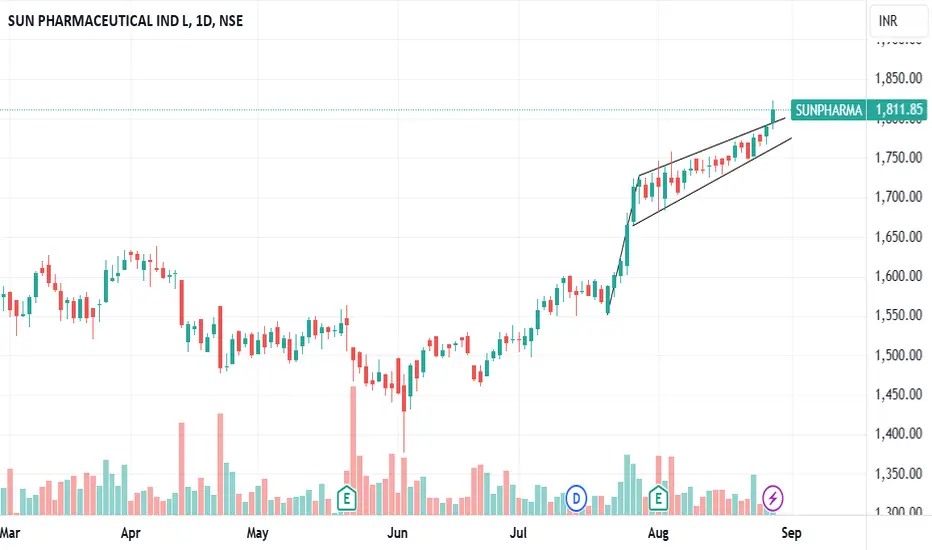
The flag and pole pattern is a popular technical analysis tool used by traders to identify potential continuation of a trend. Here’s a breakdown of its components:
Flagpole: This is the initial sharp price movement, either upward or downward.
Flag: Following the flagpole, th
Grasim Industries - Bullish Flag PatternLet's break down the analysis provided for Grasim Industries Ltd based on the bullish flag chart pattern, as outlined by Arvind Share Academy. This is for educational purposes, so here’s how you might evaluate and implement such a trade:
Trade Plan Breakdown
Current Market Price (CMP): ₹2700
Context: This is the price at which Grasim Industries Ltd is currently trading. Understanding the CMP helps to set up entry and exit points effectively.
Buy Above ₹2725
Entry Point: The suggestion to buy
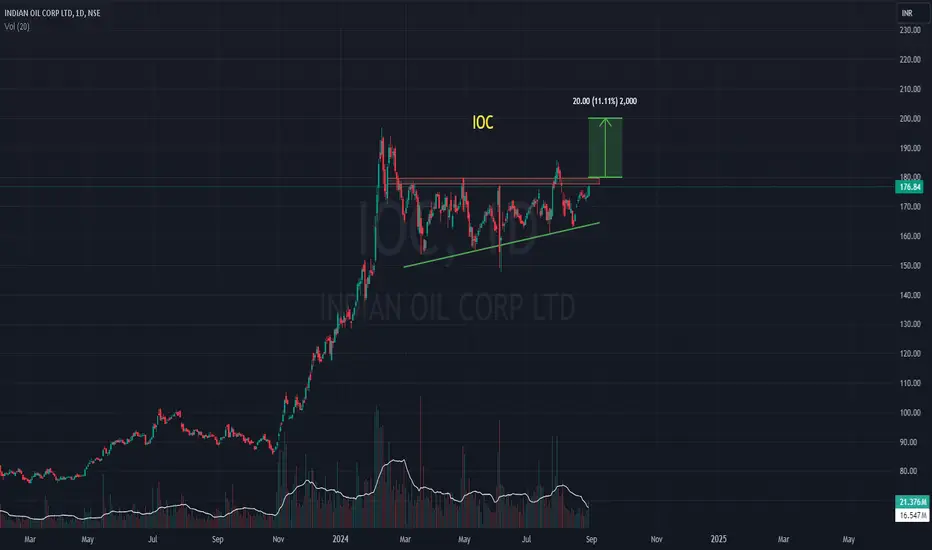
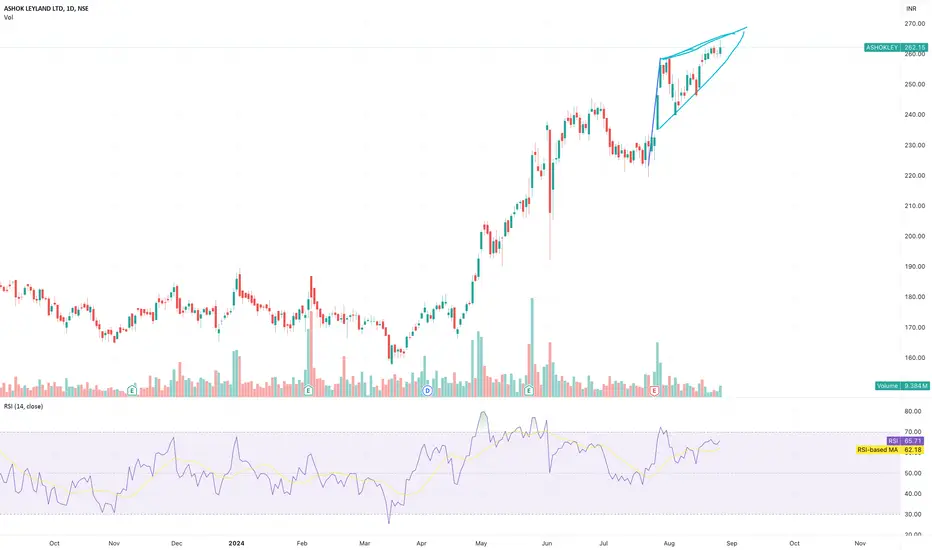
Indian Oil Corporation Ltd. (IOC) ChartThe chart appears to be displaying a flag and pole pattern. This pattern is characterized by a sharp price increase (the pole) followed by a period of consolidation (the flag) before a continuation of the uptrend.
Pole: The sharp price increase from the November 2023 low to the early 2024 high represents the pole.
Flag: The subsequent consolidation period, marked by a rectangular pattern, is the flag.
Breakout: The price has recently broken out above the upper trendline of the flag, indicating
Nestle bullish flag patternNestle india. Bullish flag pattern breakout and re-testing. Ready for the new trend and new ATH soon. As per current market volatility FMCG is bit defensive sector to invest. RSI divergence is also clear & visible to take support from the rock solid bottom. Follow the given levels on the chart. Some cross intersecting lines are important levels & targets.
Keep this in mind. Options is a dangerous instrument to play. Please do not go wild on anything unless you know exactly what you doing. Even
Bull movement to come immediately in IDFCStock selected in daily TF
Sector support - positive
Stock recovered immediately from support zone which confirms it as significant support zone and now weak pullback at minor resistance.
VSA principles
Despite increasing volumes in pullback , price is displaying strength
August 26 Bar showing strength since it is a down close bar with same spread as last two bars but volume higher than many bars of past.
This shows smart money buying in pullback at low prices and retail traders exiting whic
ILong
Bull movement to come immediately in IDFCStock selected in daily TF
Sector support - positive
Stock recovered immediately from support zone which confirms it as significant support zone and now weak pullback at minor resistance.
VSA principles
Despite increasing volumes in pullback , price is displaying strength
August 26 Bar showing strength since it is a down close bar with same spread as last two bars but volume higher than many bars of past.
This shows smart money buying in pullback at low prices and retail traders exiting whic
ILong
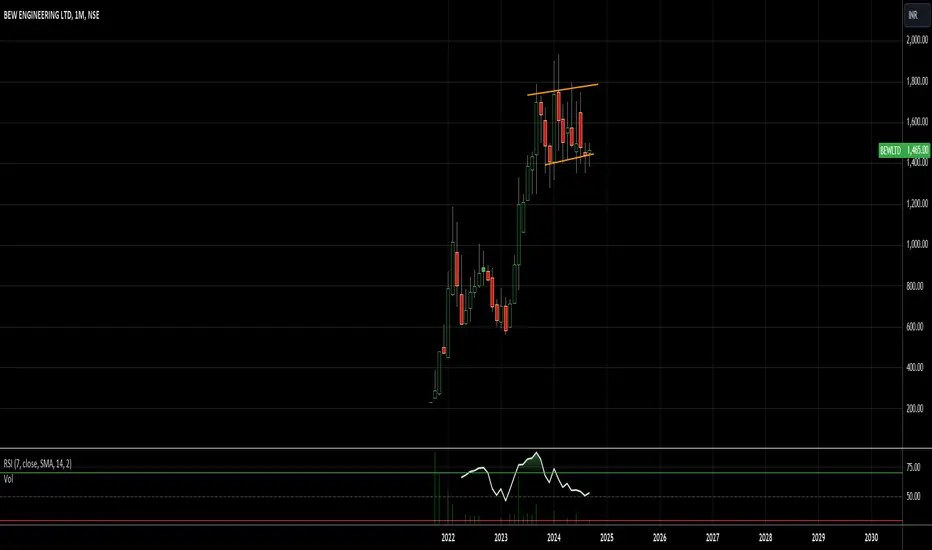
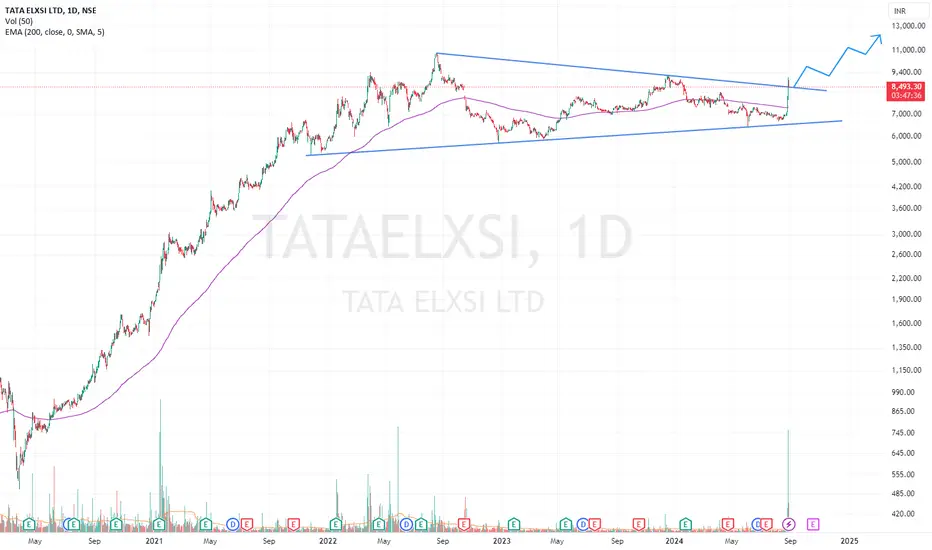
Is KPI Green's Flag Unlocking the Potential for a Remarkable 82%NSE:KPIGREEN
📈 Unleashing Potential: KPI Green's Technical Breakout Opportunity 🚀
The breakout of KPI Green, from a flag pattern is supported by trading volumes. There is evidence of institutional accumulation on specific dates; May 16th & 17th June 12th & 14th and June 20th to July 11th.
The rounding bottom pattern that is forming adds to the outlook. There might be a resistance zone around 980. As long as support remains above 885 the flag patterns strength will continue.
If KPI Green
VBL-An ATH breakout in super bullish FMCG stock VBL has been a consistent outperformer among FMCG stock in this bull run.
As we can clearly see, stock is forming a beautiful staircase pattern(continuous flag pole) during the uptrend.
Stock has given breakout in closing basis of ATH. A good stock for quick momentum traders.
Not a recommendation.
If interested, do check the chart of RVNL which has shown a similar staircase pattern in past.
VGEITL - Flag & Pole Breakout - Best to add above 111]VLEGITL is a subsidiary of Vakrangee Ltd, has formed Flag and Pole Pattern on the chart.
This is purely technical play and one can enter above 111 for 36% upmove with different levels mentioned on chart.
Strict stop loss of 100.
Like the analysis? Boost/Like the idea.
Disclaimer : Educational content & not a buy/sell recommendation