SOUTH INDIAN BANK BUY @ 35.70 RS TARGET @ 46.00 RS CONFIRMATION: Pennat flag breakout Expected returns are around 29.00% Longby MohammedNiyas_139
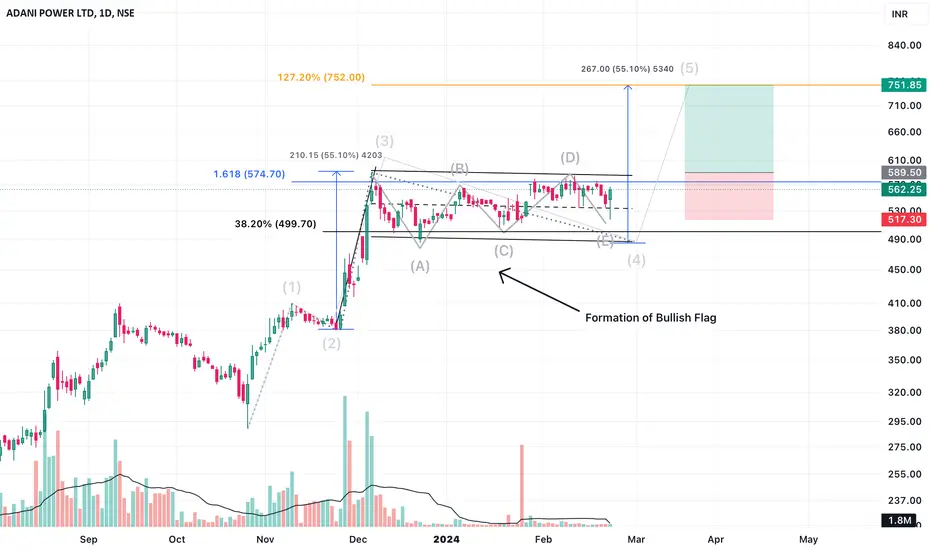
Wave - 5 breakout in Adani Power1. There is formation of typical Bullish Flag like pattern on Daily Time frame and breakout above 590 can take the price to 750/- price level I.e. potential of approx. 30% upmove with a stop loss below today’s low I.e. 517/-. Giving an excellent opportunity of 1:2 Risk : Reward. 2. As per Elliott Wave Analysis, wave - 4 is under formation taking support at 38.2% Fib Level. Projection of Wave - 5 from these level giving target of exactly 750 at 127.2% Fib level (Fib extension level of wave - 3 Longby Breakoutmasters2
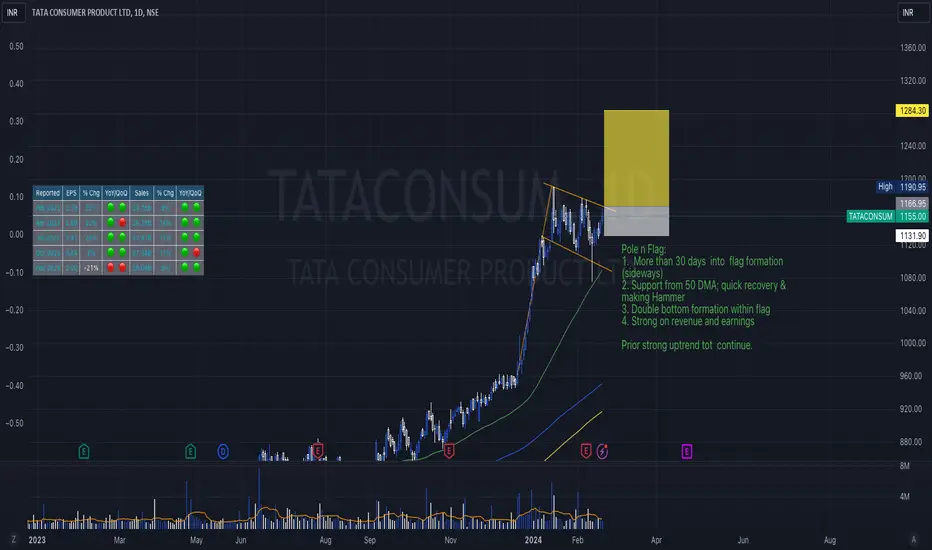
Pole n Flag: Watch for Breakout soon...Pole n Flag: 1. More than 30 days into flag formation (sideways) 2. Support from 50 DMA; quick recovery & making Hammer 3. Double bottom formation within flag 4. Strong on revenue and earnings Prior strong uptrend tot continue.Longby rabhay3
Flag breakout in GE ShipingA good 1 month consolidation is now showing sign of breakout. A good flag pattern is seen on the chart. Target and SL on chartLongby yndesaiUpdated 1
Cipla ..Flag patternCipla flag pattern breakout can be seen. With the current market trend looks like Cipla can touch 1600 before reversal. Longby rohanssalunkhe36021
Swing Trading Opportunity in SPARC-- Waiting for the strong Trendline Breakout Candle with High volume -- Flag Pattern on Daily TF(Waiting for Breakout) -- Doji Candle formed On Weekly Candle at SUPPLY ZONE -- RETEST the breakout level -- ‘W’ Pattern BreakOut On Monthly TF -- So there are Multiple signals of buying but just waiting for strong Volume On Daily TF. Please Follow!!! (Also Please check my previous IDEA‘s) Longby siddharthchavan45452
Wockhardt - Bullish flag patternWith a visible Bullish Flag pattern breakout, the stock appears strong, and is geared for an upleg journey towards the initial target of 740. Follow strict stop loss of 5-8% in case of trade going wrong. Also, be cautious below 404 as it may signal a downtrend. Note: Not a buy/sell recommendation. Consult your financial advisor.Longby TheUnlearningOne1
breakout trading !In technical analysis, a breakout refers to a substantial price movement of a financial instrument, such as a stock or commodity, surpassing a specific level of support or resistance. This occurrence is of paramount importance, as it frequently signifies the initiation of a new trend, offering traders and investors valuable insights for informed decision-making. Outlined below are key aspects related to breakouts in technical analysis: Definition: A breakout occurs when the price of an asset sEducationby pratik235829
LICI ..Flag Pattern breakout for 200 point in this QuarterLICI is showing momentum and also showing flag pattern breakout. I think it will give 200 point move from here. Longby rohanssalunkhe3602Updated 8
ADANIPORT F&P BREAKOUTAdaniport is breaking flag pattern with good volume rsi EDUCATIONAL IDEA Longby NeetikaSri10
PNB F&P BREAKOUTPNB is breaking flag pattern good volume building up trading above 20 ema EDUCATIONAL IDEA Longby NeetikaSri112
BANKOFBARODA BREAKING F&PBankofbaroda is breaking f&p pattern good volume building up trading above 20 ema EDUCATIONAL IDEA Longby NeetikaSri3
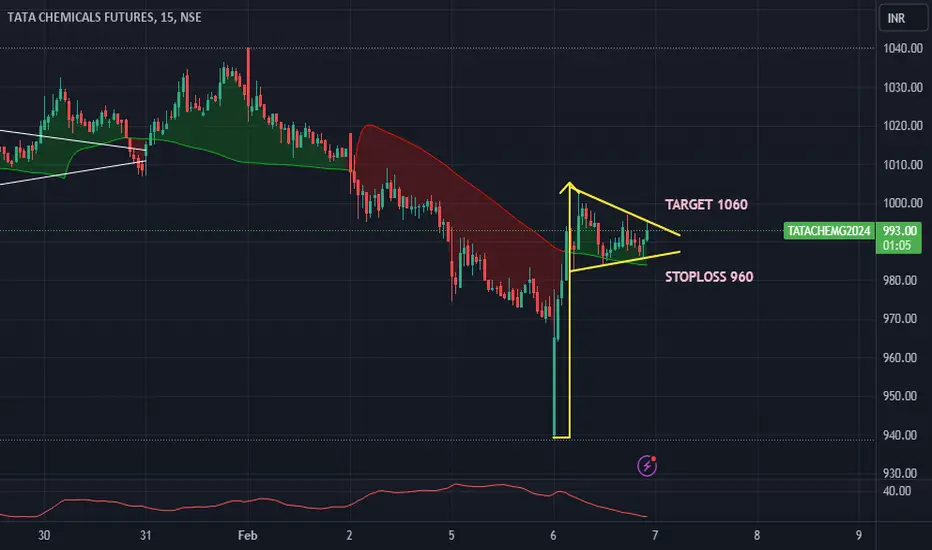
T A T A C H E M - F U T U R E STATACHEM Futs is on the verge of breaking out of Flag Pattern on 15 min chart with aggressive decrease in OI suggesting strong short-covering. Risk:Reward very much in favour of bulls. Could be bought with mentioned stoploss & target.TLongby TORTOISE_MSUpdated 0
FLAG PATTERNJSW STEEL Monthly TF FLAG PATTERN and ALL TIME high break and retest level by justlookchart4
#DaburNSE:DABUR Pole and Flag pattern Pattern kicks in above 573 590-5 seems to be resistance. Longby vinucool35Updated 2
ABM International LTD Weekly Analyis CMP 68.65 Inverted Head aABM International LTD Weekly Analyis CMP 68.65 Inverted Head and shoulder Breakout buy for target 85- 113- 130- 144- 160+ SL below 35Longby Bilal_Kazi5
Daily Bullish Flag Pattern BO in TORRENT POWERIntroduction: Torrent Power is one of the leading brands in the Indian power sector, promoted by the Rs. 21500 Crore Torrent Group – committed to its mission of transforming life by serving two of the most critical needs - healthcare and power. It is an integrated power utility and is one of the largest private sector players in India having interests in power generation, transmission, distribution and manufacturing and supply of power cables. Subsidiaries and Joint VeLongby raigvivekUpdated 21
Swing Opportunity in BANK OF BARODAGood Bullish Breakout with High Volume And Retest the Breakout Area Formed the N pattern Enter at 260-265 Can expect 15-20 percent return Longby siddharthchavan45452
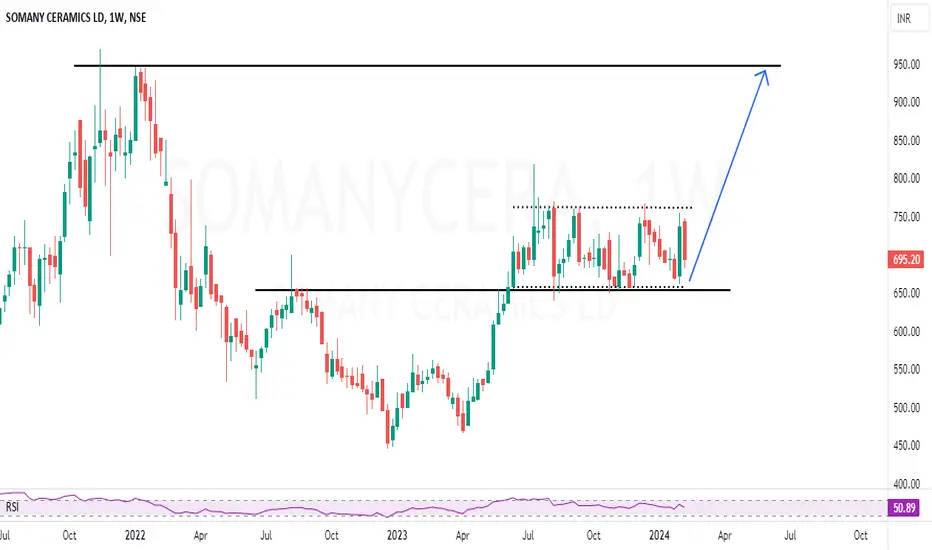
SOMANYCERA | Simple breakout and consolidation - 40%SOMANYCERA | Simple breakout and consolidation - 40% CMP : 695 SL : 620 Target : 935 Almost 1:4 risk reward setup Longby srikartiram14
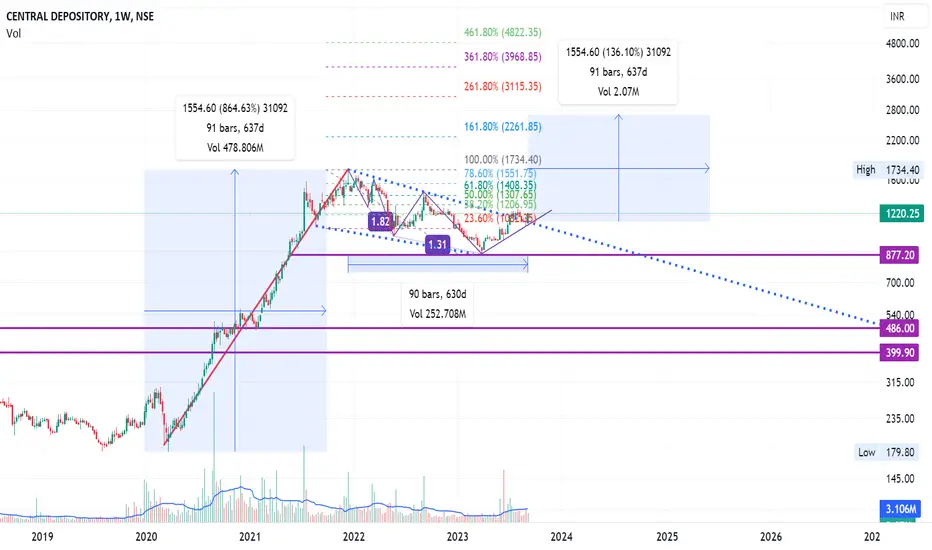
CDSLCDSL Weekly chart. Flag breakout. Flag pole target is near to fib 161.8%. Should be an ideal target.Longby narayklnUpdated 13
NMDC MULTIYEAR BREAKOUTNMDC gave breakout from upflag on 25th JAN, however the volumes were not so convincing and there was a previous support near 227 price level, on 2 FEB it gave breakout from that level with convincing volumes. EMA 5>13>26 It's a buy call since 5th of FEB, Target 325 SL 217 CMP 244 Only for educational purposes. Do not trade!!Longby Jaiminocha2
FLAG PATTERN BREAKOUT NSE:BHARATFORG The stock is in a continuous uptrend and the price is giving back-to-back breakouts. The stock is now ready to give another breakout.Longby investingedge1s0
Flag breakout in InfyIT stocks are looking quite bullish. Infosys was consolidating in a flag pattern whose breakout was given last week. A very good stock to buy for long term at an amazing price. From trading perspective, 1300 is a SL with targets of 1700, and then ATH levels. It is an FNO stock so big intraday moves shouldn't be expected. Idea sahared for educational purposesLongby chartistameyUpdated 3
 LongLong
 Long
 Long
 Long
 Long
 Long
 Long
 Education
 LongLong
 Long
 Long
 Long

 Long
 Long
 LongLong
 Long
 Long
 Long
 Long
 Long