Long
Long
Himadri Speciality Chemical (Weekly)Himadri Speciality Chemical (Weekly)
After spending several months in a broad consolidation range between ₹430–₹500, Himadri has finally delivered a strong breakout backed by exceptional volume expansion.
The breakout above ₹535 has shifted the market structure firmly in favor of the bulls. Price is now testing the ₹676 resistance zone, which coincides with a previous swing high. A sustained move above this level could open the door for a fresh leg higher toward ₹800 and beyond.
Volume participation has increased significantly during the breakout phase, suggesting institutional interest. RSI is hovering near 70, reflecting strong momentum, although traders should remain alert for short-term consolidation after the recent sharp rally.
Key Levels
🔹 Resistance: ₹676, ₹800, ₹900
🔹 Support: ₹606, ₹535, ₹501
As long as price remains above the ₹535–₹606 zone, the bullish structure remains intact. Any pullback toward the breakout area may offer a healthier setup for trend continuation.
Disclaimer: This analysis is for educational purposes only and should not be considered investment advice. Please do your own research and manage risk appropriately.  Long
Long
 Long
Long
 Long
Long
 Long
Long
 Long
Long
 Short
Short
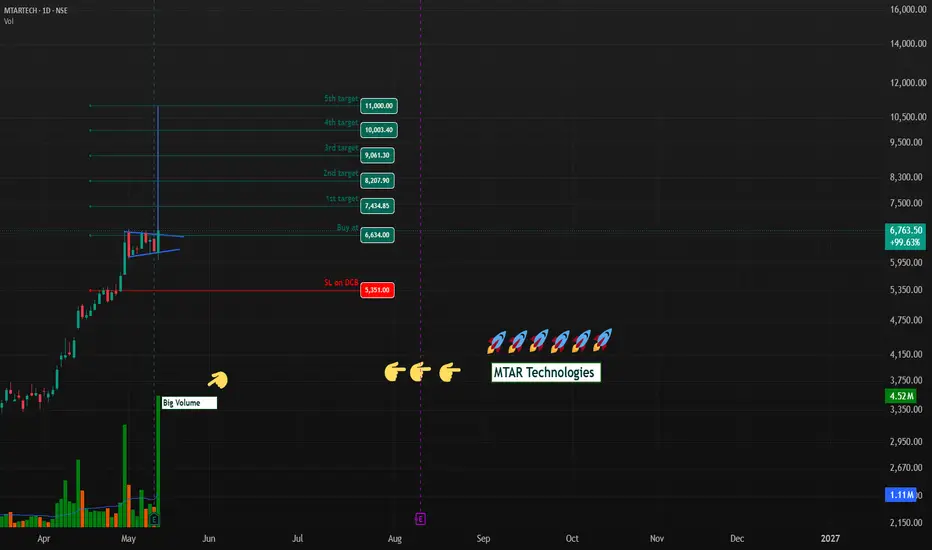
MTAR Technologies Ltd.MTAR Technologies is showing a powerful earnings breakout, with Q4 FY26 revenue up 67% YoY to about ₹306 crore and PAT up 222% YoY to about ₹44 crore, while FY26 revenue rose to about ₹876 crore and FY26 PAT to about ₹94 crore. Management has also turned more constructive on FY27, raising revenue growth guidance to more than 80%, which makes the fundamental setup look stronger than before.
Fundamental view
Last 4 quarters show a mixed-to-strong acceleration pattern: Q2 FY26 was softer, Q3 FY26 improved sharply, and Q4 FY26 delivered the real breakout in both revenue and profit, indicating operating leverage is now working in the company’s favor.
For the coming quarter and the full year, the key monitorables are execution of the stronger order book, margin sustainability, and whether FY27 can actually convert the raised guidance into consistent quarterly growth.
At the current stage, the business is not just growing; it is re-rating on the back of scale, profitability, and confidence from management guidance.
Technical view
Technically, MTAR has been in a strong trend after the post-results surge, and recent technical dashboards show bullish momentum with RSI near the overbought zone and MACD in positive territory.
That means the stock is strong, but also extended, so dips and retests matter more than chasing blindly.
Recommendation : Buy MTAR Technologies at CMP 6634 with stoploss 5351.00 for targets of 7434.85, 8207.90, 9061.30, 10003.40, and 11000.00.
This is a momentum-plus-fundamental setup, where the reward looks attractive as long as the stock holds above the stoploss and continues to respect the trend.
Disclosure
Disclosure: I am not a SEBI registered analyst/technical advisor. This post is only for educational and informational purposes, not investment advice.  Long
Long
 Long
Long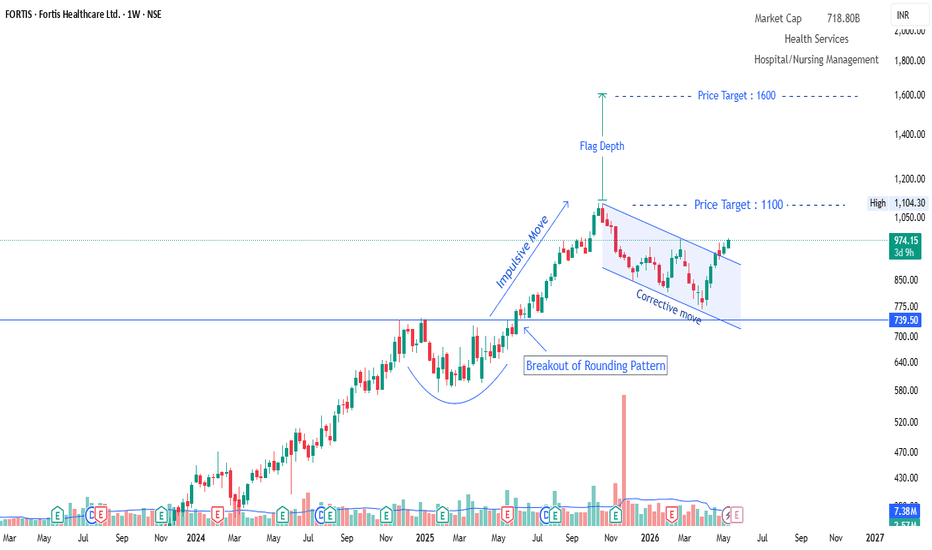
 Long
Long
 Long
Long
 Short
Short
 Short
Short
Shortterm Investment - Buy MindaCorpHere's a breakdown of the **positives for buying Minda Corporation (MINDACORP) as a Short-term investment**:
Apart from the Strong Technical, added the following Fundamentals of the Stock.
**Strong & Growing Financials**
Net profit has risen for four consecutive quarters, growing from ₹52 Cr to ₹85.7 Cr, with an average quarterly increase of around 14.8%. Revenue has also grown for five straight quarters, averaging 5.2% growth per quarter.
**Record Revenue Performance**
The company recently posted a record quarterly revenue of ₹1,560 crores, reflecting a robust 25% year-on-year increase fueled by strong demand across vehicle segments.
**Ambitious Revenue Target**
Minda Corp is targeting ₹17,500 crore in revenue by 2030, implying a 22% CAGR, including ₹4,000–₹4,500 crore from acquisitions. That's a very aggressive growth ambition.
**EV & Future-Ready Business**
Strategic partnerships in EV power electronics are enhancing market access, and recent trade agreements with major economies promise further expansion. The company is also developing advanced driver assistance systems (ADAS) and launching new products.
**Diversified Product Portfolio**
Minda Corporation manufactures a diverse range of automobile components for two and three wheelers, passenger vehicles, commercial vehicles, and off-road vehicles, and operates across India, Asia, Europe, North America, and South America.
**Institutional Confidence**
Institutional investors hold a 27.52% stake in Minda Corporation — a level that typically reflects confidence in the company's fundamentals and governance, as these investors conduct thorough due diligence.
**Short-Long - Term Bullish Trend**
The stock is maintaining a bullish long-term trend, trading above both its 150-day and 250-day moving averages.
**Strong Debt Servicing & Margins**
Quarterly results for December 2025 showed operating profit margin improving to 11.76%, the highest ever recorded for the company.
**A note of caution:** I'm not a financial advisor, and this is not investment advice. The stock currently has a **"Hold" rating** from some analysts, and has seen some short-term price weakness. Always do your own research or consult a SEBI-registered financial advisor before investing. GOLD PLUNGING TO 4.850-4,890 NEXT WEEK - KEY REASONS!!Current price ~$5,020/oz, strong bearish momentum in play.
Macro factors (simple breakdown):
US rates high + Fed hawkish: Solid US economy, inflation still sticky, strong jobs data → Fed not rushing to cut rates (possibly hold until summer 2026), even more hawkish due to oil spike risks from Iran conflict. Opportunity cost of holding gold explodes (you miss out on yields from USD or bonds).
Money flowing to stocks: US equities (S&P, Nasdaq) hitting record highs → investors chase high-risk/high-reward trades, pulling capital out of gold (safe-haven looks less attractive in a risk-on environment).
Geopolitics cooling: Positive signs from Middle East & Ukraine peace talks → less fear, sharp drop in safe-haven buying demand.
Major buyers slowing: China + India (the two biggest gold purchasers) have significantly reduced buying pace over the last 2 months → no strong "engine" left to push prices higher like before.
Technical: Continuous lower lows, key support broken, Fibonacci + historical support zone pointing exactly to 4,850–4,890.
Advice:
Holding gold: Sell 30–50% right now, wait to buy back ~400 points cheaper.
Want to trade: Short safely from here, target 4,890, use trailing stop.
Newbies: Don't chase buys—wait for the target zone to accumulate gradually.
Protect capital first this week! 💪  Short
Short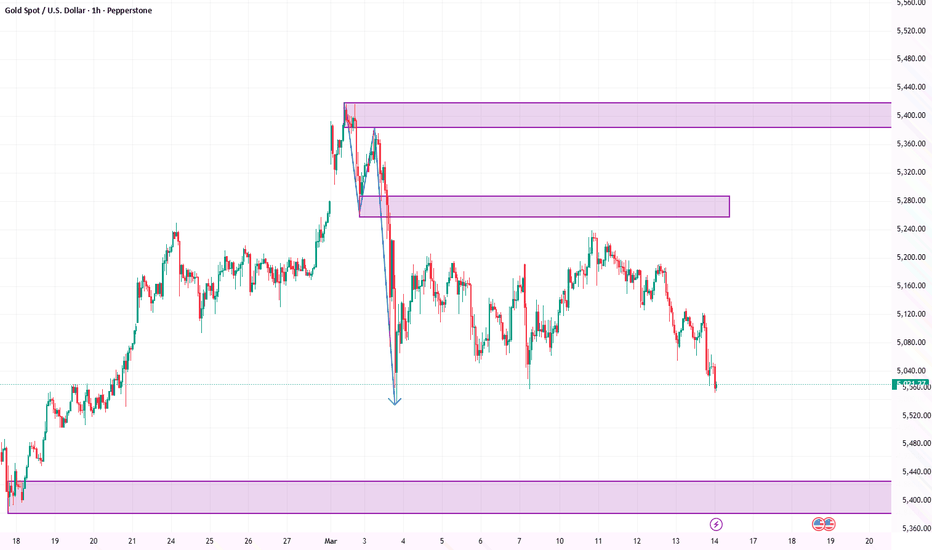
 Long
Long
GRM Overseas (D): Possible Flag & PoleBased on the latest market data as of March 2, 2026, GRM Overseas Ltd (GRMOVER) is currently exhibiting a short-term bearish but long-term bullish structure on the daily timeframe. The stock has recently undergone a minor correction and is consolidating near key support levels.
The structure on the daily timeframe does resemble a Flag and Pole pattern, though it is currently in a critical "make-or-break" phase.
Price Action & Trend Analysis
As of the last close on March 2, 2026, the stock was trading around ₹158.96, down approximately 1.06% for the day.
Short-Term Trend: Bearish. The stock is trading below its 5, 10, 20, and 50-day EMAs.
Long-Term Trend: Bullish. It remains comfortably above its 100-day and 200-day EMAs, indicating the primary uptrend from the 52-week low of ₹65.80 is still intact.
Critical Levels for the Flag & Pole Pattern
For this pattern to "complete" and transition from a consolidation to a breakout, keep an eye on these specific zones:
Resistance (The Breakout Point): ₹164.50 – ₹166.00.
Support (The Floor): ₹155.00
Target 1: ₹180.00
Target 2: ₹210.00
Conclusion
The pattern is visible and technically sound, but it is not yet "active." The stock is currently testing the lower half of the flag. Traders often wait for a breakout above the ₹166 level to avoid getting caught in a "time correction" where the stock continues to drift sideways.  Long
Long


 Long
Long