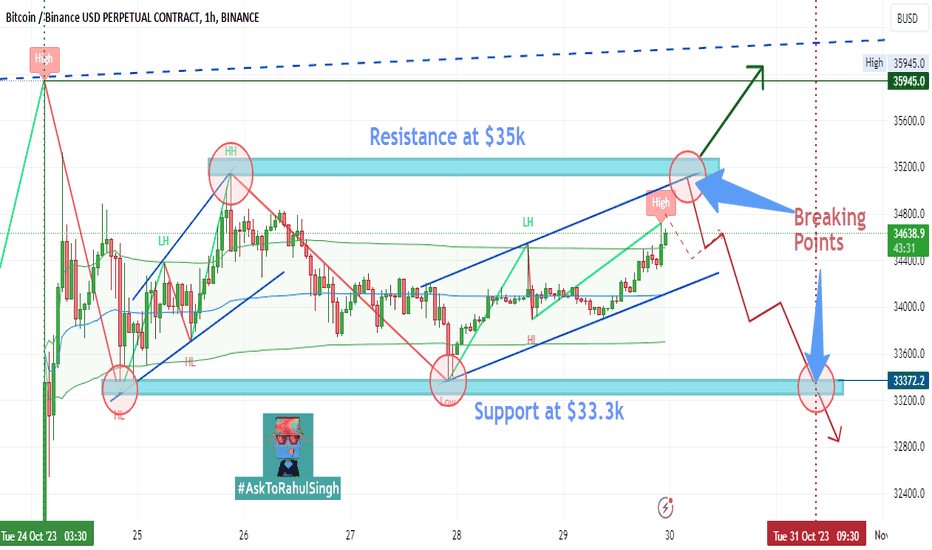
BITCOIN Last Time Breakout Divergence#BITCOIN 1hr. Chart Analysis
As per present scenario, after reached out $35.9k in last week, CRYPTOCAP:BTC lower support already one of the previous one is $33.3k that was never broke down in previous times to much easily as well not this time too, but its also never break-out $35.2k mark very easy soon and previously many times too.
So, its the exact scenario here again in October month end arrival soon, either it breaks their resistance of $35.2k this time, but if rejects from their then may be other chances to try-out for lower-low support of $33.3k again final time too...
Lets, see whats the market and whalers mood of October month end, Just wait n watch
but, always #DYOR before invessting in Crypto and Trade wisely by using #StopLoss.
Also, Follow Me and Share it, Comment it and Like IT.... B
Long
Long
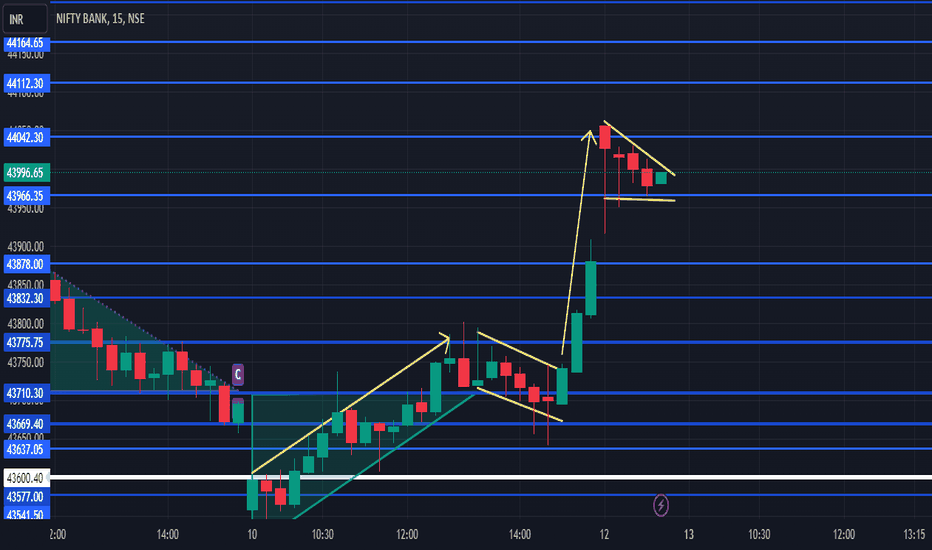
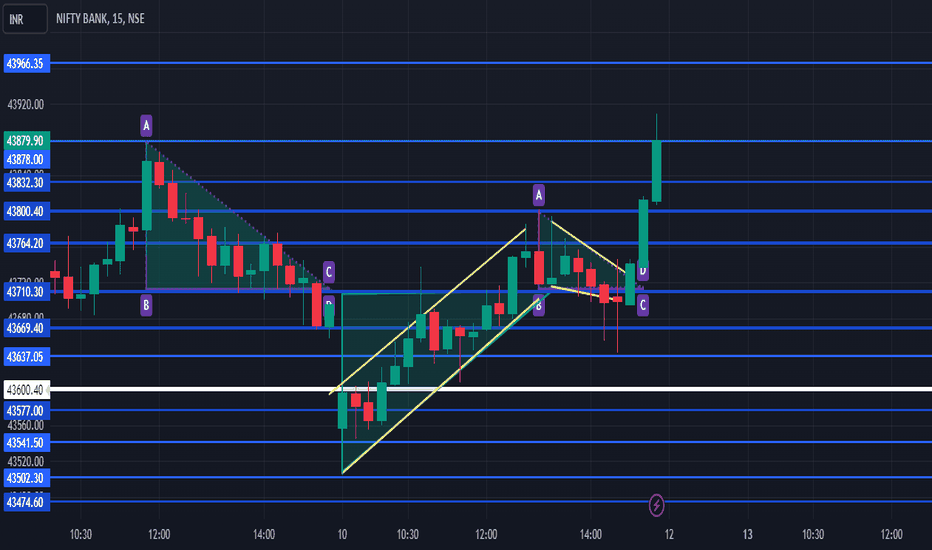
Bank nifty Bearish Flag FoundThe bearish flag pattern is a technical analysis pattern used in financial markets, particularly in stock, forex, and cryptocurrency trading. It is a continuation pattern that typically occurs within a downtrend and signals that the price is likely to continue moving lower. The bearish flag pattern is characterized by a sharp, significant price decline (the flagpole) followed by a period of consolidation or sideways movement (the flag) before the price resumes its downward trend.
Here's everything you need to know about the bearish flag pattern:
1. **Formation**: The bearish flag pattern consists of two main components:
- **Flagpole**: This is the initial steep price drop that precedes the flag pattern. It is a strong and rapid decline in price.
- **Flag**: The flag is a rectangular-shaped pattern that forms after the flagpole. It is characterized by price consolidation or sideways movement. During this phase, trading volumes tend to decrease, indicating a pause in the selling pressure.
2. **Duration**: The flag portion of the pattern can last from a few days to a few weeks. The longer the consolidation, the more significant the potential breakout.
3. **Slope of the Flagpole**: The angle of the flagpole is usually sharp and steep. It represents the initial strong selling pressure.
4. **Volume**: While the flag is forming, trading volume tends to decrease. This is a crucial element in the pattern, as it shows a reduction in market interest and a potential energy buildup for the next move.
5. **Breakout**: The bearish flag pattern is confirmed when the price breaks below the lower trendline of the flag, indicating a resumption of the downtrend. This is a signal for traders to consider shorting the asset or taking other bearish positions.
6. **Price Target**: To estimate a price target for the pattern, you can measure the height of the flagpole and extrapolate it downward from the breakout point. This provides a potential target for the price decline.
7. **False Breakouts**: It's important to be cautious of false breakouts. Sometimes, the price may temporarily break above the upper trendline of the flag before reversing. To mitigate this risk, traders often wait for a clear, decisive breakout confirmation.
8. **Risk Management**: As with any trading pattern, it's crucial to have a risk management strategy in place. Use stop-loss orders to limit potential losses and consider the overall market context and other technical indicators for confirmation.
9. **Confirmation**: Many traders use additional technical indicators, such as moving averages or oscillators, to confirm the bearish flag pattern before taking a position.
Remember that no trading pattern is foolproof, and trading always carries risk. It's essential to conduct thorough analysis and consider other factors like market news and economic events when making trading decisions. Additionally, practicing on a demo account or using paper trading can help you become more proficient in identifying and trading patterns like the bearish flag.
Long
Long
Long
Long

BITCOIN - After Pumping Still Bearish#BITCOIN Daily Chart Analysis
After Pumping of Weekly startup today's signal, CRYPTOCAP:BTC movement still under #BearishFlag pattern, it means with in next 25-35 days its next and final divergence will be towards $24k and from that point it will break down, there will be chances to breakdown of 18-20% means up-to $5k of value breaks as per my next forecast up-to 20-25th Nov 2023 and this will be our last #BearishZone downtrend cycle, after that Bitcoin starts to move in Uptrends towards #BullRun slowly as Sideways.
Sometimes, Whaler's & Manipulator's trying to do Hard Pump n Dump by using the market sentiments and some news regarding any legalisations, wars, attacks, de-pegging's, #SEC etc etc. Those are the just manipulation for a time being to just liquidate market funds and create Panic in market.
So,
Always Trade wisely by using #StopLoss at this panic and volatile situations and #DYOR, its #NFA
as well,
Must SHARE, LIKE, COMMENT on it and Follow me...
Long
Nifty Pharma: Double Top or Bull Flag?The pharmaceutical sector, represented by Nifty Pharma, has been on a remarkable journey over the past three months, rallying approximately 30%. This surge has been characterized by a breakout above its previous all-time highs by more than 700 points. However, in recent days, Nifty Pharma has found itself trading within a range of 15,000 to 15,750, with the previous all-time high acting as a crucial support level. As traders and investors closely monitor these developments, the question arises: Is this a double-top pattern forming, or could it be a bull flag signaling the potential for another upward surge and the creation of new all-time highs? Let's delve deeper into the possibilities.
Understanding the Double Top Pattern
A double-top pattern is a bearish technical chart pattern that suggests a potential reversal of an ongoing uptrend. It typically occurs after a prolonged upward movement and is characterized by two peaks that reach a similar price level, separated by a trough. The pattern is confirmed when the price breaks below the trough, indicating a shift in market sentiment from bullish to bearish.
In the case of Nifty Pharma, it's important to note that the price has not yet breached the previous all-time high, which is currently acting as a support level of around 15,000. Therefore, while the price may appear to be forming a double-top pattern, it has not yet confirmed this bearish reversal.
The Potential for a Bull Flag
On the other hand, a bull flag is a bullish continuation pattern that often occurs after a strong upward move in price. It is characterized by a consolidation phase, where the price trades within a narrow range in the form of a flag, typically sloping downward. This consolidation is seen as a temporary pause before the prevailing uptrend resumes.
In the case of Nifty Pharma, the consolidation between 15,000 and 15,750 could potentially be interpreted as a bull flag. This pattern suggests that despite the recent rally and the subsequent consolidation, there might be further upside potential, and new all-time highs could be on the horizon once the flag pattern resolves to the upside.
Factors to Consider
While technical analysis can provide valuable insights, it's important to remember that market dynamics are influenced by a multitude of factors, including economic conditions, news events, and global sentiment. In the case of pharmaceutical stocks, factors such as drug approvals, clinical trial results, and regulatory changes can have a significant impact on stock prices.
Conclusion
The recent performance of Nifty Pharma has certainly caught the attention of traders and investors alike. The current consolidation phase within the 15,000 to 15,750 range, with the previous all-time high acting as a support level, has sparked debates about whether a double top pattern is forming or if a bull flag is in play.
While the technical patterns provide important clues, it's crucial to consider the broader market context and fundamental factors that can influence the pharmaceutical sector. Traders and investors should remain vigilant, monitor news developments, and be prepared for various scenarios.
Ultimately, whether Nifty Pharma resumes its rally to create new all-time highs or experiences a reversal, careful analysis and risk management will be essential for anyone looking to navigate the pharma sector in the coming days and weeks.
Long
Long
Long
Bitcoin moving towards Breakout#BITCOIN 2-hr. Chart Analysis
As per present MIL:BTC movements, it will be stucked between $26.9k to $26.5k , if it will be moving into this scale up to 2-3 up-down cycles, then major chances to break-out $26k mark soon with in next 48 hrs.
MIL:BTC already moving under #Bearish Flag in daily chart analysis, that's i previously posted, so as per that scenario too, its next divergence towards FWB:25K first then it will break-out FWB:23K -22k...
Anyway, #DYOR and Trade wisely by using #StopLoss in Crypto, It's just #NFA
and,
Must Share, Like, Comment and Follow it...
Long
Long