Flag
Motherson - Cup and Handle PatternMOTHERSON exhibits a well-defined and technically strong cup-and-handle pattern, confirming a bullish trend continuation signal.
The breakout was clean and heavily volume-supported, and the retest appears to be holdingโa key zone to observe for buyers.
Monitor volume and price action closely: a bounce from current support may signal next leg up, while a failure may invalidate the pattern.
Ideal entry points would be above the breakout necklineโwith stop-loss below the handle and targets based
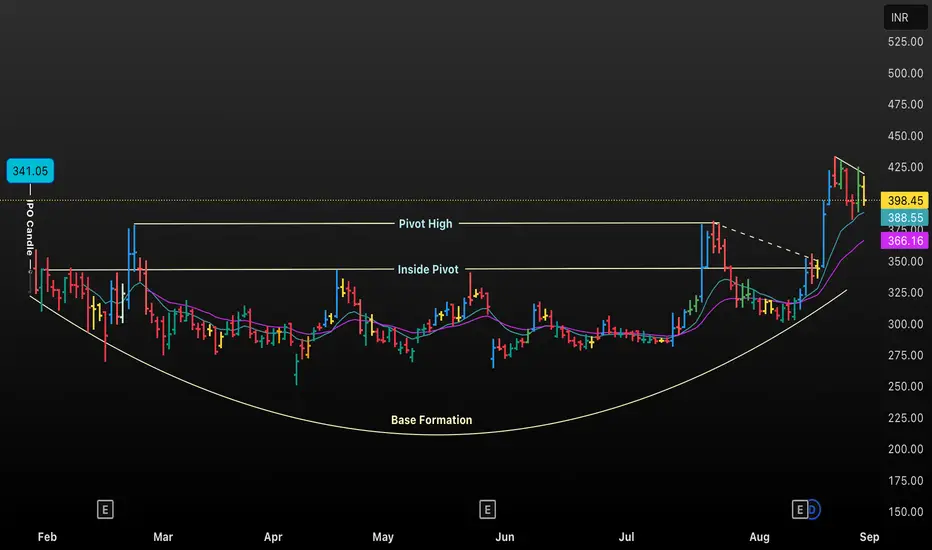
โDENTAโs Breakout Surge: Cup & Handle Pattern SignalsThe chart displays the daily price candles for DENTA, highlighting key technical levels: the Pivot High, Inside Pivot, and the rounded Base Formation that characterizes a classic Cup and Handle chart pattern. The IPO Candle signifies the initial price action post-listing. As prices gradually form a rounded bottom, accumulation occurs, followed by an upward breakout above the resistance (Pivot High), indicating bullish momentum. The colored moving averages provide additional context for trend str
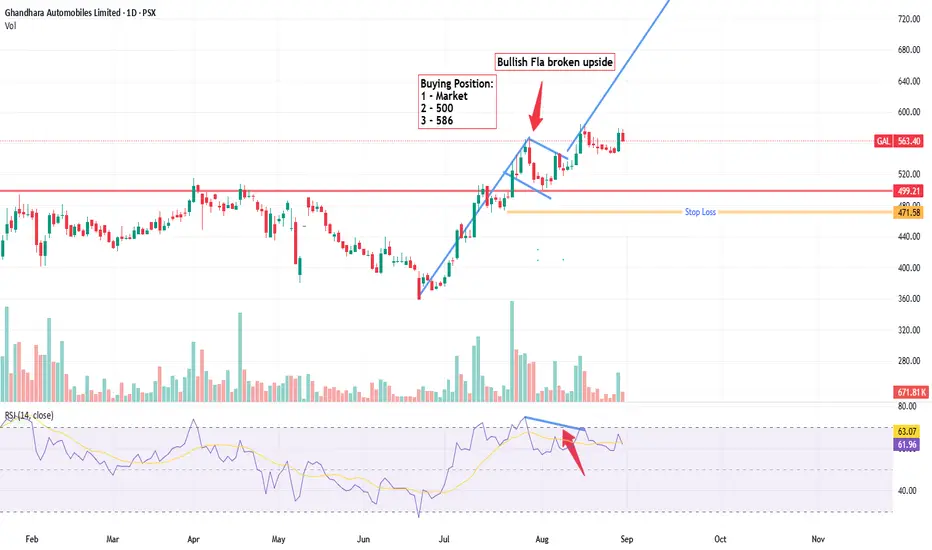
30% buy on each level GAL - PSXI am going to purchase 30% of my portfolio in this stock. What about You?
Let me explain why I am buying so i can keep it as record. I will visit this setup again and review my analysis again.
In all of the fundamental analysis of around 200 PSX companies of PSX, this company comes at No. 1. Here is the reason.
Revenue CAGR of 49.39% second to Sazgar in Automobile Sector.
Net Income / Profit after Tax CAGR for 5 years is as huge as 72%, second to sazgar in Auto Sector.
Net Margin of 14%
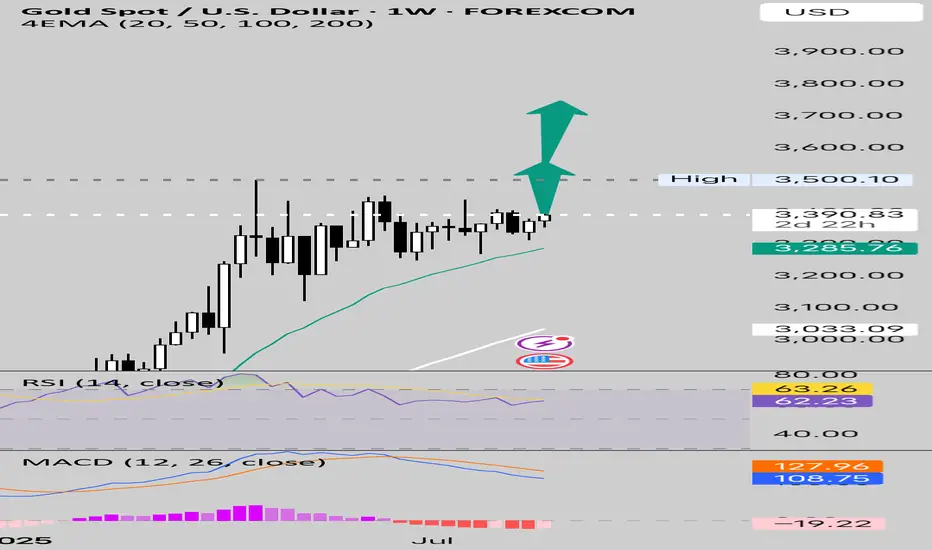
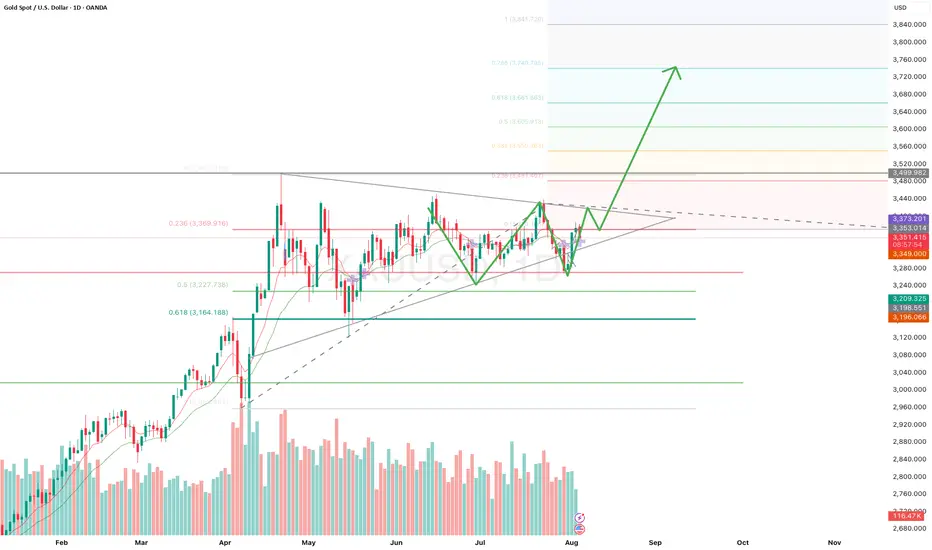
Gold about To Fly! ATH soon!Gold has been In Consolidation for past 5 Months.
4 occasions when it had settled near 3300.
It's about time for Gold to take Shorts For Cleaners?
This time around it's about to Settle near 3400.
3420 3440 will be Crucial for Bears to Defend if they wish to hold grip over this Consolidation.
Longs will get aggressive above 3440 3450 Targeting 3550 3750
๐ฒ
A prolonged consolidation could continue in case 3420 shows Profit Booking
For time Being 3375 3350 looks like providing support.
If
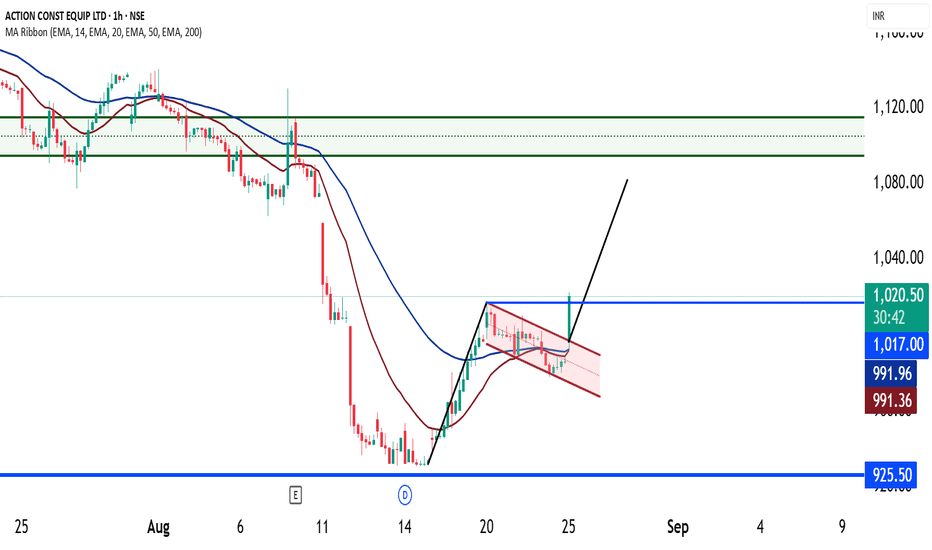
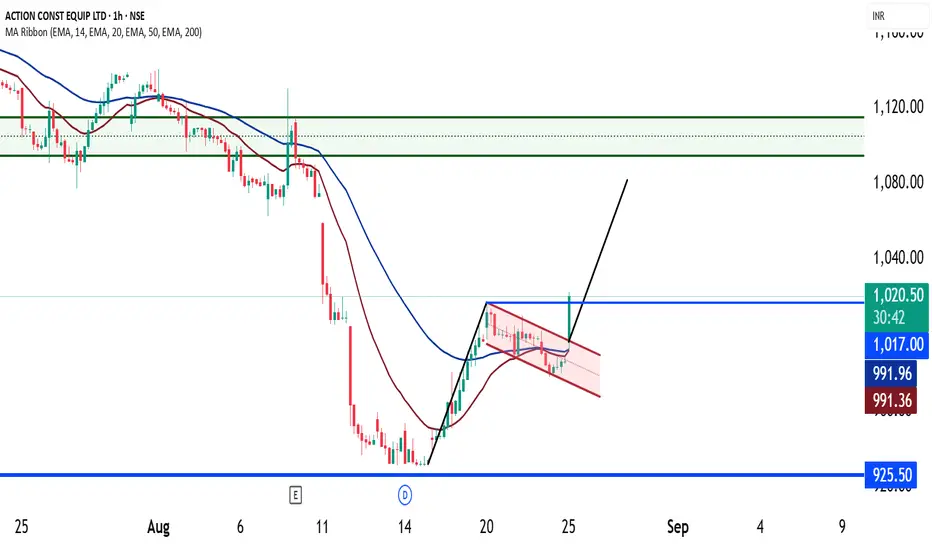
ACE - Breakout of Bullish FlagACE Construction has confirmed an upside breakout from a bullish flag pattern, indicating potential trend continuation. The RSI is rising towards 70, reflecting increasing bullish momentum. Additionally, EMAs are nearing a bullish crossover, reinforcing a short- to mid-term bullish outlook. Sustained volume and price action above key resistances will further validate the move.
UBERUBER has recently exhibited a classic Pole and Flag formation on its price chartโtypically a bullish continuation pattern that indicates a strong upward trend after a brief consolidation. The "pole" reflects the steep and rapid price rise, while the "flag" represents the short-term consolidation or retracement that follows.
A breakout above the flagโs resistance has been observed, signaling renewed bullish momentum. This breakout suggests that the stock could be entering the next leg of its upw
An Upflag Inside an Round bottom consolidation with Gap up B/OUno Minda was consolidating between the 1180-800 price range for past 1.2 years,under a daily time frame.
This is a very good price consolidation with respect to time.
With the recent expectation that the Goverment might slash the GST rate slabs for Automobile Industry, this auto parts maker stock has given a breakout of the rounding bottom consolidation, with an inside upflag break out confirmation too.
Though the breakout has happened with gap up, it is a better candidate for going long, c
Nifty weekly review Aug 18 - Aug 22The price was consolidating in a narrow range over the past two days. The range of 24600 to 24700 has become a zone of resistance. A decisive move is needed to form a trend. Price has formed a bull flag pattern, and below 24500, this pattern becomes invalid.
Buy above 24720 with the stop loss of 24670 for the targets 24760, 24820, 24860, 24900, 24960, 25000, and 25080.
Sell below 24480 with the stop loss of 24530 for the targets 24440, 24400, 24340, 24280, 24200, and 24120.
Always do your analys
Against the Herd: My CAMS Big Short Moment at โน4,000?NSE:CAMS Daily | Contrarian Bear Flag Setup
๐ The Setup
Pole Crash: Collapsed 2,256 pts (โน5,287 โ โน3,031) in 2 months.
Flag Trap: Now stuck in โน4,000โ4,500 range (bulls in denial ๐ด).
Trigger: Daily close < โน4,000 = breakdown confirmed!
Void If: Price climbs > โน4,500 (run away ๐โ๏ธ).
๐ฏ Trade Rules
WAIT PATIENTLY:
Only act after daily close < โน4,000 (no early entries!).
SELL THE BOUNCES:
Short every pullback to โน3,900โ4,000 (zombie rallies).
PROFIT TARGETS:
Quick exit at โน3,500 (bank 12%)
Natural Gas Technical Breakdown Ahead? Eyes on the 264.90 Mark#Commodity
#NaturalGas View:
CMP: 271.70
๐น Resistance Levels:
โข 270.70 โ 273.40
โข 275.00
โข 284.00
๐น Support Level:
โข 264.90
Technical View:
Natural Gas seems to be forming a bearish flag pattern on the hourly & 4 hours chart. The price is currently facing resistance at the pink trendline breakdown level. While it's still early for confirmation, a decisive hourly close below 264.90 may validate the pattern and open the door for further downside. If the pattern plays out, a p
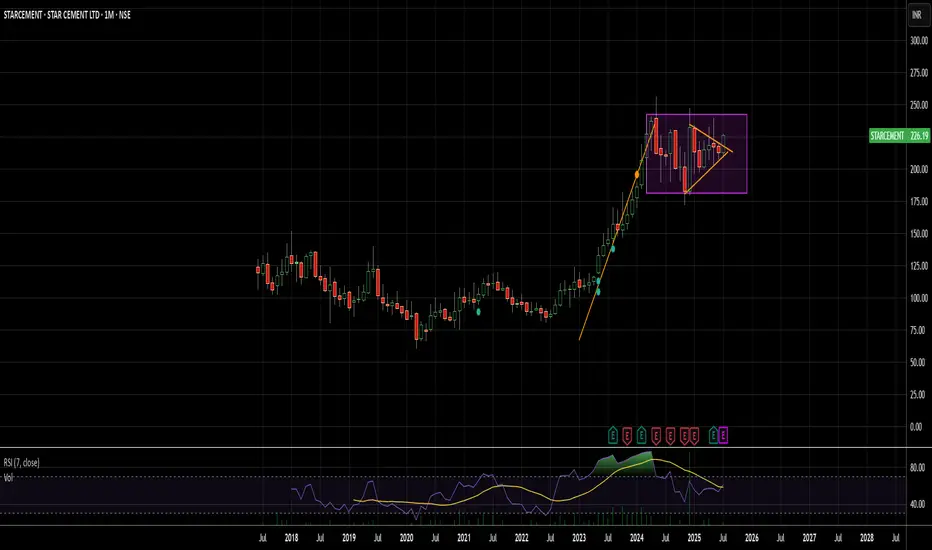
Flag + W Pattern Combo on Monthly! | #SagCem On Radar๐ #OnRadar
#SagCem (Sagar Cements Ltd.)
๐ฉ Flag + W Pattern Combo on Monthly!
๐ Chart Timeframe: Monthly & Quarterly (Educational Observation Only)
๐ Technical Structure Overview:
A rare confluence of bullish patterns spotted:
๐ฉ #FlagPattern โ classic continuation structure
๐ป๐ป #WPattern (Double Bottom) โ bullish reversal signal
๐ผ Both developing inside a long-term #AscendingChannel
๐ฏ Potential Pattern Projections:
Flag Target: 560+
W Pattern Target: 450+
๐ก Suppo
GOLD (XAUUSD) 4H Analysis โ Breakout Imminent from Rising Wedge!Gold is currently trading at 3353.39 after completing a well-defined ABCDE rising wedge structure on the 4H chart. The market is showing signs of exhaustion near the 3353โ3373 resistance zone, with a potential bearish rejection likely to follow.
๐ Key Highlights:
Pattern: Rising Wedge (ABCDE complete) โ a classic bearish reversal setup.
Sell Zone: 3353.88 to 3371.62 โ Expect high volatility and sharp rejection.
Target: 3296.36 โ Marked as the first major support zone.
Risk Management: Stron
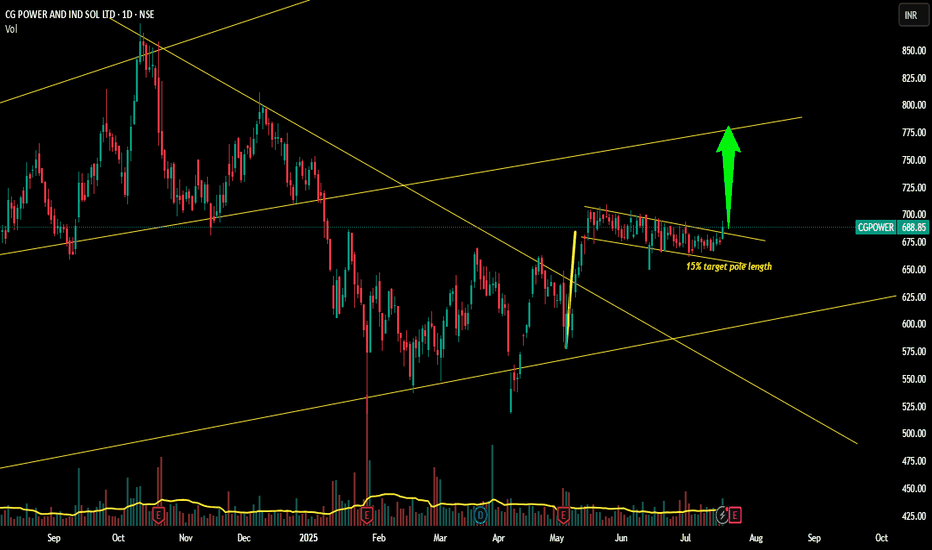
CGPOWER Bullish flag Breakout!!!!Yes!!!
Chart looks good for a good upmove
Weekly chart shows a GOOD BREAKOUT(shown below)
Daily chart shows a Bullish flag and pole and BREAKOUT WITH VOLUME TODAY !!!!
SL can be taken as 666....(bit wider) or the low of todays candle...
Targets-715,730,752
Just my view...not a tip nor advice!!!
Thank you!!!!
Manorama Industries - Flag Pattern Manorama Industries is consolidating from last 2 months, and is ready to explode as it breakout for a ATH. Other factors:
1. Manorama Industries is into a niche business of making exotic fat / butter from vegetable seeds, which are used in Cosmetics, Chocolates and Confectionary.
2. Sales & Profits are increasing - high demand for its products
3. Next 3-4 years growth strategy ready - a plant in Africa, entering in Cocoa Butter Alternative market.
4. After a long jump, stock is consolidating
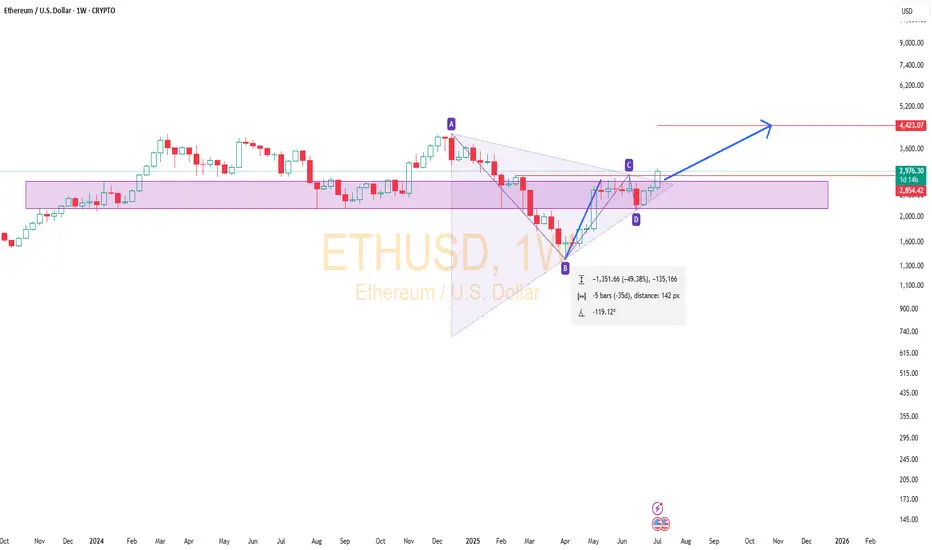
ETHUSD๐ BITSTAMP:ETHUSD Weekly Chart | CMP: $2975
โ
Flag breakout above $2750
โ
Triangle breakout confirmed
๐ Previous range: High $4105 (Dec 2024) โ Low $1385 (Apr 2025)
With current breakout holding, if $2290 (weekly close) holds as stop loss,
๐ฏ Target: $4430 in 12โ18 months
Structure looks strong for long-term upside.
#ETH #Ethereum #Crypto #Altcoins #ChartAnalysis
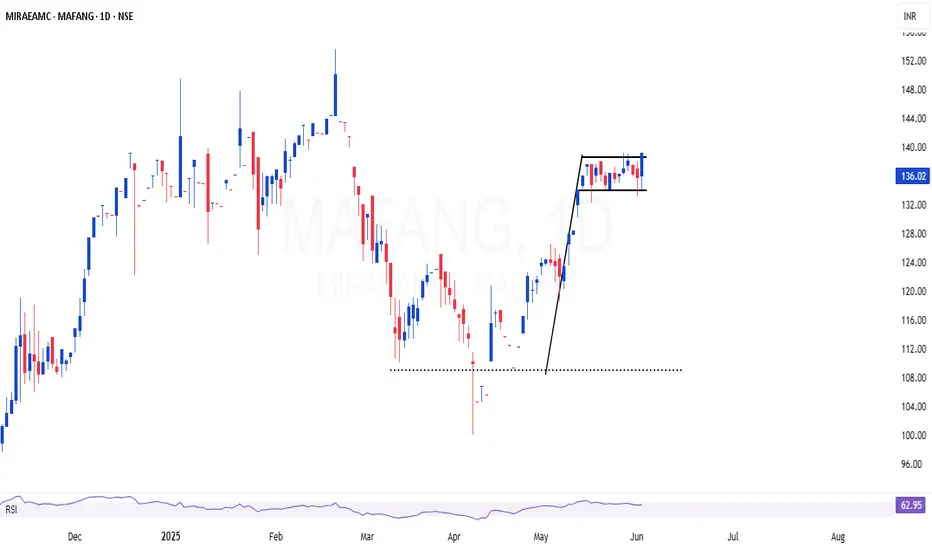
MAFANG | Excellent bull flag setup in top class index fundMAFANG ๐| Strong buy in top class index fund ๐
-Strong uptrend supported by volume
-Consolidation near all-time highs โ bullish structure
-Global tech dominance + AI tailwinds
MAFANG (Meta, Apple, Facebook, Amazon, Netflix, Google) is showing solid momentum and forming a strong technical base in a top-tier index fund.