Flag
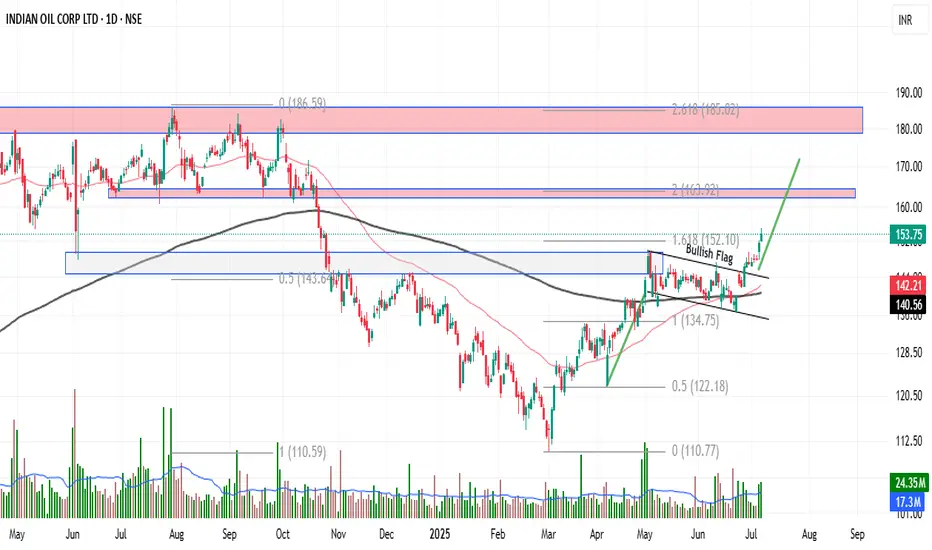
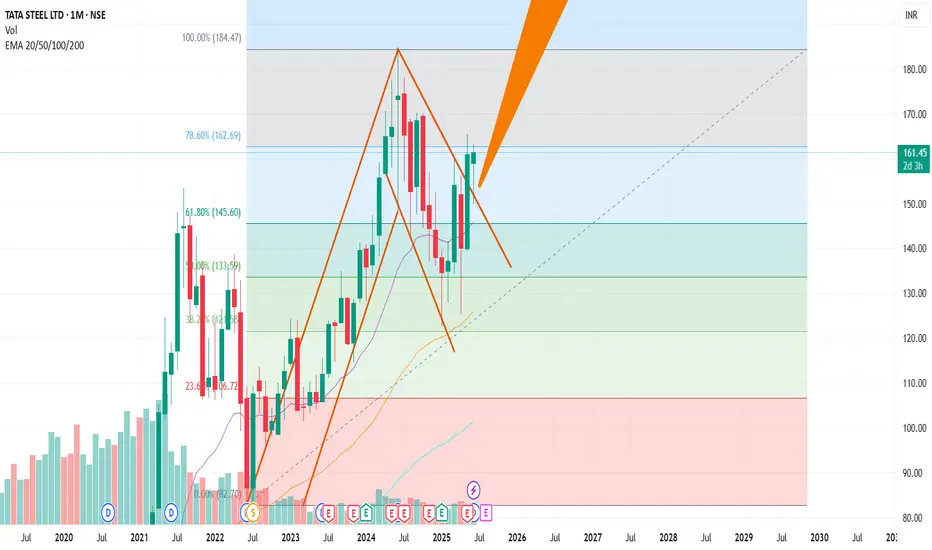
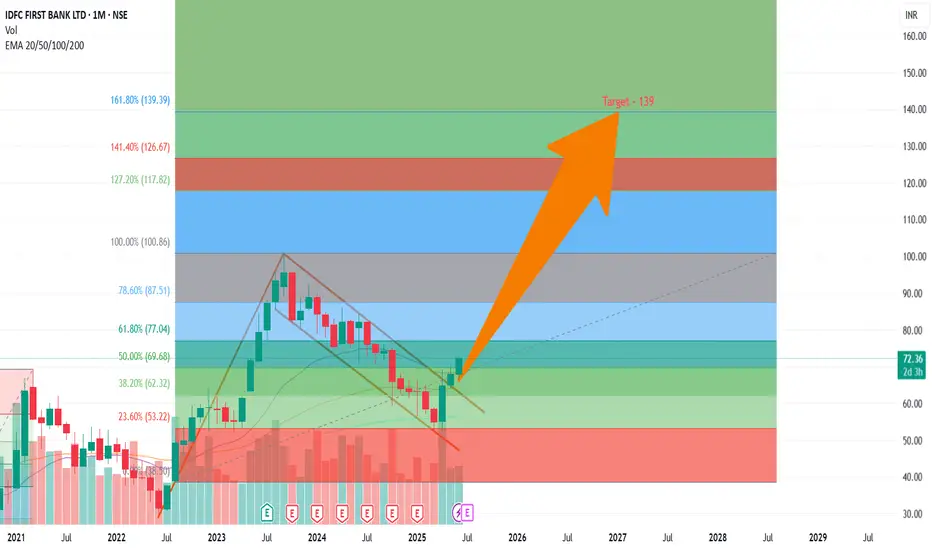
Indian Oil Corporation Limited (IOC)Indian Oil Corporation Limited (IOC), is India’s largest government-owned oil and gas company, operating under the Ministry of Petroleum and Natural Gas.
IOC continued to fall from October last year to March,2025.
And for within 2 months 50% return (145 level), it was this is amazing performance.Currently it's made a bullish flag pattern.
Friends! as per technical chart pattern I want to see in the coming days IOC near 175-180 level.
GLENMMAR PHARMACUITCAL- Bullish Flag & Pole Breakout (Daily T/F)Trade Setup
📌 Stock: GLENMARK PHARMACUITICALS ( NSE:GLENMARK )
📌 Trend: Strong Bullish Momentum
📌 Risk-Reward Ratio: 1:3 (Favorable)
🎯 Entry Zone: ₹1680.00 (Breakout Confirmation)
🛑 Stop Loss: ₹1579.00 (Daily Closing Basis) (-6 % Risk)
🎯 Target Levels:
₹1725.65
₹1775.65
₹1826.70
₹1878.45
₹1926.35
₹1977.00 (Final Target)
Technical Rationale
✅ Bullish Flag & Pole Breakout - Classic bullish pattern confirming uptrend continuation
✅ Strong Momentum - Daily RSI > 60, Weekly RSI >60 Monthly rsi >
Latent view possible breakout after long consolidationLatent view might give a possible breakout as it is showing a long consolidation with flag and pole pattern, high volume was also seen a week back.
Also 55 Ema is below 8, 13, and 21 ema, which shows potential up movement
Buy around 415-420
Target - 508
Duration - 2-3 months
Punjab National Bank Flag Breakout Setup📈 Punjab National Bank (PNB) – Flag Breakout Setup
Observed a classic flag pattern on the daily chart after a strong pole move in 2023–24.
✅ Breakout above the channel confirmed with price action near 113.
✅ Entry plan: Watch for daily close >113 with volume.
✅ Stop-loss idea: Below 106.
✅ Target 1: 140 (first swing resistance).
✅ Measured move projection targets up to ~198 possible based on full flag pole.
Volume confirmation and broader market context will guide the actual trade trigger.
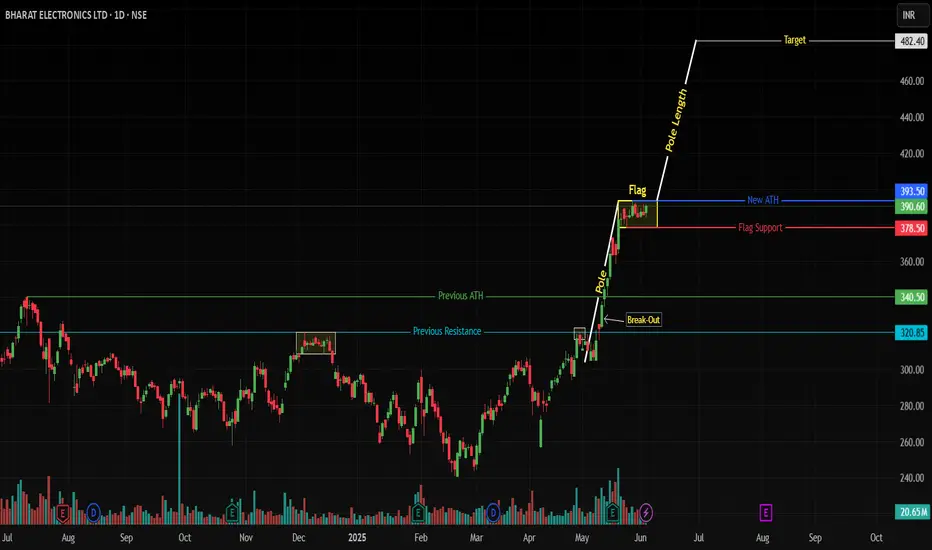
How to Trade ATH Stocks: Harness Explosive Trends with ADX !(BEL Case Study)
NSE:BEL (Daily) - Bull Flag at All-Time Highs
📈 Key Observations
ATH Breakout Confirmed:
Price smashed through ₹340.50 previos ATH, hitting a historic high of ₹393.50.
Consolidation in a tight bull flag (₹378.50–393.50) after a 28.97% surge – classic bullish continuation setup.
ADX: Your Trend Compass 🧭
ADX at 43.95 signals a powerful, directional trend (Readings >25 = strong trend; >40 = explosive momentum).
Ignore oscillator noise: Trends trump RSI/MACD in parabolic move
Abbott india target 34000On weekly charts Abbott india is forming flag and pole pattern. Looks strong on technical charts till now.
Stop loss will be lower end of following flag channel on weekly closing basis.
Once the pattern breakout occurs. Following are the targets -
Target 1 - 31500
Target 2 - 32600
Target 3 - 34000
Don't fall in FOMO mode and wait.
DIVISLAB: Flag & Pole Breakout Setup Targets New ATHsNSE: DIVISLAB | Pharmaceuticals | Large Cap | Updated: June 17, 2025
📊 Technical Structure
Pole Formation: Rally from 4,955 → 6,862 (1,907 points) on high volume
Flag Consolidation: Tight range between 6,490 (support) and 6,800 (resistance)
Key Breakout Trigger: Daily close above 6,862 (ATH)
Pattern Target: 8,769 (6,862 + 1,907 pole length)
Critical Support: 6,300 (confirmed swing low)
🎯 Price Targets & Roadmap
Immediate Target: 7,200 (2024 swing high)
Strong Resistance Zone: 7,600-7,750
ROTOROTO is showing good strength and currently trading above previous resistance line. It is in to consolidation phase. It seems like accumulation has been observed in recent sessions. Now as long as it is closing above 279 then ROTO is very strong and available at very good risk-reward. One may expect 12% to 21% in next rally once it comes from consolidation phase.
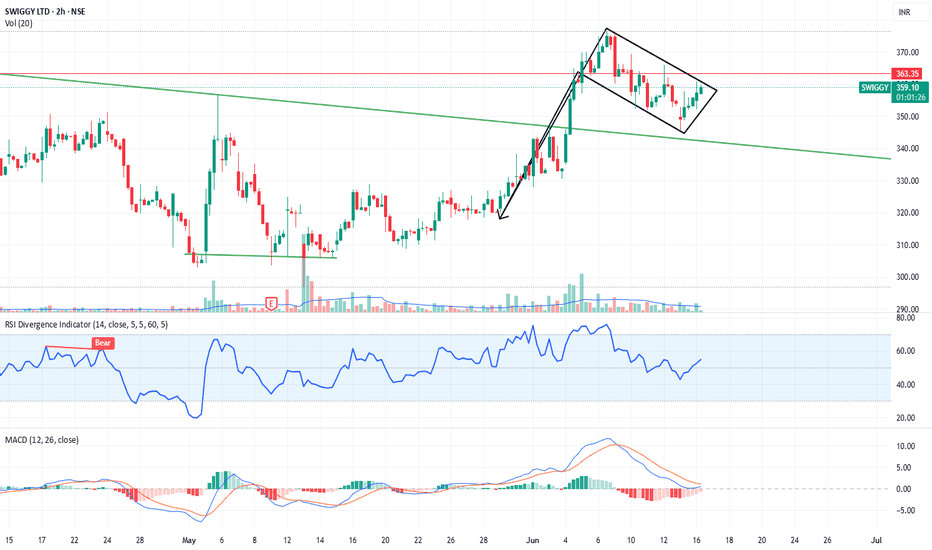
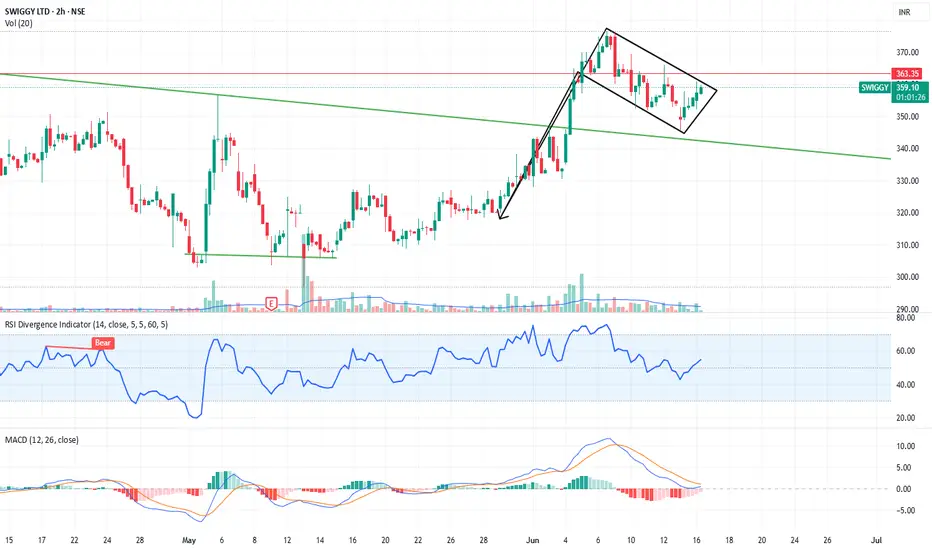
SWIGGY LTD forming a textbook bullish flag on the 2h chartChart Analysis (Study Purpose Only):
Pattern Observed: After a sharp uptrend, the stock has formed a falling channel (bullish flag) — which typically signals a continuation of the trend.
Support/Resistance:
The price is consolidating above a long-term trendline resistance, which is now acting as support.
Resistance zone is near ₹365–₹367, and support is around the ₹340–₹345 range.
Indicators:
RSI is currently at ~60, suggesting mild bullish momentum without being overbought.
MACD is in a
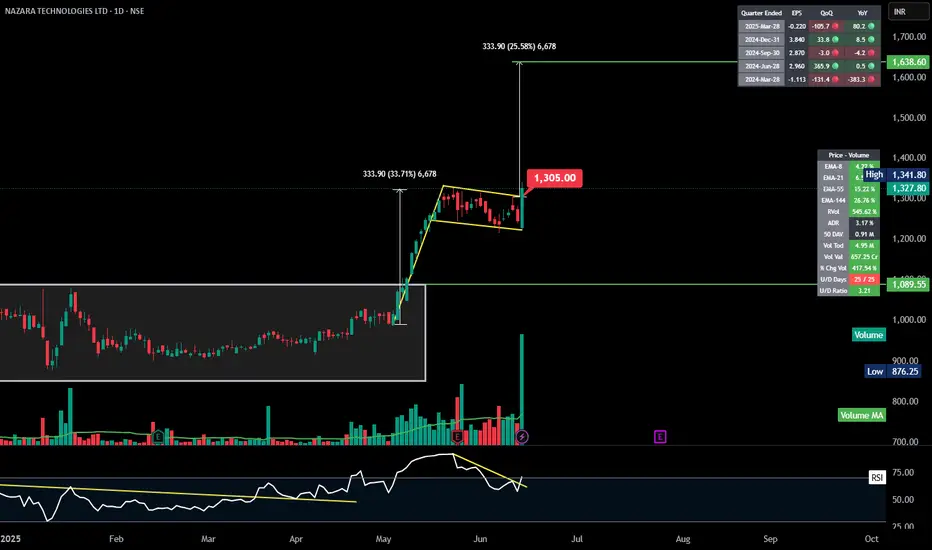
NAZARA | Flag and Pole | Breakout | Daily---
## 🚩 **NAZARA TECH – Bullish Flag and Pole Breakout**
### 📍 **Pattern: Flag and Pole**
* **Pole**: A strong vertical rally of **₹333.90** (\~33.7%)
* **Flag**: A downward-sloping consolidation (tight range), indicating **temporary pause**
* ✅ **Breakout from flag** with **volume spike** confirms continuation
---
### 📈 **Price Action & Levels**
* **Pole Base**: \~₹990
* **Pole Height**: ₹333.90
* **Breakout Point**: \~₹1308
* **Target Projection**: ₹1350+ ₹333.90 = **₹1638** 🎯
---
###
NAHARINDUS | Flag and Pole | Breakout### **1. Trend & Price Movement**
- **Breakout Formation:** The **flag and pole** structure indicates a strong bullish continuation.
- **Current Price Surge:** **7.76% increase**, reflecting momentum buying.
- **Support Levels:** Short-term moving averages (**EMA-8, EMA-21**) are holding, reinforcing near-term support.
- **Resistance Zone:** Watch for prior swing highs as potential resistance points.
### **2. Volume & Market Participation**
- **RVOL:** **386.56%**, showing much higher-than-aver
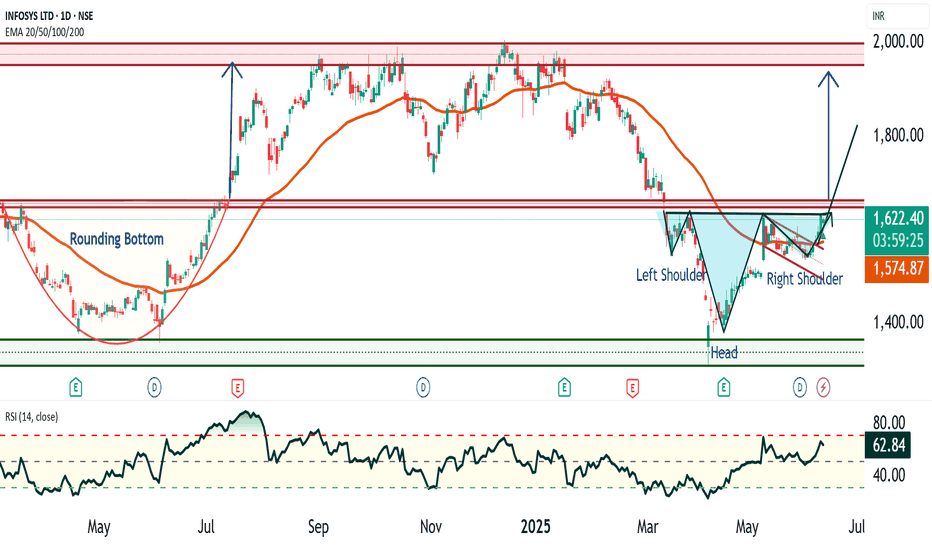
Infosys - Bullish Flag and Head & Shoulder Patterns🔍 1. Infosys Current Price Range and Key Levels
Since January 2021, Infosys has been trading in a broad range between ₹1300 and ₹2000, consolidating for over 4 years. Within this range, there are three key support and resistance levels to watch closely:
Support: ₹1300 (major floor)
Intermediate Resistance/Support Zone: ₹1600 – ₹1650
Strong Resistance: ₹2000 (upper bound)
📈 2. Bullish Flag Pattern: A Bullish Flag is a continuation pattern that forms after a strong upward price move "fla