21/06/2026 GBP/USD AnalysisFOREXCOM:GBPUSD
GBP/USD could use the bearish Daily FVG as support and continue lower to sweep the sell-side liquidity resting below.
However, I don't want price to trade deeply into the Daily Breakaway Gap. If GBP/USD does retrace into that gap, ideally it should only reach the lower 50% of the gap before resuming its move lower toward the sell-side liquidity.
Fractal
21/06/2026 Gold AnalysisFOREXCOM:XAUUSD
Gold could potentially sweep its sell-side liquidity while reacting from its 4H FVG. Given the current geopolitical tensions, that liquidity sweep could happen sooner than expected.
For me to take a short trade on Gold, I need a valid short setup to form on the lower timeframe. If that setup develops, I’ll look for short entries in Gold.
21/06/2026 EUR/USD AnalysisFOREXCOM:EURUSD
EUR/USD may not retrace into its Daily FVG, as it appears to be a Breakaway Gap. Instead of returning to that imbalance, price could continue directly from the current market level and target the sell-side liquidity resting below.
As long as the bearish draw on liquidity remains intact, I'm expecting EUR/USD to seek the remaining sell-side liquidity without necessarily revisiting the Daily FVG.
11/06/2026 EUR/USD AnalysisFOREXCOM:EURUSD
This is my analysis for EUR/USD.
A minor sell-side liquidity sweep has already occurred, but a larger pool of sell-side liquidity still remains below. Before that liquidity can be targeted, I believe a buy-side liquidity sweep is needed first.
Given today's bullish order flow, EUR/USD could react from its 1H FVG, push higher to sweep the buy-side liquidity, and then reverse to target the remaining sell-side liquidity
However, if that 1H FVG becomes an iFVG, the narrative will change. In that case, EUR/USD could use the 1H iFVG as support and still move lower to sweep the remaining sell-side liquidity.
02/06/2026 XAU/USD ( Gold ) AnalysisFOREXCOM:XAUUSD
The reason for taking a short trade on Gold is that price has entered the OTE zone. Since Gold is currently in a downtrend, the probability of a sell-side liquidity sweep remains high.
I entered my initial position at Equilibrium. If Gold retraces deeper into the OTE range, around the 0.62 or 0.705 levels, I may consider adding to the position based on price action and market conditions.
31/05/2026 XAU/USD AnalysisFOREXCOM:XAUUSD
This is my analysis for XAU/USD.
Gold could potentially reverse from its Daily FVG and move lower to sweep the sell-side liquidity. However, I believe it may take some time for that sell-side liquidity sweep to develop. Until then, I’ll continue to monitor price action and wait for confirmation before looking for short opportunities.
31/05/2026 EUR/USD AnalysisFOREXCOM:EURUSD
This is my analysis for EUR/USD.
EUR/USD is currently trading from its Daily FVG and has the potential to deliver a higher-timeframe market structure shift. On the lower timeframe (15M), price has already shown a market structure shift, indicating a possible change in order flow.
With that in mind, EUR/USD could move lower to sweep the remaining sell-side liquidity before continuing with its intended directional move.
31/05/2026 NQ AnalysisCME_MINI:NQ1!
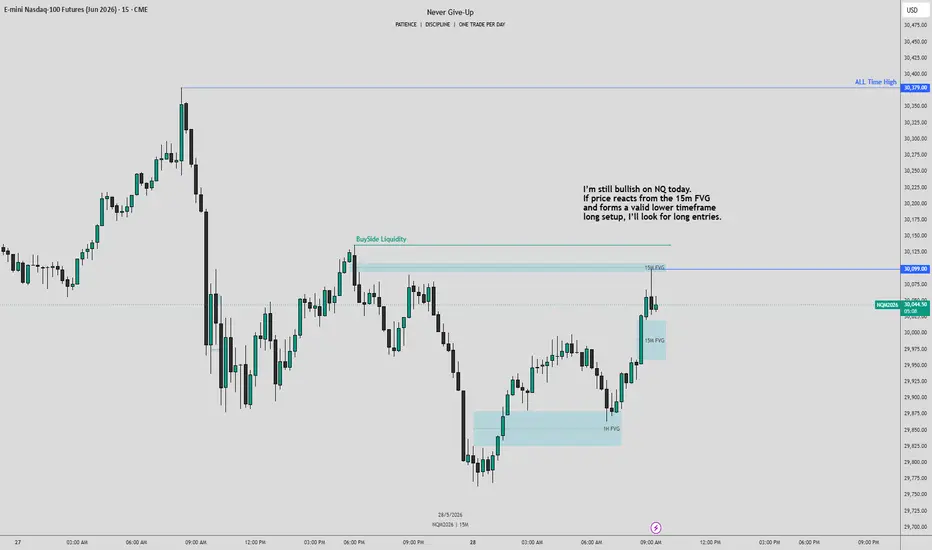
This is my NQ analysis for Monday.
My expectation is for NQ to retrace into its 4H FVG, engineer a liquidity sweep, and then continue higher into the buy-side liquidity.
However, if Sunday’s 6:30 PM ET open creates either a significant gap up or gap down, the scenario will be different. In that case, I’ll reassess the market conditions and adapt to the price action accordingly rather than sticking to a fixed bias.
niftyThe reason I continue to push this idea is because market breadth remains extremely weak and overall sentiment is deeply negative — conditions that are typically observed during a Wave 2 correction in Elliott Wave structure. Breadth indicators and sentiment analysis help reveal the underlying mood of the market, and historically, they have proven to be reliable tools in identifying these corrective phases
ITC 3M: Liquidity Grab at Highs → Bearish Expansion Toward FVG### **Market Context**
* Price has tapped into **External Liquidity (~470 zone)**
* A clear **manipulation phase** is visible at the top (distribution)
* Strong bearish displacement confirms **shift in order flow**
* Price is now likely seeking **inefficiencies (FVG) below**
---
## **Primary Bias: Bearish (HTF Correction Phase)**
---
## **Trade Plan**
### **Entry Zone (Sell Setup)**
* Watch for pullback into:
* **315 – 320 zone** (−1 level / supply reaction)
* Confirmation:
* Weak bullish candles
* Lower timeframe CHoCH / BOS
* Rejection wicks
---
### **Targets**
1. **Target 1:** 272 (−1.5 level)
2. **Target 2:** 240–250 (3M FVG fill)
3. **Target 3:** 228 (−2 level)
4. **Extended Target:** 185 (−2.5 level)
---
### **Stop Loss**
* Above **402 (0 level)**
* Conservative stop: above **recent swing high (~445)**
---
## **Alternative Scenario (Bullish Continuation)**
* If price **reclaims 402 and sustains above**, expect continuation toward **470 liquidity sweep**
* This invalidates the bearish setup
---
## **Key Concepts Used**
* External Liquidity Grab
* Smart Money Manipulation Phase
* Fair Value Gap (FVG)
* Fibonacci Expansion (−1, −1.5, −2 levels)
---
## **Summary**
Liquidity taken at highs followed by bearish displacement suggests a pullback sell setup, targeting inefficiencies and lower manipulation levels.
---
The Plan Is Playing Out Exactly — What Comes Next?As I explained in my intraday analysis earlier this week (up to Tuesday), the market has reacted exactly according to the projected scenario so far. You can review my last two pre-session analysis charts for confirmation.
In the current scenario, price has tapped the 5170.00 level, which aligns with a 1H timeframe bearish order block, twice — and importantly, no candle body has closed above this level. The recent swing low has formed within the weekly opening gap. However, both the 4H and 1H timeframes continue to show bearish market structure.
Today’s Tuesday candle is closing below the equilibrium low of Monday’s candle, which most likely signals a retracement toward the 5070–5040 zone.
Smart money always moves with precise calculation and timing. With the upcoming geopolitical announcement between the U.S. and Iran scheduled for Thursday, market reaction from this zone will be critical. Either price will turn bullish from this area, or a breakdown could lead the market toward the 4700 zone once again.
Gold spot XAUUSD high-Probability Institutional Reaction Zone Last week Friday, 20-02-2026 Market has closed at 5108 FOREXCOM:XAUUSD , maintaining bullish intent after sweeping liquidity.
Current price action suggests a potential continuation setup backed by multi-timeframe confluence.
Liquidity Based Narrative:
• Price engineered a strong sell-side liquidity swept before reaching the current premium area — indicating smart money accumulation.
• 15M & 1H Bullish Order Blocks are perfectly aligned inside a Fibonacci Deep Discount Zone, increasing reaction probability.
• Market tapped the 4H Order Block Mean Threshold, confirming higher-timeframe participation.
• Opening price sits at 5072.00, while the Order Block Equilibrium (50%) rests near 5065.00 — a key efficiency level where buyers may re-enter.
𝑯𝑴𝑨𝑻𝟗𝟐’s methodology :
✅ Liquidity taken → imbalance created
✅ HTF order flow respected
✅ Discount pricing inside bullish structure
✅ Multi-timeframe alignment
Expectation:
As long as price holds above the equilibrium zone (5065), dips into the order block may offer continuation opportunities targeting higher liquidity pools.
⚠️ This is a price-delivery model perspective — wait for confirmation and proper risk management.
What’s your bias on Gold this week — continuation or deeper retracement? Please comment.
EURUSD | 15M | Smart Money Concept OutlookMarket Structure:
Price is currently delivering a short-term bullish repricing following a displacement from the internal range low near 1.1775. The sequence of higher highs and higher lows confirms an intraday shift in structure, suggesting that buy-side liquidity has been engineered to facilitate a move into premium pricing.
Liquidity Narrative:
The recent impulsive leg cleared multiple internal liquidity pools, including prior equal highs and resting stop clusters. Price is now trading directly into a well-defined supply zone that aligns with a higher-timeframe premium array. This region is a classic smart money distribution pocket where late buyers often become liquidity for institutional positioning.
Order Flow & Imbalance:
The rally shows clear displacement characteristics with minimal overlap, leaving behind inefficiencies that may act as a magnet should price rotate lower. Additionally, the current consolidation beneath resistance resembles a potential buy-side liquidity build-up. A sweep of these highs would complete the liquidity engineering phase before a probable bearish expansion.
POI (Point of Interest):
Premium supply zone: ~1.1830 to 1.1845
Internal resistance acting as a distribution ledge
Untapped sell-side liquidity resting below 1.1780
Execution Model:
The preferred scenario involves a liquidity sweep above the short-term highs followed by bearish market structure shift on the lower timeframe. Confirmation through displacement and fair value gap formation would strengthen the short thesis.
Draw on Liquidity:
If the distribution unfolds as anticipated, price is likely to rebalance toward the sell-side liquidity pool near 1.1775, completing a premium-to-discount delivery cycle.
Invalidation:
Sustained acceptance above the supply zone with strong displacement would indicate continuation, signaling that the market is seeking higher external liquidity rather than distributing.
Summary:
Price is trading in premium territory after a liquidity-driven expansion. The environment favors patience, allowing smart money to reveal intent. Watch the highs carefully; what appears as breakout fuel often becomes the trapdoor.
BTCUSD · 15M · SMC UpdateBuy-side liquidity above prior highs has been partially swept.
Rejection from supply shows acceptance failure in premium.
Market is now rotating back toward equilibrium.
LTF Structure
Impulsive move up completed.
Bearish response from supply with follow-through.
Current pullback is corrective, not impulsive.
Bias & Expectation
Favor shorts while price remains below the supply high.
Anticipate continuation lower toward:
Range low / EQ
Prior imbalance
HTF discount zone below
KOTAK Bank: Weekly Liquidity Sweep → H4 MMBM Signals Buy-Side ExI am sharing a trading idea on Kotak Bank based on Smart Money Concepts (SMC).
Price has already taken weekly ERL (External Range Liquidity) and then moved back into IRL (Internal Range Liquidity), indicating a higher-timeframe liquidity grab and potential rebalancing phase.
On the H4 timeframe, price is forming a Market Maker Buy Model (MMBM).
The sell-side curve has been completed, suggesting downside liquidity has been fully taken. After this, price has started transitioning into the buy-side curve, which points toward a possible bullish expansion.
This structure suggests that smart money may now seek buy-side liquidity, provided price continues to respect higher-timeframe structure and holds above key demand areas.
This idea is for educational purposes, and confirmation should be taken using proper entry models, risk management, and market conditions.
NQ1! 14/11/2025 outlookBias → Bearish
Large sell-off yesterday on both S&P 500 and Nasdaq.
Both filled week opening gaps and are holding below.
Another “b-shaped” daily profile yesterday indicating value is lower
Nasdaq closed inside 7th november's value area
Looking for value retest to 24,810 OR low of 24,708.25
XAUUSD : 06/10/25 - TP hit 1.Entry - NYSE session when FVG + P1 confirmed
2. MSS shift happend in 2 min during NY session
3. Entered during pullback
4. there are no High Resistance in either 4 hour or 1 hour but had one High resistance is there in 30 min TF , hence booked full at ATH
4. Closed full at 1:3
#ICT
Overall trend bullish hence looked for buy setups only
Smart Money Play: Watching HDFC Bank’s Bullish ZoneTrading Idea: HDFC Bank (NSE: HDFCBANK)
Price is currently trading around ₹976 after a recent pullback.
Key Observations:
Break of Structure (BOS) confirms bullish market structure.
Liquidity sweep around recent highs.
Daily Fair Value Gap (FVG) spotted between ₹910–₹930.
Bullish Order Block at ₹800–₹830 acting as strong higher timeframe support.
Plan:
Expecting a retracement into the Daily FVG zone (₹910–₹930).
If price reacts bullishly here, potential upside rally towards ₹1,040+.
Confirmation: Look for bullish reversal candles or demand zone rejections inside FVG.
Risk Management:
Aggressive entry: near FVG zone (₹910–₹930).
Conservative entry: only after bullish confirmation.
Stop-loss: below ₹890.
Targets: First TP at ₹990, extended TP at ₹1,040.
Bias: Bullish (after retracement).
Disclaimer: This is not financial advice. For educational purposes only. Please do your own research or consult with a financial advisor before making any investment decisions.