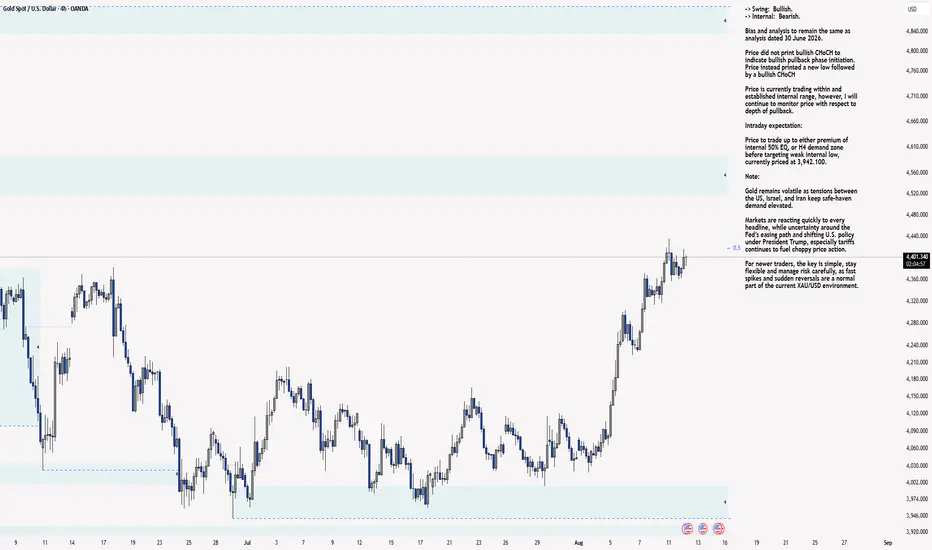
XAU/USD 17 August 2027 Intraday AnalysisH4 Analysis:
-> Swing: Bullish.
-> Internal: Bearish.
Bias and analysis to remain the same as analysis dated 30 June 2026.
Price did not print bullish CHoCH to indicate bullish pullback phase initiation. Price instead printed a new low followed by a bullish CHoCH
Price is currently trading within and established internal range, however, I will continue to monitor price with respect to depth of pullback.
Intraday expectation:
Price to trade up to either premium of internal 50% EQ, or
Fractal
MONTHLY RESET HAS REACHED THE HISTORICAL BOTTOM ZONE
This chart is important because two different long term signals are arriving at the same place at the same time. Bitcoin has moved back toward the lower band of its logarithmic Bollinger structure, while monthly RSI has fallen into the same region that appeared around previous major cycle bottoms. The combination tells us much more than the recent decline alone.
The logarithmic bands have worked as a long term expansion and reset framework throughout Bitcoin’s history. During strong phases, pr
AMD: Bull Flag Breakout Nears – Targeting $724 ?!?The trend is clear— only up . AMD has formed a textbook bullish correction structure on the 4H chart after an aggressive impulse.
This Flag Pattern is the exact vehicle we are looking for to catch the next leg .
Entry approaches are twofold. Do not pre-empt the move. We wait for either:
A confirmed breakout above the flag's descending resistance with volume.
Or, a structural pullback into the 450-466 area, confirmed by a Daily timeframe rejection (bullish engulfing, long lower wick, or
Visa with a potential breakout to 422Visa has been pushing higher since April and is currently consolidating below all time highs. On a solid push through that level with volume I am looking for expansion to the next fibonacci extension.
I am willing to risk down below the consolidation lows. If we test lower before the breakout I will reevaluate the RR, but for now it's about a 2.5 to 1
THE EASY PART MAY BE OVER
Gold has already completed a very strong repricing phase. The move from the 2024 base into the 2026 peak pushed price above 5,000 dollars and created the type of acceleration that usually cannot continue at the same speed forever. What matters now is not whether gold remains structurally strong over the long term. The more important question is whether the market has entered a longer reset after that expansion.
The first warning is the loss of momentum after the peak. Gold failed to maintain
Buy for the short term Sell for the long termBuy for the short term
Sell for the long term
I am looking for an excuse to sell from the specified areas, especially the Asian ceiling, but from the Asian ceiling, which is below the 4-hour overflow, I am looking for an excuse to buy short term only up to the Asian ceiling.
XAU/USD 14 August 2026 Intraday AnalysisH4 Analysis:
-> Swing: Bullish.
-> Internal: Bearish.
Bias and analysis to remain the same as analysis dated 30 June 2026.
Price did not print bullish CHoCH to indicate bullish pullback phase initiation. Price instead printed a new low followed by a bullish CHoCH
Price is currently trading within and established internal range, however, I will continue to monitor price with respect to depth of pullback.
Intraday expectation:
Price to trade up to either premium of internal 50% EQ, or
XAU/USD 13 August 2026 Intraday AnalysisH4 Analysis:
-> Swing: Bullish.
-> Internal: Bearish.
Bias and analysis to remain the same as analysis dated 30 June 2026.
Price did not print bullish CHoCH to indicate bullish pullback phase initiation. Price instead printed a new low followed by a bullish CHoCH
Price is currently trading within and established internal range, however, I will continue to monitor price with respect to depth of pullback.
Intraday expectation:
Price to trade up to either premium of internal 50% EQ, o
I have two options in mind: the overall trend is tuberculosis.There are about 15 sell orders, but we are in a minor buy mode. If it closes above the last high, I expect it to close above the sell zone for a short-term buy, but if it closes below the last low, you will sell on a pullback to the specified buy order block.
XAU/USD 12 August 2026 Intraday AnalysisH4 Analysis:
-> Swing: Bullish.
-> Internal: Bearish.
Bias and analysis to remain the same as analysis dated 30 June 2026.
Price did not print bullish CHoCH to indicate bullish pullback phase initiation. Price instead printed a new low followed by a bullish CHoCH
Price is currently trading within and established internal range, however, I will continue to monitor price with respect to depth of pullback.
Intraday expectation:
Price to trade up to either premium of internal 50% EQ, o
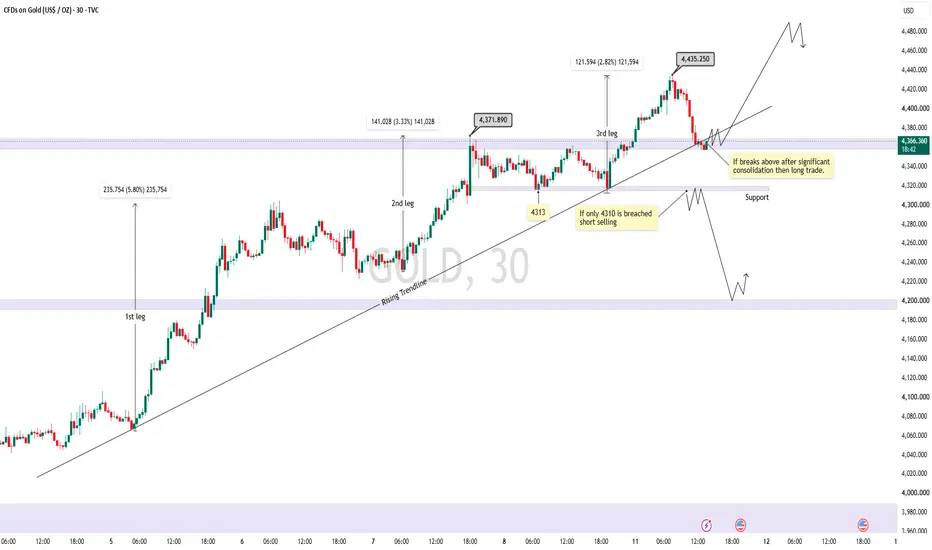
Has gold peaked already, decline to continue?After yesterday's up move price had retested an important resistance of 4435 and has retraced form there, currently taking support of 4371 (immediate resistance) which is at the vicinity of rising trendline, which may result into additional bullish pressure.
If you zoomed-out a bit you'll see each consecutive up-moves after the corrections in this uptrend is continuously declining, which signals weakening of the trend and may show some deeper correction. We should be actively looking for some s
XAU/USD 11 August 2026 Intraday AnalysisH4 Analysis:
-> Swing: Bullish.
-> Internal: Bearish.
Bias and analysis to remain the same as analysis dated 30 June 2026.
Price did not print bullish CHoCH to indicate bullish pullback phase initiation. Price instead printed a new low followed by a bullish CHoCH
Price is currently trading within and established internal range, however, I will continue to monitor price with respect to depth of pullback.
Intraday expectation:
Price to trade up to either premium of internal 50% EQ, or