SHRIRAMFIN Approaching Key Trendline BreakoutSHRIRAMFIN is currently trading inside a well-defined descending channel after a strong prior uptrend. The stock has been consolidating over the past few weeks while respecting both the upper resistance trendline and lower support trendline.
Price is now approaching the upper boundary of the channel near the ₹1,020–₹1,030 zone, making this an important area to watch for a potential breakout. A sustained move above the descending resistance trendline could indicate the end of the corrective phase and the beginning of the next bullish leg.
Despite recent volatility, the broader structure still remains constructive as long as the stock continues to hold higher support levels. The recent bounce from the lower channel support around ₹880–₹900 suggests buyers are still active on dips.
Key Levels
Resistance
₹1,020 – Immediate resistance / trendline zone
₹1,080 – Previous swing high
₹1,110 – Major breakout level
Support
₹960 – Near-term support
₹900 – Strong channel support
₹880 – Breakdown support
Bullish Scenario
A breakout and close above the descending channel resistance could open upside targets toward:
₹1,080
₹1,110
Higher continuation if momentum sustains
Bearish Scenario
Failure to break the trendline may keep the stock inside the consolidation range, with possible retest of ₹960 and ₹900 support zones.
Conclusion
SHRIRAMFIN is at a technically important point where price compression inside the falling channel could soon lead to a directional move. Traders should closely monitor trendline breakout confirmation for the next swing opportunity.
Not financial advice. Trade with proper risk management.  Long
Long
 Long
Long
 Long
Long
Nifty -50 Pre open setup 08 May 2026Key geopolitical themes from May 7-8, 2026, center on the US-Iran conflict and potential de-escalation.
Renewed hopes for a peace deal or truce between the US and Iran, with talks, proposals (e.g., via intermediaries), and pauses in operations like “Project Freedom” to reopen the Strait of Hormuz. This has driven optimism, easing supply disruption fears, and supported equity rallies while pressuring oil prices lower (with volatility as markets await Iranian responses).
Ongoing stalemate risks: Blockades, energy supply concerns, and potential escalation could still spike oil/volatility if talks fail. Broader context includes elevated global geopolitical risks, US policy shifts, and impacts on inflation/energy.
These developments can materially sway markets via oil prices, risk sentiment, and safe-haven flows (gold/silver).
Recent closes/last known levels (as of May 7-8, 2026 data):
Gold: Around $4,700–$4,739/oz (spot/futures near recent highs, with fluctuations tied to geopolitics and dollar moves).
Silver: Around $78–$81/oz (strong gains recently amid industrial demand and safe-haven flows).
Brent Crude Oil: Closed near $98–$102/bbl on May 7 (volatile; dipped below $100 on deal hopes before partial recovery; earlier spikes above $100–$110 from tensions).
Dow Jones: Closed around 49,597–49,911 (mixed session, with prior gains on rally momentum).
NASDAQ: Closed around 25,806–25,839 (tech-led strength amid broader optimism).
GIFT Nifty at/around 08:30 AM IST (May 8): Trading near 24,285 (down ~0.4% or so from prior close around 24,380), with intraday range observed ~24,260–24,531 in recent updates. This suggests a mildly negative to flat cue for Indian markets.
Nifty support/resistance and performance outlook:
Recent analyses point to Nifty consolidating around 24,000–24,500 zone. Typical levels for May 8 context
Support: 24,000–24,250 (key floor; stronger at 23,800–24,050 in some views); breakdowns could test lower.
Resistance: 24,400–24,500–24,750+ (break above 24,250–24,500 for bullish confirmation).
Performance drivers:
Positive GIFT Nifty/flat-to-positive open + de-escalation news → Risk-on bias, potential upside toward resistance if oil stabilizes lower.
Negative GIFT or escalation fears → Pressure on oil-sensitive sectors, flight to safety (boosting gold/silver), and Nifty testing supports.
Overall: Cautious consolidation likely, with volatility from global cues. Bulls resilient above key supports; watch crude closely.
Time-specific Nifty movement projections (May 8): These are inherently uncertain and depend on global cues, news flow, and order flow—markets are probabilistic. No one can guarantee accuracy, but based on typical pre-open/GIFT cues and recent patterns:
Pre-open: Likely flat to mildly negative gap (mirroring GIFT 24,285), setting tone around 24,200–24,400. Watch for volatility on any overnight news.
09:15–10:00 (opening hour): Range-bound or directional push based on momentum—possible early test of 24,250 support or attempt toward 24,400–24,500 if buying emerges. High volume period; gaps often fill or extend here.
11:00–12:00: Mid-morning digestion—potential consolidation or breakout attempt. Positive global sentiment could lift toward resistance; weak oil/news might see profit-taking toward supports.
14:00–15:06 (last hour+): Often sees directional moves, positioning, or F&O expiry effects (if relevant). Expect volatility spike; closing bias could depend on whether key levels (e.g., 24,250 or 24,500) hold/break. Late reversals common.
So that brings us to a question What factors do you see as most influential for today's Nifty trajectory—GIFT moves, oil prices, or specific news flow?
How might different Iran deal scenarios shift supports/resistances in your view? What risk management would you apply given the uncertainty?
This helps refine our reasoning together.
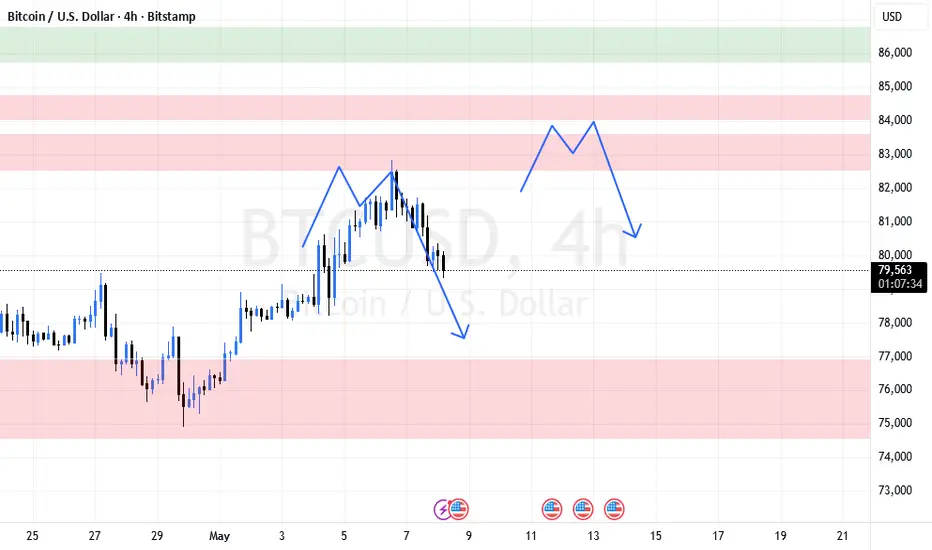
Take care and have a good day. BTCUSD (4H) Analysis: Watching for the Next Move | SMC SetupHello Traders,
Taking a fresh look at the Bitcoin (BTCUSD) 4H chart. We recently saw a strong rejection from the top, and the price is currently pushing down, breaking minor structural levels.
Based on SMC (Smart Money Concepts), I have mapped out the potential price action using the blue paths. Here is what I am watching:
📊 My Trade Plan:
Current Move (Downwards): The price is currently heading down. I am waiting for it to reach the major Demand Zone resting around the $75,000 - $76,500 area (lower red box). I am not looking to buy here blindly.
The Pullback (Upwards): After tapping the demand zone and finding support, I expect a pullback towards the upside to mitigate the fresh Supply Zones created during this recent drop (around the $83,000 - $84,500 area).
The Execution (Short Setup): If the price rallies back up to those unmitigated supply levels (upper red boxes), I will be looking for Lower Timeframe (LTF) confirmations like a CHoCH. A rejection there would be a prime opportunity to look for high-probability short entries.
💡 Key Takeaway: Let the market do its thing right now. Patience is key. I'm waiting for the price to develop the structure before committing to a trade.
⚠️ Disclaimer: This analysis is for educational purposes only. Always use proper Risk Management.
What are your thoughts on BTC right now? Are we going straight down or will we see that pullback first? Let me know in the comments and hit the LIKE button! XAUUSD (1H) Setup: Waiting for a Deep Pullback for next LevelHello Traders,
Taking a look at the Gold (XAUUSD) 1H chart, the overall structure remains heavily bullish. Recently, the price tapped into a minor supply zone around the 4755 - 4765 area and is currently undergoing a retracement.
Based on SMC principles, I am not interested in catching the falling knife or buying in the middle of this range. As indicated by my blue projected path, here is the game plan:
📊 Trade Plan:
The Pullback: I am anticipating a deeper pullback into the major, unmitigated Demand Zone located around the 4630 - 4660 level (marked in red/green box at the bottom). This is a high-probability POI because it was the origin of the previous massive impulsive push.
The Execution: Once the price mitigates this lower demand zone, I will drop down to Lower Timeframes (15m/5m) and wait for clear bullish confirmations—such as a CHoCH (Change of Character) or a liquidity sweep.
The Target: If the setup is confirmed, I will look for long entries to ride the trend back up, targeting the recent highs and potentially the 4800 level.
💡 Key Takeaway: In SMC, patience pays. Let the retail traders get chopped up in the middle. We wait for the price to come to our specific Points of Interest.
⚠️ Disclaimer: This analysis is for educational purposes only. Always use proper risk management.
Do you think Gold will drop to this demand zone before flying? Let me know your thoughts in the comments and smash the LIKE button! Bank Nifty (15m) Setup: Critical Supply & Demand Levels to WatchHello Traders,
Looking at the Bank Nifty (15m timeframe), the price is currently holding around the 56,093 level after a decent push up. Based on SMC (Smart Money Concepts), the current price action is hovering in no-man's land. I'm waiting for the price to tap into the high-probability zones I’ve marked on the chart.
Here is my game plan for the upcoming sessions (indicated by the blue paths):
📊 Trade Scenarios:
Scenario 1 (Sell from Supply): If the price rallies from here, I am closely watching the unmitigated Supply Zone located between 56,500 - 56,700 (highlighted in red). A tap into this zone with a bearish LTF confirmation (like a CHoCH) will be my signal to look for short opportunities.
Scenario 2 (Buy from Demand): If the price starts to retrace downwards, the major Demand Zone to watch is around the 55,100 - 55,300 area. If the price mitigates this zone and provides bullish LTF confirmation, I will be looking for a long setup to catch the next leg up.
💡 Key Takeaway: The key to SMC is patience. I am not taking any trades in the middle. Let the price come to the defined POIs (Points of Interest) and then execute with strict risk management.
⚠️ Disclaimer: This analysis is for educational purposes only and not financial advice.
Which direction do you think Bank Nifty is headed first? Let me know your thoughts in the comments and hit that LIKE button! NIFTY 50 (15m) Intraday Setup: Two Key POIs to WatchHello Traders,
Looking at the Nifty 50 (15m timeframe), the price is currently consolidating in the middle of a range. Based on SMC principles, I have marked two critical Points of Interest (POIs) where we can expect high-probability reactions.
Here are the two potential scenarios I am watching (as indicated by the blue paths):
📊 Trade Plan:
Scenario 1 (Sell Setup): If the price pushes higher, I am looking at the unmitigated Supply Zone around the 24,450 - 24,500 levels. If price taps into this zone and gives a Lower Timeframe (LTF) CHoCH or liquidity sweep, I will look for short entries targeting the current lows.
Scenario 2 (Buy Setup): If the price drops from the current level, I am keeping a close eye on the Demand Zone resting around 24,060 - 24,100 (marked by the black lines). A tap into this zone followed by bullish LTF confirmation will be my cue to look for long positions.
💡 Key Takeaway: The middle area is choppy. It's best to wait patiently for the price to reach either of these extreme zones before executing. Let the market come to you!
⚠️ Disclaimer: This analysis is for educational purposes only. Always manage your risk properly.
Which zone do you think Nifty will test first? Let me know in the comments and smash the LIKE button  Long
Long
 Short
Short
 Short
Short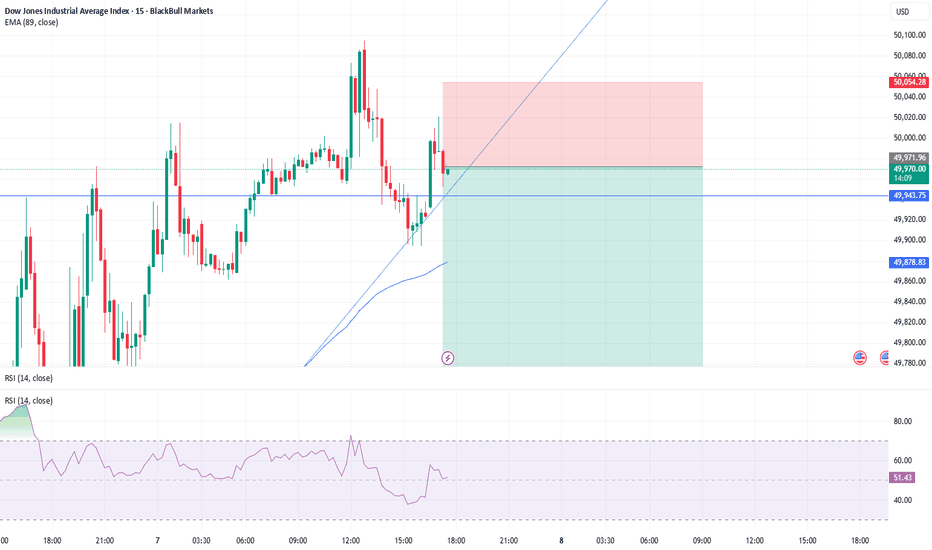
Long 
Gold’s Last Stand: Safe Haven Demand Ignites at Key Support!MCX GOLD: Bullish Divergence or Bearish Trap? The Technical Breakdown.
Major Support Zone: Price is currently hovering and reacting off a significant horizontal support zone (the blue shaded area) between 146,000 – 148,000. This area has historically acted as a "floor," and buyers are stepping in once again to defend this level.
Descending Trendline Resistance: We are seeing a clear descending triangle/trendline (the blue diagonal line) that has been capping the upside since the March highs. A decisive breakout above this line is necessary to confirm a trend reversal.
The Safe Haven Factor: With Crude Oil prices plummeting recently, inflationary fears are shifting into recessionary concerns. Historically, when energy markets weaken and geopolitical uncertainty rises, investors flock to Gold as the ultimate Safe Haven investment.
Volume Profile: Observe the volume bars at the bottom—there is a slight uptick in green volume as we hit the support zone, suggesting "smart money" accumulation at these lower levels.
Outlook: If Gold holds the current support and breaks the descending trendline, we could see a rapid move toward the 160,000 – 164,000 psychological levels. Conversely, a daily close below 144,000 would invalidate this bullish setup.
*For Educational Purpose Only Long 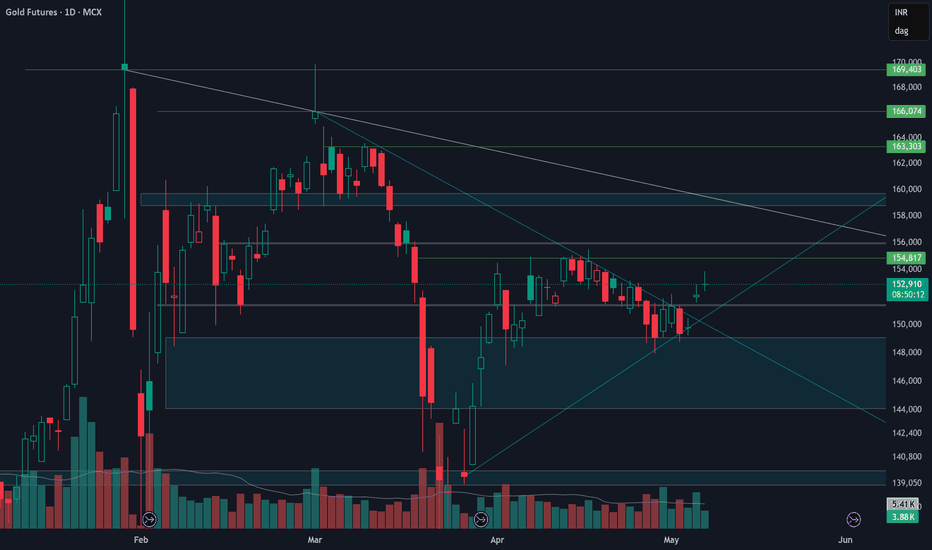
 Long
Long
Short 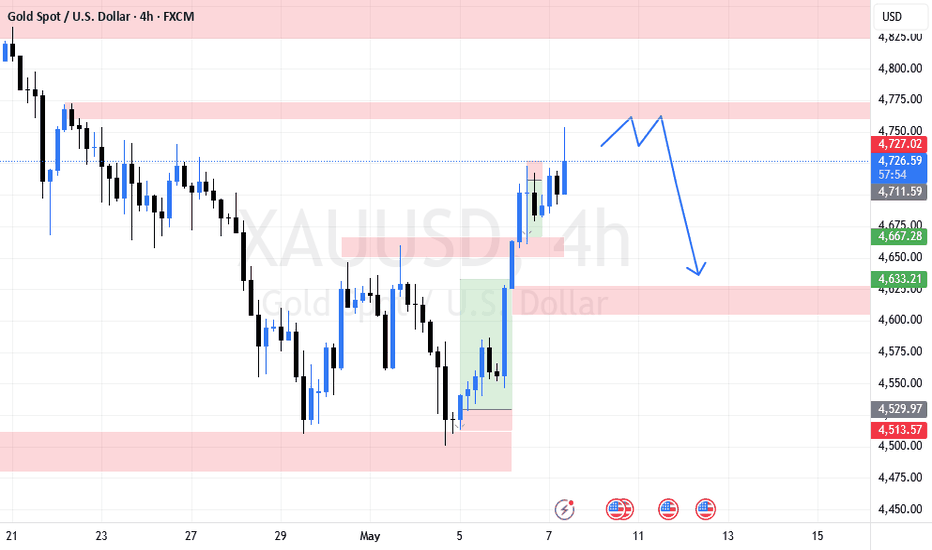
 Long
Long
 Long
Long
Education

 Education