XAUUSD – Gold Tests Major Demand, Sellers Still Pressing XAUUSD – Gold Tests Major Demand, Sellers Still Pressing
Gold is trading around 4,263 after facing renewed selling pressure from the upper reaction zone.
The chart shows that gold failed to hold above the 4,302 – 4,325 structure and continued moving lower toward the major demand area. This tells me that buyers are still weak in the short term, while sellers continue to control each recovery attempt from higher levels.
The market is also moving carefully because traders are waiting for the exp
Fundamental Analysis
BRIAN XAUUSD – GOLD BREAKS LOWER VALUE, SELLERS STILL IN CONTROLBRIAN XAUUSD – GOLD BREAKS LOWER VALUE, SELLERS STILL IN CONTROL
Gold is turning lower again after failing to build a clean recovery above the 4,350 area.
The market is still moving inside this week’s range, but the short-term structure is getting weaker. The US Dollar remains firm near a two-month high as hawkish Fed expectations continue to offset the positive impact from diplomacy hopes. At the same time, daily technical signals are still mixed, with RSI staying neutral.
This means gold is
XAUUSD — 4260 Decides the Next Sweep XAUUSD — 4260 Decides the Next Sweep
Gold is sitting in a dangerous spot.
Price is trading near 4,282, close to the one-week low, and the recovery still looks weak. Buyers tried to defend the lower area, but every bounce is still getting capped under the short-term bearish structure.
This is not clean bullish yet.
The chart shows one important thing: gold is still moving below the bearish channel pressure, and the last rejection from the LTF Supply / FVG around 4,350 - 4,365 confirms that se
XAUUSD — 4434 Trap or 4295 Sweep? XAUUSD — 4434 Trap or 4295 Sweep?
Gold is still stuck in the danger zone.
Price is holding around 4,350, but the bounce is not clean yet. Every recovery attempt is still trading under the descending trendline, and sellers are waiting above. That tells me buyers have not taken full control.
Macro is also not helping gold much. USD is trying to stay firm, oil is recovering, and the daily RSI is still neutral. So this market can still move both ways before choosing the real direction.
Right now
BRIAN XAUUSD – GOLD UNDER SELLER PRESSURE BELOW 4,366 BRIAN XAUUSD – GOLD UNDER SELLER PRESSURE BELOW 4,366
Gold is still struggling to build a clean recovery around the 4,350 area.
The short-term picture remains heavy because every rebound is meeting selling pressure at higher value zones. Even though US Treasury yields are easing and the US dollar is under some pressure, gold has not managed to turn that support into a strong bullish breakout.
The reason is clear: the Fed’s hawkish stance is still limiting upside confidence, while traders are
Nifty Has Repeating Seasonal Patterns Most Traders Never ChartNifty Has Repeating Seasonal Patterns Most Traders Never Bother to Chart.
Markets are driven by fundamentals and flows — but certain calendar patterns have repeated often enough across cycles that ignoring them completely means ignoring real historical data.
Seasonality studies how an index has historically performed during specific calendar periods — months, festive periods, or around specific recurring events — across many past years, looking for statistically meaningful tendencies rather
XAUUSD – Gold Still Trapped Inside Downtrend Channel XAUUSD – Gold Still Trapped Inside Downtrend Channel
Gold is trading around 4,316 after struggling to hold above the short-term recovery area. The market is still moving inside a wide descending channel, which means every recovery attempt is still facing selling pressure from higher levels.
The chart shows that gold has not created a clean bullish breakout yet. Price is moving below the upper channel line, while the short-term structure is still compressed inside lower highs and lower reaction
SONA BLW PRECISION FORGINGS — BREAKOUT ON WATCHSona BLW Precision Forgings looks tempting here.
The stock is approaching a major resistance zone around ₹840, and a sustained breakout above this level could also mean a breakout into fresh all-time-high territory.
The green lines mark the important support levels, while the orange line around ₹840 is the key level I am watching.
My approach would be simple:
Weekly closing above ₹840 → breakout confirmation → look for continuation and manage the trade from there.
If the breakout happens
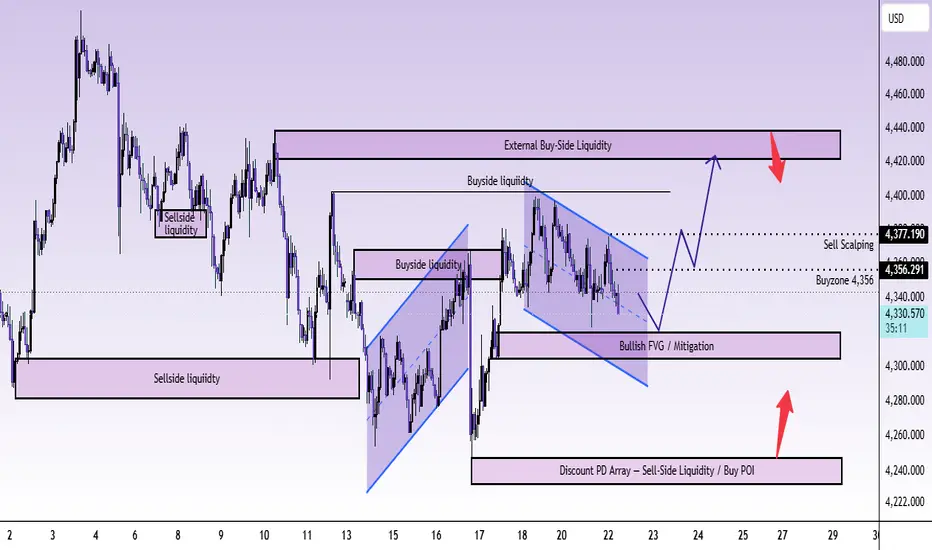
XAUUSD — 4356 Is the First Trap XAUUSD — 4356 Is the First Trap
Gold is still not free.
Price slipped back under 4,350 after the Asian session bounce, and the reason makes sense. A hawkish Fed outlook is still pressuring gold, because higher-rate expectations usually support USD and make non-yielding assets less attractive.
But the chart is not showing a clean breakdown yet.
Gold is moving inside a short bearish correction channel, but price is now approaching a key reaction area: the Bullish FVG / Mitigation zone around 4
XAUUSD — 4,414 Is the Trap Zone XAUUSD — 4,414 Is the Trap Zone
Gold is still moving inside a clear bearish flow, and for me the chart is not showing a clean bullish reversal yet.
After the strong drop earlier this month, price has been building lower reactions inside a descending channel. Every time buyers try to push higher, the move slows down near the upper side of the structure. That tells me gold is still trading like a market under pressure, not like a market ready to run freely.
Right now, price is sitting around 4,
4,300 HOLDS — BULLS BACK OR JUST A BOUNCE?Gold bounced from 4,290 → 4,370, then pulled back to 4,330.
For now, 4,300–4,400 remains the key range.
🔹 Above 4,370–4,380 → watch 4,400
🔻 Rejection → 4,330 → 4,300
⚠️ Break 4,300 → 4,250 → 4,200
Bias: Range / Neutral
Strategy: Trade the range, wait for confirmation at key levels.
The bigger move may need a catalyst, with geopolitical developments and the U.S.–China meeting in focus.
4,300 is holding. Now we wait to see who wins the fight.
XAUUSD – Gold Still Waiting for a Real Breakout XAUUSD – Gold Still Waiting for a Real Breakout
Gold is trading around 4,304 after failing to build a strong continuation from the recent recovery attempt.
The chart shows that gold is still moving inside a corrective structure. Price tried to recover from the lower area, but the move was rejected before reaching the stronger resistance zones. This tells me that buyers are active, but they are not strong enough yet to fully shift the market back into a clean bullish structure.
From the market
XAUUSD: Sellers Still Control Below 4,365 XAUUSD: Sellers Still Control Below 4,365
Market Context
Gold attracted fresh selling after a mild recovery attempt during the Asian session, slipping back below 4,350.
The main pressure still comes from the market pricing a tighter Fed policy outlook, which is not supportive for non-yielding assets like gold. However, the downside is not fully open yet because price is still trading above the major demand area on the chart.
So the story is simple: gold remains bearish inside the channel, bu
BRIAN XAUUSD – GOLD TESTS LOWER VALUE BRIAN XAUUSD – GOLD TESTS LOWER VALUE
Gold is losing short-term momentum after failing to hold above the 4,350 - 4,360 POC area.
The market tried to recover, but the upside move was capped quickly as the Fed’s hawkish stance continues to limit bullish follow-through. Even though US Treasury yields are easing and the US dollar is under pressure, gold has not been able to build a clean breakout structure yet.
That tells me one thing: buyers are not fully in control.
At the same time, traders a
The Market’s Center of GravityWhy Price Keeps Returning to Certain Areas Before Choosing Its Next Direction
A market can move hundreds of points in one direction, yet somehow find its way back toward the same price area again and again.
At first, this looks strange.
If buyers have taken control, why doesn't price simply continue higher? Why does it repeatedly come back toward an old trading area before making another move?
One useful way to understand this behavior is through the concept of equilibrium.
Markets constan
XAUUSD — 4,320 Is the Reaction Zone XAUUSD — 4,320 Is the Reaction Zone
Gold is moving in a very interesting area right now. Price is trading around 4,336, but the chart does not show a clean breakout yet. It looks more like gold is slowing down, waiting for a deeper reaction before choosing the next direction.
From the SMC view, the recent structure is not fully bearish anymore. We already saw price create a CHoCH, then push into a short-term BOS area near 4,380 - 4,400. That means buyers have shown some strength. But after tha
XAUUSD — 4510 Is Where It Gets Dirty XAUUSD — 4510 Is Where It Gets Dirty
Gold bounced.
But this is not clean bullish control yet.
Price reacted from the lower area around 4,235 - 4,280, then pushed back above 4,350. Nice recovery, yeah. But look at where price is now.
Right in the middle.
Around 4,378, gold is still trading inside the bearish correction channel. That means I don’t want to chase buys here. This is exactly where late traders usually get trapped thinking the reversal is confirmed.
The real test is higher.
4,422
Ascending Triangle Forming: Ready For Breakout?Yellow Rectangles Represent Supply/Demand Conversion zones on the Chart.
Tightening price action: Consolidation nearing a crucial decision point.
Squeeze play: Waiting for the breakout from the contracting pattern.
Key levels: Watching the reaction within the current supply and demand zones.
Disclaimer:
This Post is Purely Educational, It is Not a Forecast or a Trading Recommendation.
XAUUSD – Gold Holds Deep Support, 4,488 Is the Weekly Key XAUUSD – Gold Holds Deep Support, 4,488 Is the Weekly Key
Gold is starting the new week in a very important reaction zone.
Price is trading around 4,354 after recovering from the deep Fibonacci support area near 4,270 – 4,300. The chart shows that sellers pushed gold down aggressively earlier, but the downside move has started to lose strength around the lower support base. This reaction suggests that buyers are still defending the deeper structure, but the recovery has not fully confirmed yet
XAUUSD – Bearish Structure Broken, But 4,447 Is Key XAUUSD – Bearish Structure Broken, But 4,447 Is Key
Gold is starting to show a more constructive recovery after breaking the short-term bearish market structure.
Price is trading around 4,378 after reacting strongly from the lower support area near 4,240 – 4,260. The chart shows that the previous bearish trendline has been violated, and price is now holding above the buy order zone around 4,349. This is an important change because sellers no longer have the same clean control they had during t
XAUUSD: 4,400 Is the Line Buyers Must Break XAUUSD: 4,400 Is the Line Buyers Must Break
Market Context
Gold starts the new week in a tight decision zone, and this is not a clean market to chase.
Geopolitical risk is back in focus after fresh Russia-Ukraine tension, which can support safe-haven demand. But at the same time, the US Dollar is also benefiting from defensive flows. That creates a mixed setup for gold.
So the question this week is simple: can buyers protect 4,340 - 4,355 and break through 4,400, or will sellers use this zon
XAUUSD 4360 trapped — 4250 or 4500 first? XAUUSD 4360 trapped — 4250 or 4500 first?
Gold ended the recent recovery right at the 4,400 area.
That rejection matters.
The bounce from the six-week low was strong enough to show buyers are not dead, but not strong enough to confirm full bullish control. Price is now stuck around 4,360, sitting under the LTF Bearish OB and still below the larger Premium PD Array.
This is the kind of zone where gold can trap both sides.
Buyers see recovery.
Sellers see rejection.
The chart says: wait for c
XAUUSD — 4,300 Is the Weekly Magnet XAUUSD — 4,300 Is the Weekly Magnet
Gold is starting the new week in a tricky position. Price ended last week with a small recovery after three straight weeks of pressure, but the chart still does not look fully clean for buyers yet.
The main reason is structure. Gold has been moving inside a wider corrective environment, with repeated CHoCH and BOS signals showing both sides fighting for control. The latest recovery pushed price back toward the 4,360 area, but it is now slowing around short-t
Ascending Triangle Breakout Underway: Retesting Support Levels!Using the Low of March 2023 (13.86) and High of Oct 2025 (182.75), The Fibonacci zone has been Shown on Charts.
The Yellow Rectangle Represent the Supply/Demand Conversion Zone.
A surge in the Volume can be Observed in the past few months.
Retracement from Golden zone (50%-61.8%) can be seen.
Is MANAKCOAT ready to Break is ATH?
Disclaimer:
This Post is Purely Educational, It is Not a Forecast Or a Trading Recommendation.