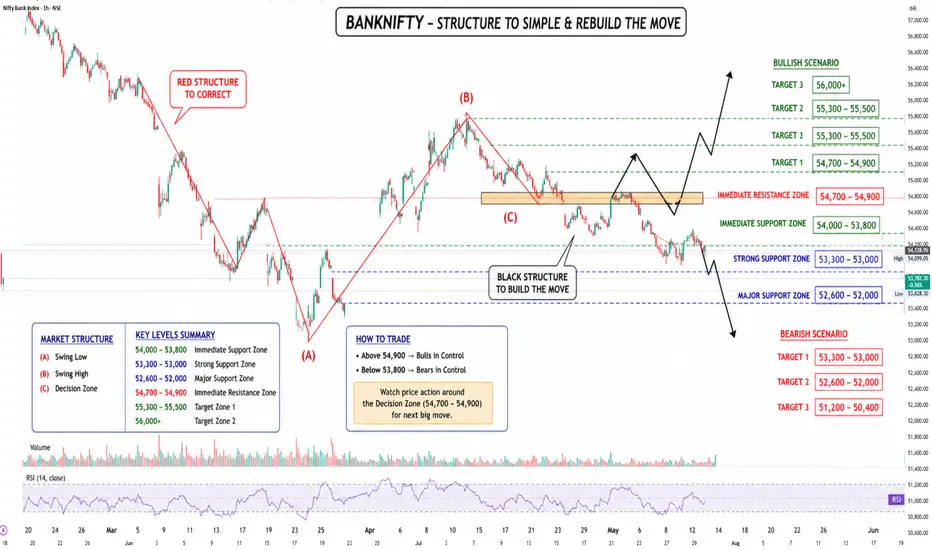
Important BANKNIFTY LevelsImmediate Support
54,000 – 53,800
Buyers are actively defending this area.
Strong Support Zone
53,300 – 53,000
A major breakdown zone.
If price falls below this area, selling pressure may increase sharply.
Immediate Resistance
54,700 – 54,900
Multiple rejections have happened here.
A breakout above this zone can trigger strong upside momentum.
Breakout Targets
55,300 – 55,500
Bigger Swing Target
56,000+
Trading Scenarios
Bullish Scenario
If:
BANKNIFTY holds above 54,000
and breaks above 54,900 with strong volume
Then possible upside targets are:
55,300
55,500
56,000
Bearish Scenario
If:
BANKNIFTY breaks below 53,800
Then downside levels could be:
53,300
53,000
Trend View
Short-term trend: Sideways to bullish
Private banks and PSU banks are showing mixed strength
Major stocks like HDFC Bank and ICICI Bank heavily influence BANKNIFTY movement  Education

 Short
Short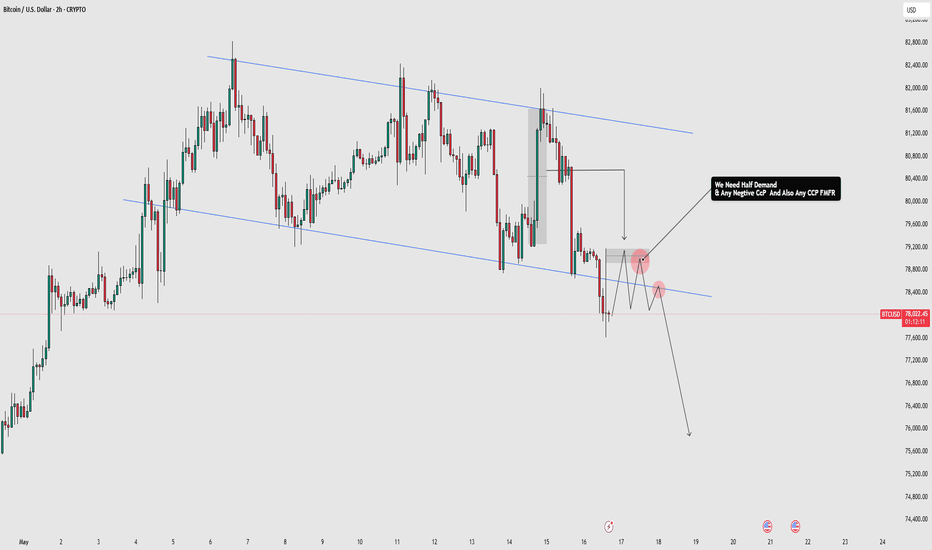
Nifty AnalysisWhere is Nifty right now?
Nifty closed at 23,689 on Thursday May 14. After a brutal fall earlier this week (it touched ~23,300), it bounced back for 2 days in a row. So right now it's in a recovery mood — but it hasn't really "fixed" itself yet. Think of it like someone who had a fever, now feeling slightly better, but not fully healthy.
2 What's the wall above? (Resistance)
If Nifty tries to go up next week, it will hit a wall around 23,500–23,600 first. That's the first test. If it somehow crosses that, the BIGGER wall is at 23,900–24,000 — where all the major moving averages (50-day & 200-day) are sitting. Lots of sellers will be waiting there to book profits. So going above 24,000 next week? Unlikely unless something very positive happens.
3 What's the floor below? (Support)
If Nifty starts falling, the first safety net is around 23,300–23,150. This zone has held multiple times recently. If it breaks this level decisively (and stays below it), then the next stop could be 23,000 or even 22,900. That's the danger zone — but that's not the most likely scenario for next week.
4 What's working in Nifty's favour?
Good news that could push it up:
• Govt is reportedly planning to cut bond taxes for foreign investors — this could bring big money into India
• US-China trade tension eased a bit after the Trump-Xi summit
• Foreign investors (FIIs) started buying again in late April after months of selling
• Big companies like HDFC, ICICI, Reliance posted solid quarterly results

Banknifty and Nifty AnalysisBank Nifty — Week May 19 to May 23, 2026
Current Position
Last close around 54,129
Weekly close was 55,310 with a gain of 447 points
But today pulled back, sitting near lower levels
Trend
Short term trend is negative
Weekly chart showing lower lows and lower highs
Both 20-day and 50-day EMA breached on the downside
Support Levels
First support at 54,200 to 54,600
Second support at 54,000
If 54,000 breaks, next target on downside is 53,000
Resistance Levels
First resistance at 54,609 on closing basis
Second resistance at 56,000 to 56,400
Major supply zone at 56,800

Technical AnalysisCore of Technical Analysis
Technical Analysis is the study of past price movements, volume, and market trends to predict future price direction.
3 Main Principles:
Market Discounts Everything
All news, emotions, and fundamentals are already reflected in price.
Prices Move in Trends
Markets usually move in uptrend, downtrend, or sideways trends.
History Repeats Itself
Human psychology creates repeating chart patterns.
Key Tools:
Charts (Candlestick, Line, Bar)
Support & Resistance
Trendlines
Indicators (RSI, MACD, Moving Averages)
Volume Analysis
Patterns (Head & Shoulders, Double Top, Triangle)
Goal:
Find good entry, exit, and risk management points for trading.
 Education

 Education

Long 
 Long
Long
Long 
Institutional Trading MasterclassInstitutional trading means trading like hedge funds, banks, prop firms, and professional desks. They do not trade based on emotions, random tips, or gambling. They use systems, probabilities, risk control, position sizing, discipline, and psychology.
Retail traders often lose because they focus only on “entry.” Institutions focus on:
Risk Management
Capital Protection
Position Sizing
Probability
Psychology
Consistency
Repeatable Edge
In options trading, if you think like institutions, your results can improve significantly.  Education

 Long
Long
Bitcoin chart analysis May 12Hello
It's a Bitcoin Guide.
My analysis is optimized for TradingView.
If you press the Replay button, you can check real-time movements.
This is the Bitcoin 30-minute chart.
The CPI indicator will be released shortly at 9:30.
The MACD Dead Cross on the daily chart, which I explained yesterday, is becoming established.
A correction is also underway on the Nasdaq.
Based on the Gap 10 at the bottom, I made my move around the 6+12 zone.
*Long Position Strategy (Following the red finger movement path)
1) $79,763.4 Long Position Entry Zone / Stop Loss if Green Support Line is broken
2) $81,184.8 Long Position Target Price -> Target prices in the order of Top, Good after tomorrow
If the strategy is successful, you may use $80.7K after tomorrow as a re-entry zone for the long position.
However, please be cautious, as a break below the green support line could lead to a Bottom -> a drop up to Zone 1.
Please use my analysis merely as a reference and for practical purposes.
I hope you operate safely by strictly adhering to trading principles and implementing stop-loss orders.
Thank you. Long 
BTCUSD FMFR Setup Inside Parallel ChannelThe market is currently trading inside a parallel channel structure, and price action is showing weakening demand over time. Buyers are gradually losing momentum, while supply is entering the market more aggressively and with stronger reactions.
At the moment, the overall structure remains range-bound inside the channel.
The market recently broke the previous high, and on the 1H timeframe a negative candle has already appeared. However, that candle is still considered an inside candle, and inside candlestick patterns often fail without a proper breakout confirmation.
For now, the real move will likely begin only after price breaks outside of this range structure.
My main focus is on an FMFR setup — First Move Fake Than Reversal. Ideally, I want to see the market first create a fake move toward the upside, trap breakout buyers, and then form a strong negative candle inside the marked reversal zone. If that confirmation appears, the market could start moving toward the downside.
Another important point is the current bearish candle inside the zone. If sellers want to maintain control, then the market needs to close below the body of that bearish candle on the 1H timeframe. Only then would the downside continuation become more reliable.
For now, price is still reacting inside the structure, and the next confirmed breakout will likely decide the true direction of the market. Short 
Global Financial MarketsGlobal financial markets are systems where people, companies, and governments buy and sell financial assets across the world. They help move money from those who have extra funds to those who need funds.
Main Types of Global Financial Markets:
Stock Markets – Buying and selling shares of companies (e.g., NYSE, NSE).
Bond Markets – Governments and companies borrow money by issuing bonds.
Foreign Exchange (Forex) Markets – Trading currencies like USD, EUR, INR.
Commodity Markets – Trading gold, oil, wheat, etc.
Money Markets – Short-term borrowing and lending.
Derivatives Markets – Contracts based on assets like stocks or currencies.
Importance:
Provide funds for business growth
Support international trade
Create investment opportunities
Help manage financial risks
Affect global economies
Example:
If the US stock market falls sharply, markets in Asia and Europe may also be affected because markets are connected globally. Education

Core of Technical AnalysisCore of Technical Analysis
Technical Analysis is the study of past price movements, volume, and market trends to predict future price direction.
3 Main Principles:
Market Discounts Everything
All news, emotions, and fundamentals are already reflected in price.
Prices Move in Trends
Markets usually move in uptrend, downtrend, or sideways trends.
History Repeats Itself
Human psychology creates repeating chart patterns.
Key Tools:
Charts (Candlestick, Line, Bar)
Support & Resistance
Trendlines
Indicators (RSI, MACD, Moving Averages)
Volume Analysis
Patterns (Head & Shoulders, Double Top, Triangle)
Goal:
Find good entry, exit, and risk management points for trading.  Education

institutional Trading MasterclassInstitutional trading means trading like hedge funds, banks, prop firms, and professional desks. They do not trade based on emotions, random tips, or gambling. They use systems, probabilities, risk control, position sizing, discipline, and psychology.
Retail traders often lose because they focus only on “entry.” Institutions focus on:
Risk Management
Capital Protection
Position Sizing
Probability
Psychology
Consistency
Repeatable Edge
In options trading, if you think like institutions, your results can improve significantly. Education

Long 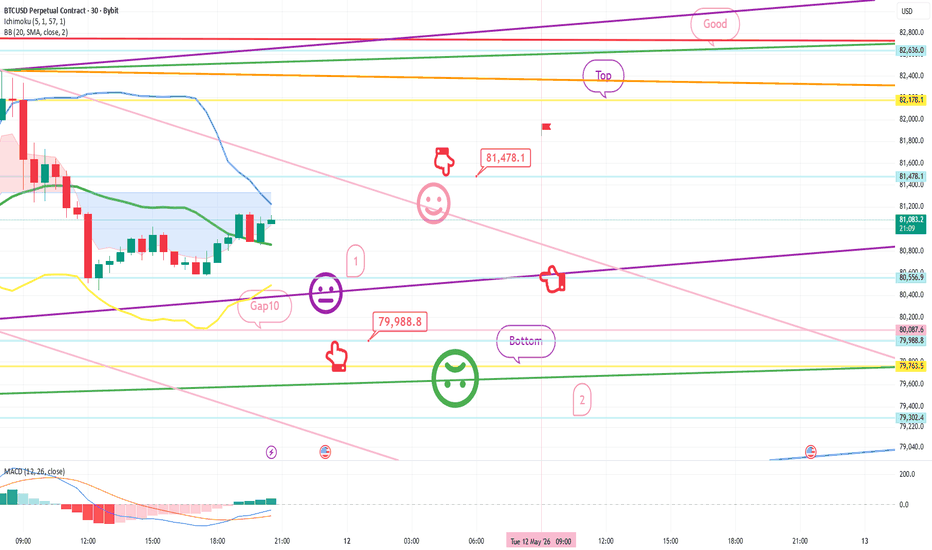
XAUUSD Reversal Zone Reaction | ROS Structure In PlayThe market recently broke the previous high, and after the breakout, a similar supply structure started repeating again. This is known as ROS — Repeating of Structure — a concept from the MMC methodology by Candle King, which I personally use in my analysis.
Right now, price is reacting inside an important reversal zone. If the market forms any strong positive confirmation here, such as a bullish engulfing candle or strong bullish reaction, then price could move toward the upper supply zone.
The reason for this expectation is the large amount of liquidity resting above the current market structure. In many cases, the market tends to move toward those liquidity areas before making the next major decision.
For now, the main focus is on waiting for a positive candle confirmation inside the reversal zone. If buyers step in strongly, the market may deliver a short-term upside move toward the upper marked area.
At the same time, there is also significant liquidity resting below the market. Because of that, price may still touch the zone and later move lower again, especially toward the previous bearish candle area.
Currently, the market is sitting at a decision point, and the reaction inside the reversal zone will likely decide the next short-term move.  Long
Long