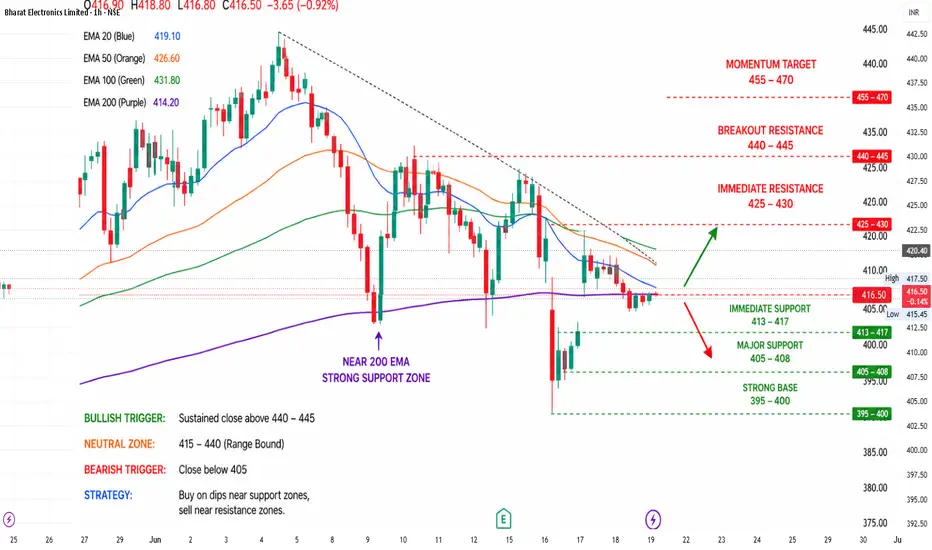
Bharat Electronics AnalysisFor Bharat Electronics Limited (NSE: BEL), the short-term structure looks sideways to mildly weak after recent profit booking post Q4. Price has slipped below several short-term moving averages, while long-term trend is still intact because it remains near the 200-DMA zone. Recent Q4 results were solid, but near-term momentum cooled.
Bullish trigger: Sustained close above ₹440–445 → can open move toward ₹460+. A prior breakout discussion also highlighted ~₹443 as a key level.
Neutral zone: ₹41
Gann
Larsen & Toubro (LT) AnalysisCMP Zone: ₹3,920–3,930
Stock is currently trading near an important demand zone after correction from ₹4,440 ATH. Short-term trend is sideways to mildly bullish if price sustains above ₹3,880.
Bullish Scenario
If LT closes above ₹4,000–4,020, momentum can expand toward:
₹4,120
₹4,250
₹4,440 ATH retest
Bearish Scenario
If price breaks ₹3,850 decisively:
downside may extend toward ₹3,750
then ₹3,650 demand zone
Swing Trading Plan
Buy Zone: ₹3,850–3,920
SL: Below ₹3,780
Targets: ₹4,020 / ₹4,12
State Bank of IndiaState Bank of India is currently in a corrective phase after a sharp post-results fall. The stock is trading around the ₹945–₹955 zone and technical indicators remain weak in the short term, though long-term structure is still intact.
Short-term trend: Bearish to sideways
Medium-term trend: Range-bound
Long-term trend: Still bullish above ₹900
Bullish Scenario
Sustained move above ₹973 can trigger upside toward:
₹1000
₹1025
₹1050
Bearish Scenario
If ₹930 breaks decisively, downside may extend
Oversold MarketsWhat is overbought?
When the market goes up too much, too fast — like it got overexcited. RSI crosses above 70. This means most people who wanted to buy have already bought. Not many buyers left. So the market will likely slow down or fall a bit.
What you do: don't buy now. If you're already in profit, book some of it. Keep your stop loss tight.
What is oversold?
When the market falls too much, too fast — like everyone panicked and sold everything. RSI drops below 30. Most of the panic sellin
Option AnalysisOptions Data
PCR at 0.90, slightly bearish reading
Max call pain sitting near 55,000, acting as a ceiling
What to Do
Short traders hold with stop-loss above 54,609 on daily close
Long trades only if index closes above 54,609
Avoid aggressive buying unless 56,400 is reclaimed with a proper closing
Key Risk
Crude oil above 100 dollars is a pressure point for India
Any global news on geopolitics can cause sudden sharp moves either way
Intrday AnalysisOption Chain Analysis: Decoding Open Interest (OI) to find where the "Big Players" are positioned.
FII/DII Data: Understanding institutional activity and its impact on market direction.
Intraday Strategies: Scalping and swing setups using Price Action and key EMAs.
Global Market Cues: How GIFT Nifty and US Markets might influence our opening.
Option TradingPCR means Put-Call Ratio
It compares how many Put options are traded versus Call options.
Simple formula: Put Volume ÷ Call Volume.
This helps understand market mood.
Institutions use options heavily
Big players like banks, hedge funds, mutual funds often use options for hedging and positioning.
So PCR can give clues about what smart money may be doing.
Shows fear vs confidence
High PCR = More puts than calls = Fear, protection, bearish mood.
Low PCR = More calls than puts = Confidence, bullish
Banknifty and Nifty AnalysisPCR means Put Call Ratio
It tells us how many Put options and Call options people are buying or trading.
Why it matters for institution trading
Big players mostly use options. So PCR helps us understand what big money may be thinking.
If PCR is high
More puts than calls.
Means traders are scared or taking protection.
Sometimes big players expect weakness.
If PCR is low
More calls than puts.
Means confidence in upside.
Sometimes market is bullish.
Why learn this
Price only shows movement.
PCR sho
Read Advanced Option ChainInstitutional Option Trading (6 Key Points):
Smart Money Activity – Institutions like banks, hedge funds, and FIIs trade options with large capital, creating strong directional moves in the market.
Option Chain Analysis – They focus on OI buildup, unwinding, and PCR to identify accumulation/distribution zones.
Liquidity Zones – Institutions trade where liquidity is high (ITM/ATM strikes), ensuring easy entry and exit without slippage.
Hedging Strategies – Use advanced strategies like spreads
Option Analysis With Education and Logic Part-1Core Structure of Institutional Option Trading
Institutions focus on 4 pillars:
A. Direction
Will market go up, down, sideways?
B. Volatility
Will movement increase or decrease?
C. Time Decay
How much premium melts daily?
D. Risk Exposure
How much capital at risk?
Rules to Become Consistent
Never trade without plan
Never increase size emotionally
Never revenge trade
Protect capital first
Focus on process daily
Take breaks after losses
Journal every trade
Stay physically healthy
Sleep p
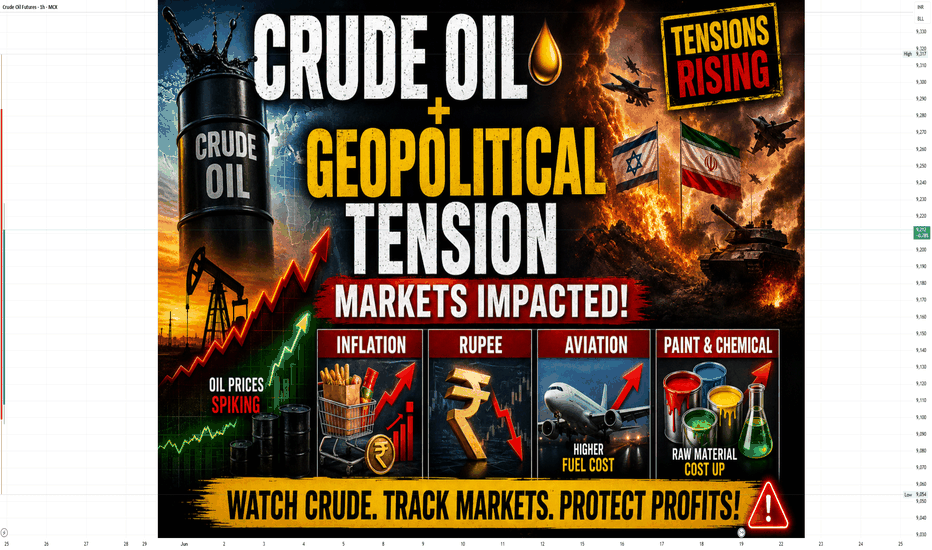
Crude Oil & Geopolitical Tension ReportIntroduction
Crude oil is one of the most important commodities in the global financial market. Any major geopolitical tension between countries can directly affect crude oil prices. Traders, investors, governments, and companies closely watch oil-producing regions because even a small disruption in supply can create strong volatility in global markets.
In recent years, geopolitical tensions have become one of the biggest reasons behind sudden movements in crude oil prices. Wars, sanctions, sh
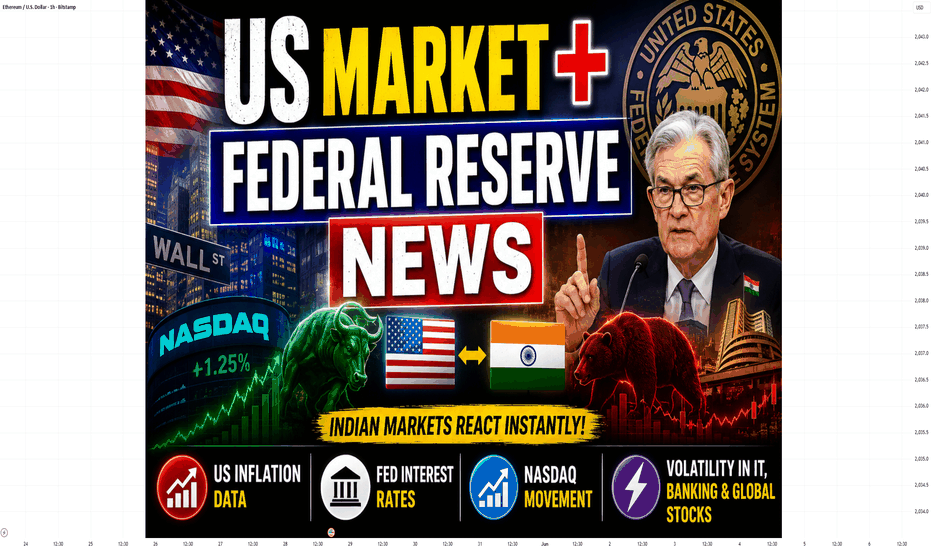
US Market & Federal Reserve News ReportIntroduction
The US stock market remains one of the biggest drivers of global financial markets. Every major movement in the American market directly impacts global indices, including Indian markets like Nifty and Bank Nifty. Along with corporate earnings and economic data, decisions from the US Federal Reserve play a major role in market direction.
Recently, investors have been closely watching inflation data, interest rate expectations, bond yields, and comments from Federal Reserve official
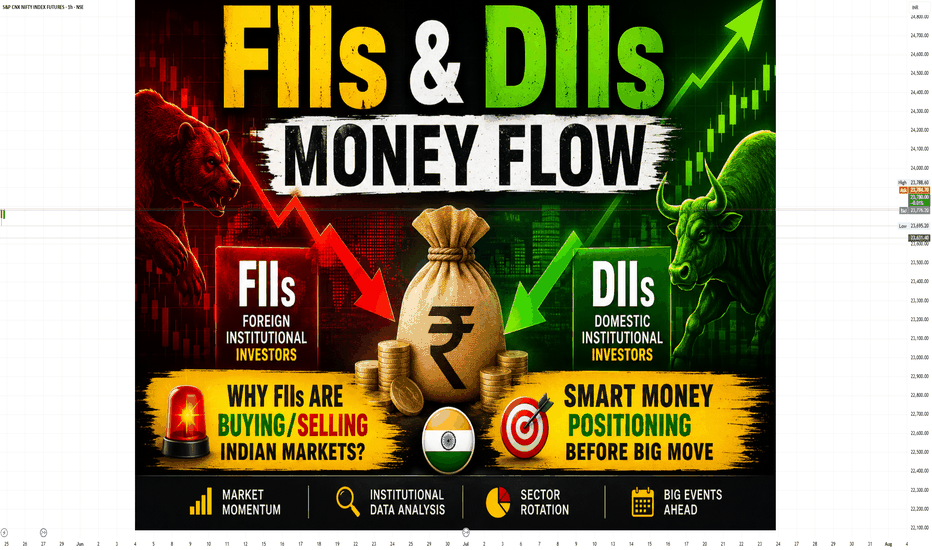
FIIs & DIIs Money Flow ReportIntroduction
FIIs (Foreign Institutional Investors) and DIIs (Domestic Institutional Investors) play a major role in the stock market. Their buying and selling activity directly impacts market direction, liquidity, and investor sentiment.
When FIIs invest heavily, markets usually gain strong momentum because foreign capital increases confidence and liquidity. On the other hand, when FIIs sell aggressively, markets often become volatile.
DIIs mainly include Indian mutual funds, insurance comp
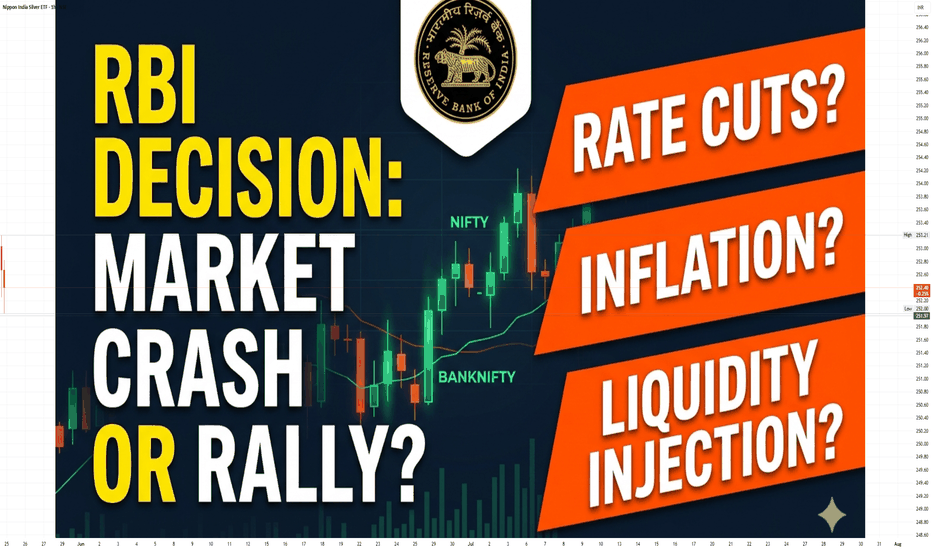
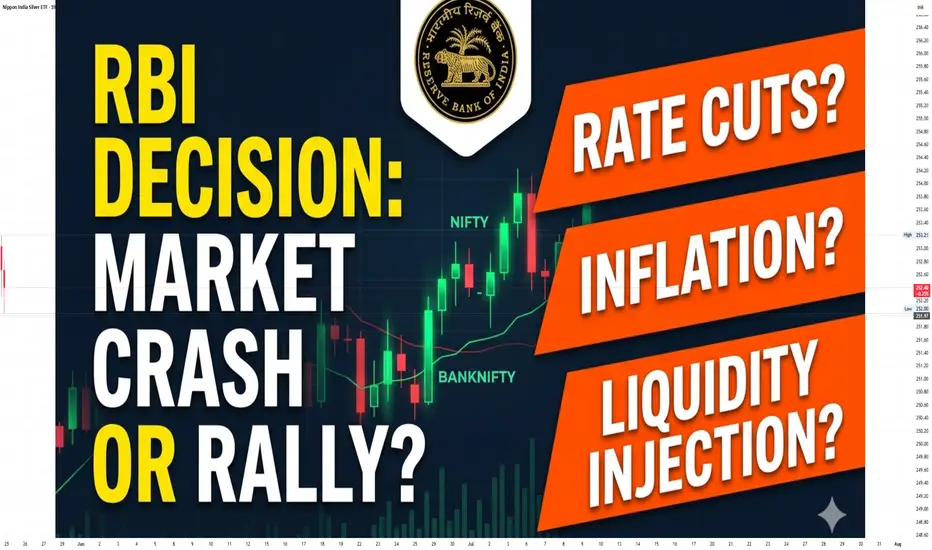
RBI Interest Rate & Liquidity DecisionsIntroduction
The Reserve Bank of India (RBI) plays a major role in controlling inflation, maintaining financial stability, and supporting economic growth in India. One of the most important responsibilities of the RBI is managing interest rates and liquidity in the banking system. These decisions directly impact the stock market, banking sector, businesses, loans, investments, and the overall economy.
This report explains RBI interest rate policies, liquidity management tools, market impact, a
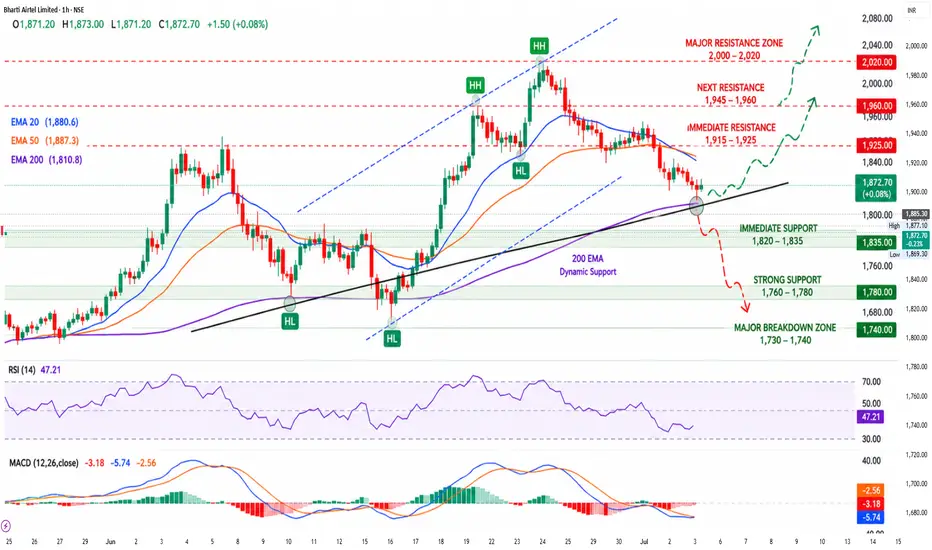
BHARTIARTL AnalysisCurrent bias: Neutral to mildly bullish above key support. The stock recently traded around ₹1,870–1,905 and has shown recovery after earnings, but resistance zones remain important.
Key Levels (watch closely):
Immediate Support: ₹1,820–1,835
Strong Support: ₹1,760–1,780
Major Breakdown Zone: ₹1,730–1,740 (below this, weakness can increase)
Immediate Resistance: ₹1,915–1,925
Next Resistance: ₹1,945–1,960
Major Resistance / Breakout Zone: ₹2,000–2,020
Trading setup idea (educational):
Bullish
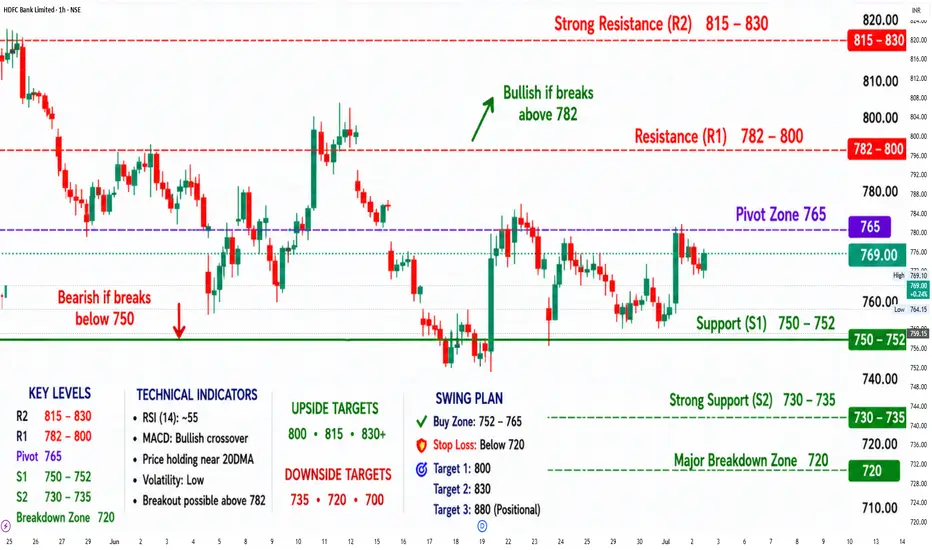
HDFC Bank AnalysisHDFC Bank Analysis
Current price zone is around ₹765–770 and stock is trying to form a short-term base after heavy correction from highs. Momentum is improving slowly, but stock still needs a strong breakout above resistance for fresh bullish strength.
Bullish Scenario
If stock sustains above ₹782, then upside targets can be:
₹800
₹815
₹830+
A strong Bank Nifty move can support this rally.
Bearish Scenario
If stock breaks below ₹750, then selling pressure may increase toward:
₹735
₹720
₹
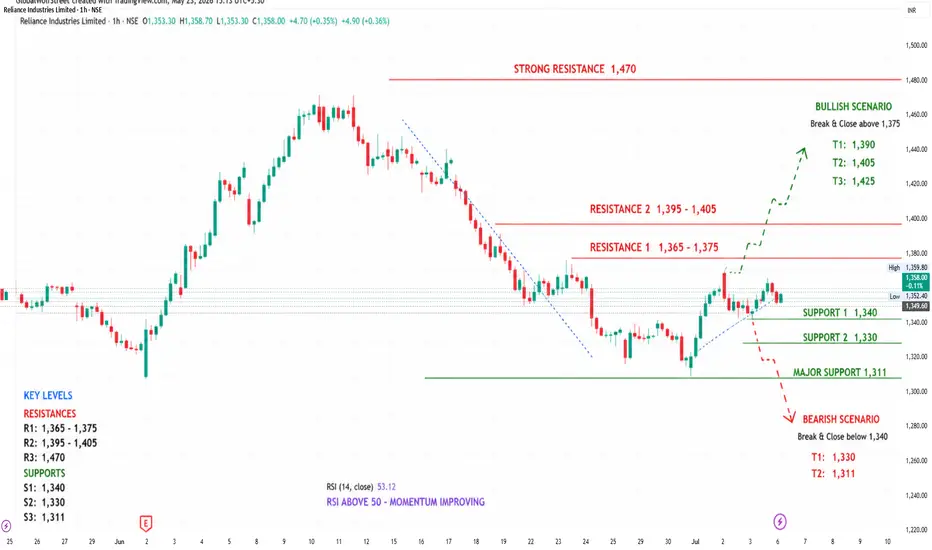
Reliance AnalysisImportant Levels
Support Zones
Strong support: ₹1330–1340
Next support: ₹1310–1300
Major positional support: ₹1270–1300 zone
Resistance Zones
Immediate resistance: ₹1365
Next resistance: ₹1380–1390
Swing resistance: ₹1470+
Reliance Industries, the key technical levels remain:
Support: ₹1330 → ₹1310 → ₹1290
Resistance: ₹1365 → ₹1390 → ₹1470
Current structure:
Above ₹1365 = bullish breakout possible
Below ₹1330 = weakness may continue
Positional inves
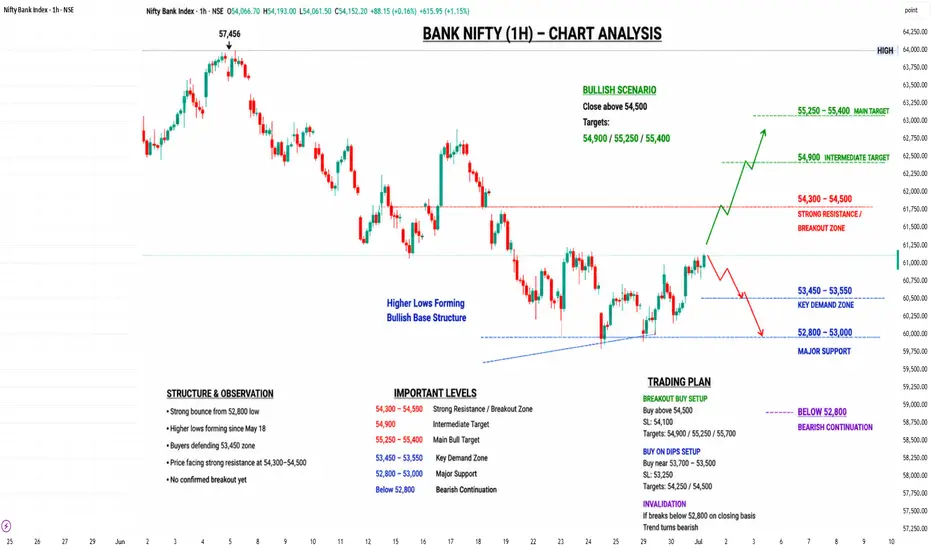
Bank Nifty AnalysisBank Nifty Analysis (Next Trading Session / Short-Term View)
Bank Nifty closed around 54,055 on 22 May and has reclaimed the important 54,000 psychological level, indicating that buyers are still active. However, the index is approaching a strong resistance zone between 54,300–54,500, where multiple analysts are expecting selling pressure. A decisive breakout above this zone can trigger a fresh upmove.
Bullish Scenario
Sustain above 54,300
Breakout above 54,500
Targets: 54,900 → 55,200 → 55,8
XAUUSD: Weekly Structure Remains Bearish◈ XAUUSD: Weekly Structure Remains Bearish
Gold spent most of this week trading under pressure, with each recovery attempt failing below the broader descending structure. From Kelly’s view, the current consolidation around 4,490–4,525 still looks more like a pause before continuation than a confirmed bullish reversal.
⟡ Market structure
Price rejected from the higher trendline area earlier in the week, then moved lower into the marked sell zone and sellside liquidity region. Buyers have tried
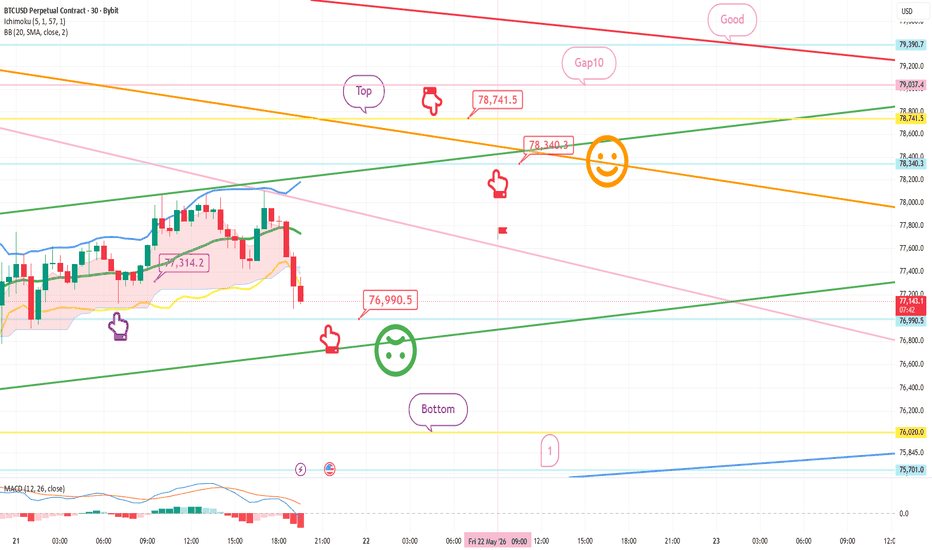
Bitcoin chart analysis May 21Hello
It's a Bitcoin Guide.
My analysis is optimized for TradingView.
If you press the Replay button, you can check real-time movements.
This is the Bitcoin 30-minute chart.
On the left is the entry point for the long position entered yesterday.
I have connected the strategy exactly as indicated by the purple finger at 77.3K.
*This is the long position strategy based on the movement path of the red finger.
1) $76,990.5 Long Position Entry Point / Stop Loss if broken by the green support
Intraday With Advance Option TradingIntraday option trading focuses on capturing short-term price movements within the same trading session. Advanced option trading combines price action, option chain analysis, Greeks, volatility, and institutional activity to improve trade accuracy and risk management.
1. Understanding Intraday Option Trading
In intraday trading:
Positions are opened and closed on the same day.
Traders mainly trade Index Options like:
NIFTY
BANKNIFTY
FINNIFTY
The goal is to capture momentum, breakout, reversa
Institutional Trading MasterclassCore Structure of Institutional Option Trading
Institutions focus on 4 pillars:
A. Direction
Will market go up, down, sideways?
B. Volatility
Will movement increase or decrease?
C. Time Decay
How much premium melts daily?
D. Risk Exposure
How much capital at risk?
Rules to Become Consistent
Never trade without plan
Never increase size emotionally
Never revenge trade
Protect capital first
Focus on process daily
Take breaks after losses
Journal every trade
Stay physically healthy
Sleep p