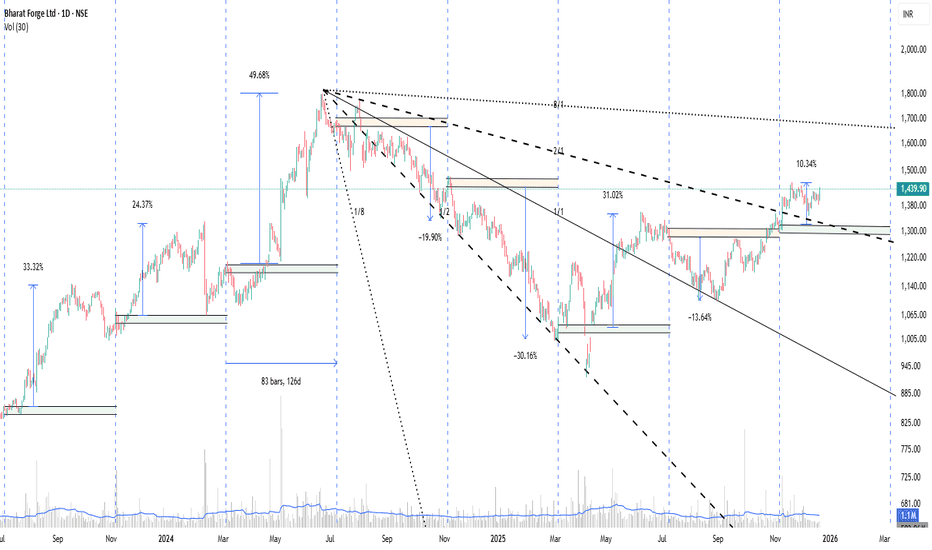
Production Linked Incentive (PLI) Scheme WinnersHow India’s Production Linked Incentive Is Creating Global Champions
India’s Production Linked Incentive (PLI) Scheme is one of the most ambitious industrial policy initiatives undertaken by the country in recent decades. Launched with the objective of boosting domestic manufacturing, reducing import dependence, and positioning India as a global production hub, the PLI scheme rewards companies with financial incentives tied directly to incremental production and sales. Since its rollout across
Gann
Mahindra & Mahindra Financial Services Limited (M&MFSL)Mahindra & Mahindra Financial Services Limited (MMFSL), a part of the Mahindra Group,is a NBFC primarily engaged in the business of financing purchase of new and pre-owned auto and utility vehicles, tractors, cars, commercial vehicles, construction equipment and SME Financing.
In the Indian stock market, there are approximately 288 non-banking financial companies (NBFCs) listed. Mahindra & Mahindra Financial Services Ltd. is among the top 10. Before the COVID-19 pandemic, the stock reached a hi
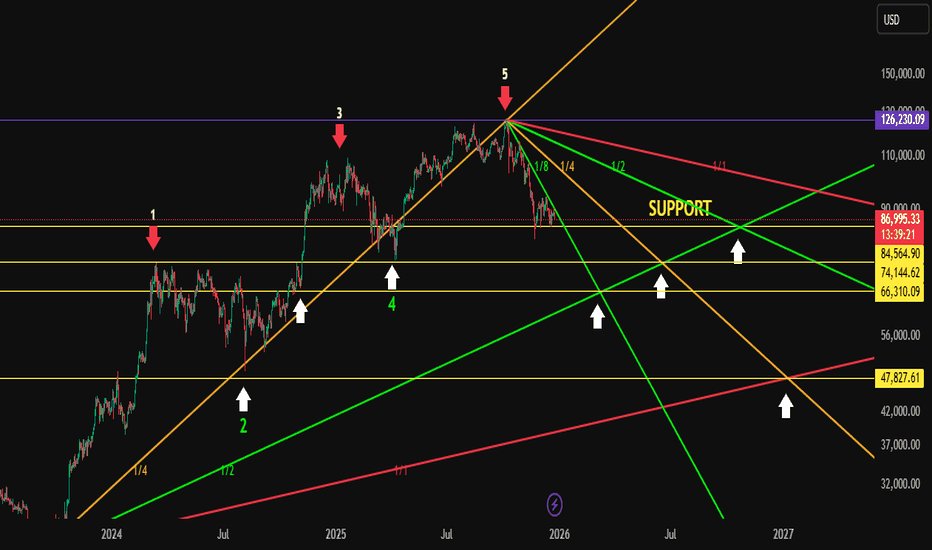
BTC DIFFERENT VIEW OF SUPPORT & RESISTANCEIn this chart and previous post there is diference what is that
In this chart i used only 3-4 lines to get S/R If youare going to analyse first of allyou should have to remember that there is not necessary that 1/1 line must be in 45 degree.Necessary is that both the fan must be in 90 degree exactly.
Here all the supports and resistances are in yellow horizontal line which is cross ponts of lines.It's an idea only to find S/R.
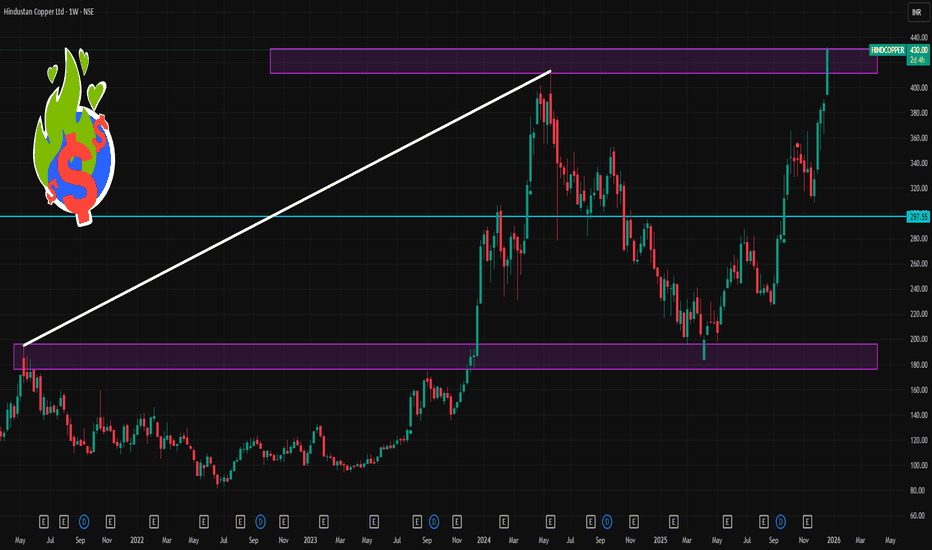
HINDCOPPER 1 Week Time Frame 📍 Current Price (Indicative)
The stock is trading around ₹400–₹430 levels recently — near 52‑week highs due to strong momentum.
📊 Weekly Timeframe Levels (1‑Week Outlook)
🔹 Key Weekly Resistances
1. Primary Resistance: ~₹415 – ₹422
— Immediate upside facing selling pressure.
2. Higher Resistance: ~₹428 – ₹432
— Near recent short‑term top and swing highs.
Bullish scenario: Sustained closes above ₹415 – ₹422 may prompt further gains toward ₹430+.
🔸 Key Weekly Supports
1. Immediate Support: ₹3
real reversal or a trap1. DXY Status: "Holding, Not Leading"
The U.S. Dollar Index is currently struggling near 97.87. While it has paused its sharp 10% decline for the year, it lacks the aggressive buying needed to mount a true recovery.
Key Resistance (The Ceiling): DXY faces heavy resistance between 98.82 and 99.01. Until the Dollar reclaims these levels, any bounce it makes is considered "corrective" and temporary.
Key Support (The Floor): The immediate floor is 98.03, with a deeper target at 97.50 if current ra
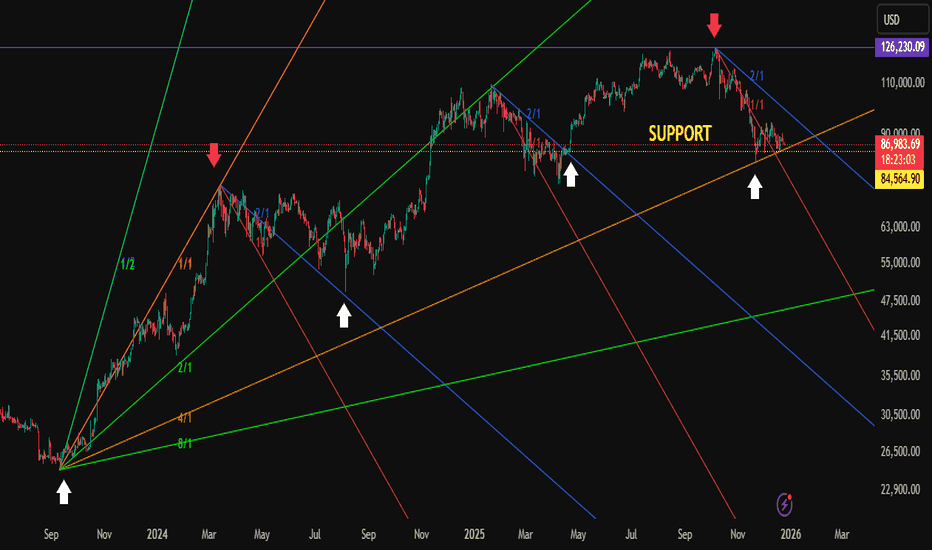
BTC LONG TERM ANALYSIS WITH GANN FANIf you see my chart there is all the reversal are shown here and you will see that gann fan angle wored beutifully.All gann line labled here as 1/1,1/2,1/4........and you can see here these fan line exihibited support and resistance. this gann fan is ploted as per scale. so nobody can deny it.
arrows are indicating reversal.Now BTC at its strong support and here it may accumullation/distribution is going on just waiting for the time to break up/down side. decision wil be yours what to do.
Blockchain and Tokenized AssetsRedefining Ownership, Finance, and the Global Economy
Blockchain technology and tokenized assets represent one of the most transformative shifts in the modern financial and economic landscape. What began as the underlying infrastructure for cryptocurrencies has evolved into a powerful system capable of redefining ownership, trust, and value exchange across industries. At its core, blockchain introduces a decentralized, transparent, and immutable ledger, while tokenization converts real-world an
Crypto Trading GuideA Complete Roadmap for Navigating the Digital Asset Markets
Cryptocurrency trading has evolved from a niche activity into a global financial phenomenon. What began with Bitcoin as an experiment in decentralized money has expanded into a vast ecosystem of digital assets, exchanges, trading strategies, and market participants. Today, crypto markets operate 24/7, attract traders from every corner of the world, and offer both immense opportunities and significant risks. This crypto trading guide is
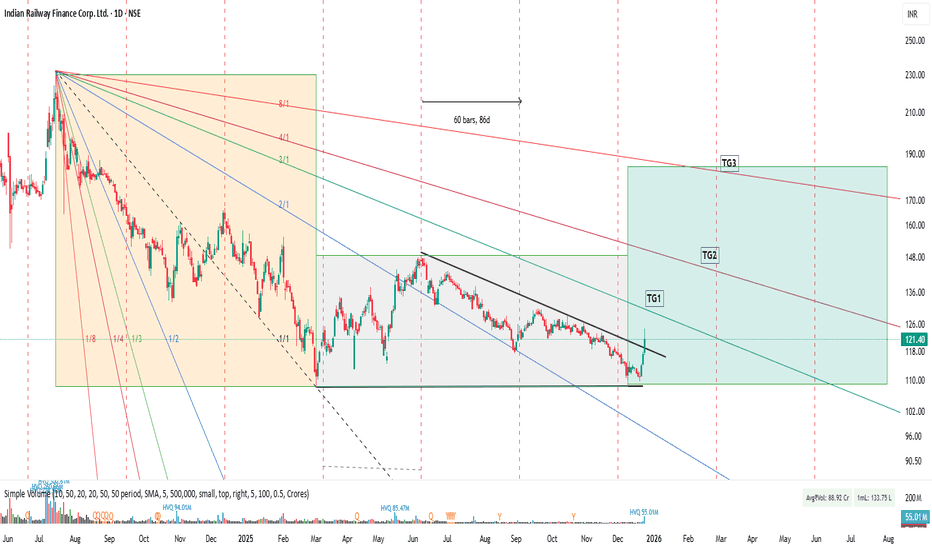
Indian Railway Finance Corporation Ltd. (IRFC)Time cycle trading is a very unique and powerful approach because it focuses on "time" rather than "price." It is based on the belief that market history repeats itself and trends reappear after certain intervals.
Its biggest advantage is that it can alert you before a trend even begins.
Most indicators (such as RSI or MACD) tell you whether the price will go up or down. But time cycles tell you when a change is likely to occur. Indicators are 'lagging' (they give signals after the price has
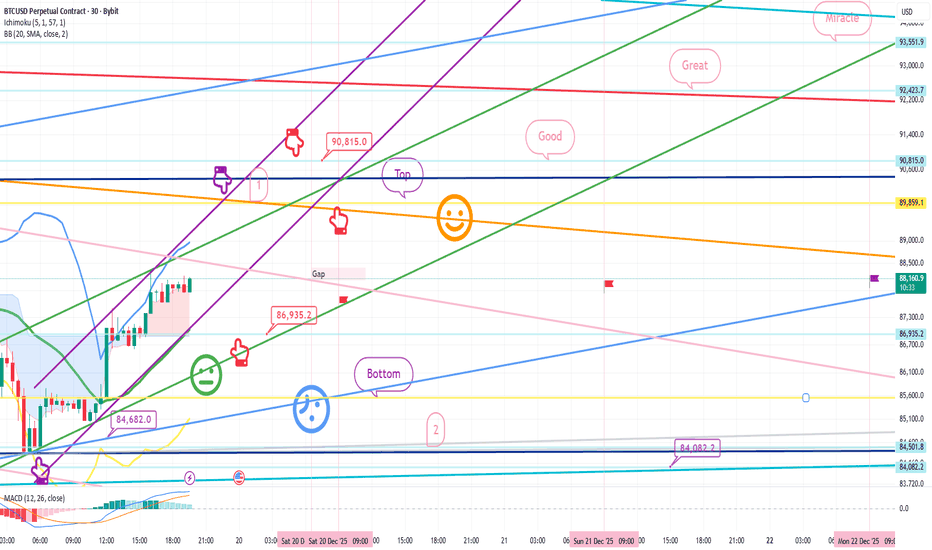
Bitcoin Bybit chart analysis December 19
Hello
It's a Bitcoin Guide.
If you "follow"
You can receive real-time movement paths and comment notifications on major sections.
If my analysis was helpful,
Please click the booster button at the bottom.
This is a Bitcoin 30-minute chart.
Shortly, at 10:30 AM and 12:00 PM, the Nasdaq indicators will be released.
At the bottom left, the purple finger indicates the strategy, which follows yesterday's final long position entry point of $84,682.
*If the red finger follows the path, it is a
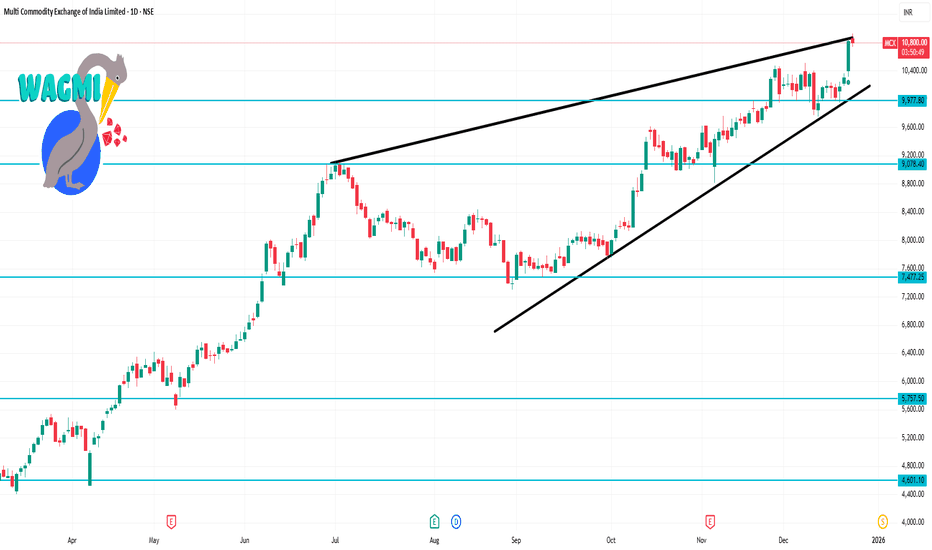
MCX 1 Day Time Frame 📌 MCX Latest Daily Price Snapshot
Approx. Last Traded Price: ~₹10,172 – ₹10,307 range (recent sessions)
Today’s Intraday Range: ~₹10,181 – ₹10,365 (approx)
52‑Week High: ~₹10,847 and 52‑Week Low ~₹4,408
📊 Daily Time‑Frame Levels (1D)
🔹 Pivot Point
Daily Pivot: ~₹10,386 – ₹10,442 zone (central reference)
🔸 Resistance Levels
R1: ~₹10,519 – ₹10,600
R2: ~₹10,596 – ₹10,650
R3: ~₹10,729 – ₹10,800
These levels act as potential upside barriers on daily closes. A sustained breakout above R1/R2 s
XAGUSD ANALYSISAs per my analysis we can see correction in both silver and gold and we can see a new last high in upcoming months as per this market can form now abc pattern as a corrective pattern it will takes time. as per my view high is formed of 3rd wave and now silver is in correction.
you can post your comment for more analysis
Thanks
Ishu Prajapati
XAUUSD ANALYSISI am posting a chart of XAUUSD this is the possible outcomes of the wave as per myview
3rd wave is completed and the current xauusd is in correction we can see abc correction on longterm as per trukit last wave now we can see trendline liquidity is need to be taken and in upcoming days we can see gold around 3820 from we can see 4-5wave as per my view.
Thanks
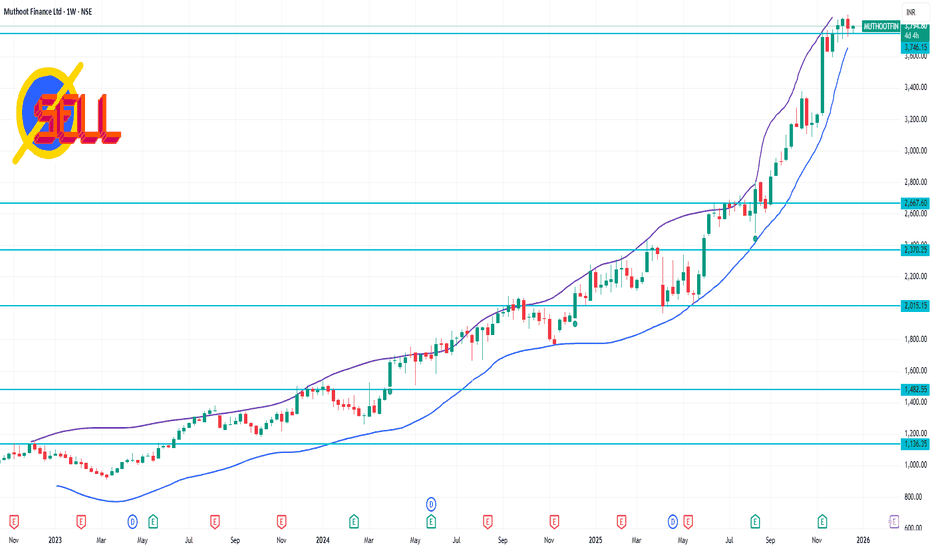
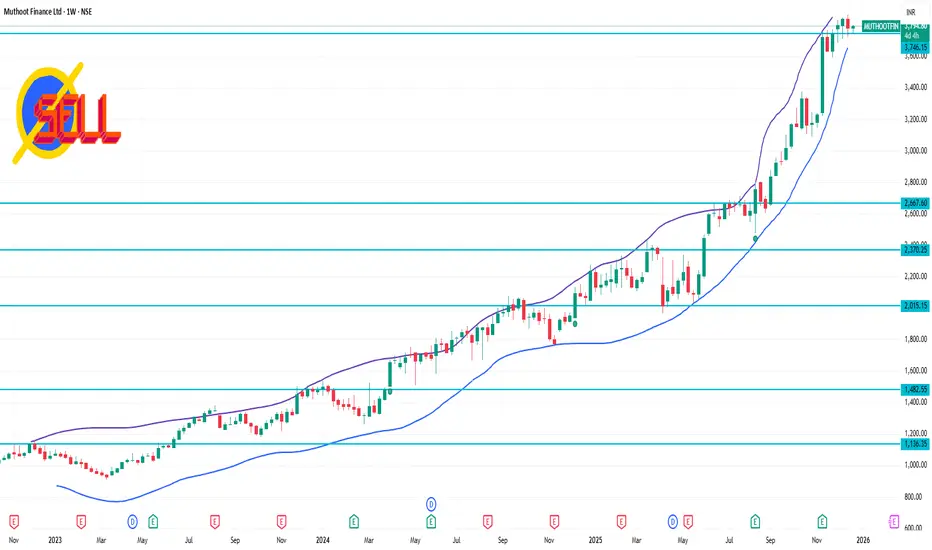
MUTHOOTFIN 1 Week Time Frame 📊 Current Price Context
Recent price is around ₹3,780–₹3,790 (mid‑Dec 2025) on NSE.
📈 Weekly Technical Levels (1‑Week TF)
📍 Major Resistance Levels
These are levels where the price may face selling pressure:
~₹3,805–3,810 — immediate resistance area.
~₹3,830–3,835 — next resistance / short‑term upside barrier.
~₹3,880–3,900 — stronger resistance zone (near recent highs).
📉 Support Levels
These are levels where the stock could find buying interest on a pullback:
~₹3,740–3,750 — short‑term
Momentum Trading SecretsHow Traders Capture Powerful Market Moves
Momentum trading is one of the most popular and effective trading styles in financial markets. It is based on a simple but powerful idea: stocks, indices, or other assets that are moving strongly in one direction tend to continue moving in that direction for some time. Momentum traders do not try to predict bottoms or tops; instead, they ride the strength of an existing trend and exit when momentum weakens. Below is a detailed explanation of momentum tr
The Rise of Retail Traders and the Power of Social MediaDemocratization of Market Access
The rise of retail traders is closely tied to the democratization of financial markets. Online brokerages, zero-commission trading, fractional shares, and user-friendly mobile apps have lowered the barriers to entry. What once required significant capital, professional connections, and complex infrastructure is now accessible to anyone with an internet connection. Retail investors can trade stocks, options, commodities, cryptocurrencies, and forex markets with e
BEducation
Time cycle trading is a very unique and powerful approachTime cycle trading is a very unique and powerful approach because it focuses on "time" rather than "price." It is based on the belief that market history repeats itself and trends reappear after certain intervals.
Its biggest advantage is that it can alert you before a trend even begins.
Here are some key features of time cycle trading:
TIME RULES
TIME is the most important factor in forecasting market movements. While SPACE and VOLUME are important and momentum is also a factor to be con
Part 2 Ride The Big MovesKey Components of Option Trading
Several important elements determine an option’s price and behavior:
Underlying Asset – The stock, index, or instrument on which the option is based.
Strike Price – The price at which the asset can be bought or sold.
Expiration Date – The date after which the option becomes worthless if not exercised.
Premium – The cost of buying the option.
Lot Size – The standardized quantity of the underlying asset per option contract.
Demat Account Secrets: The Hidden Mechanics That Smart Investors Use to Build Wealth
A Demat (Dematerialized) account is often introduced as a basic requirement for investing in stocks, mutual funds, ETFs, bonds, and other securities. Most investors see it as a simple storage place—an electronic locker that holds shares instead of physical certificates. However, behind this seemingly simple function lie several powerful “secrets” that experienced investors and traders quietly use to improve efficiency, reduce costs,
Small Account ChallengesNavigating the Market with Limited Capital
Trading or investing with a small account is one of the most demanding yet most common starting points for market participants. Whether in stocks, forex, commodities, or crypto, a small account magnifies every decision, emotion, and mistake. While the markets offer equal access to everyone, the reality is that account size significantly influences strategy, psychology, risk management, and growth potential. Understanding the challenges of a small accou
Liquidity Trading StrategiesUnderstanding How Smart Money Moves the Market
Liquidity trading strategies are built around one core idea: price moves toward liquidity. In financial markets, liquidity represents areas where large orders are resting—stop-losses, pending orders, breakout entries, and institutional positions. Unlike indicator-based trading, liquidity trading focuses on why price moves, not just how it moves. It attempts to align retail traders with the behavior of institutions, banks, and smart money participan
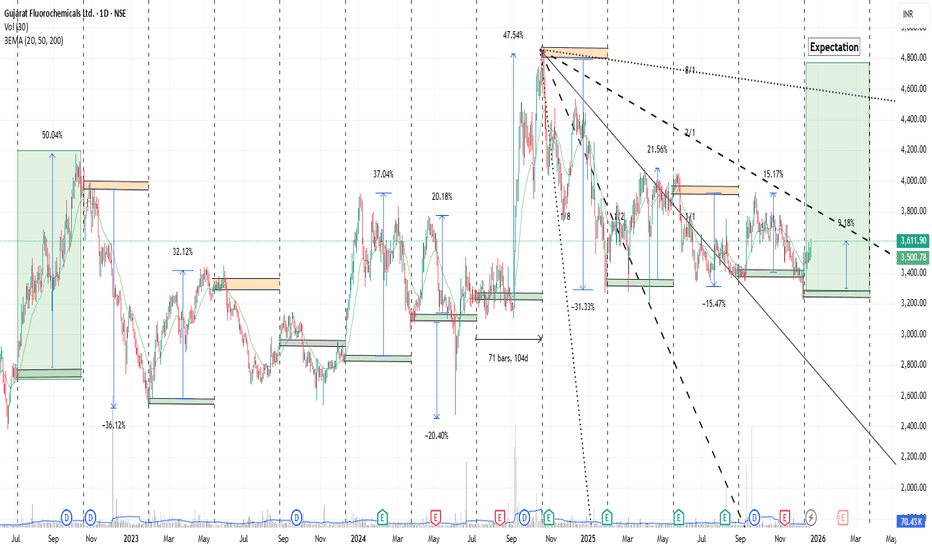
Simply trying to share a concept or idea for Swing TradeFriends, this is the chart of Gujarat Fluorochemicals Ltd. It is one of the leading producers of Fluoro-polymers, Fluoro-specialities, Chemicals and Refrigerants in India. It is one of the top five global players in the fluoropolymers market with exports to Europe, Americas, Japan and Asia.And is a part of the INOX Group of Companies
Gujarat Fluorochemicals Limited (NSE: FLUOROCHEM, BSE: 542812) is a constituent of several major indices. Primarily, it is included in the Nifty 500 and Nifty Mi
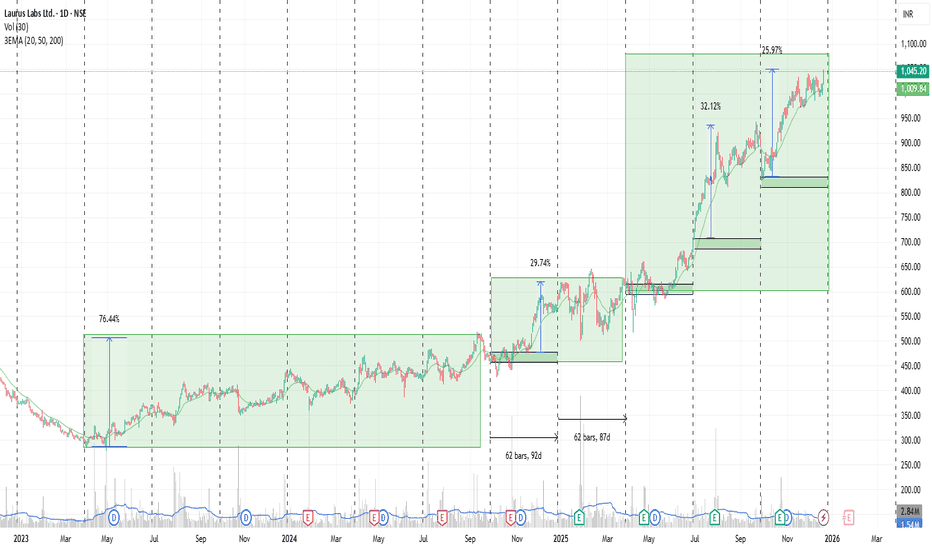
Every strategy has a dark side(LAURUSLABS)Friends, every strategy has a dark side, but when someone presents a subject, they try to hide that dark side. They think that people's interest will decrease. To some extent, that's true.
Although there is much to learn from the dark side, it also causes a lot of frustration.
Usually, the way to calculate a cycle is by taking a specific high to low, or low to high, to form a cycle. This means that at the end of each cycle, a trend reversal should occur, but this doesn't always happen.
When a
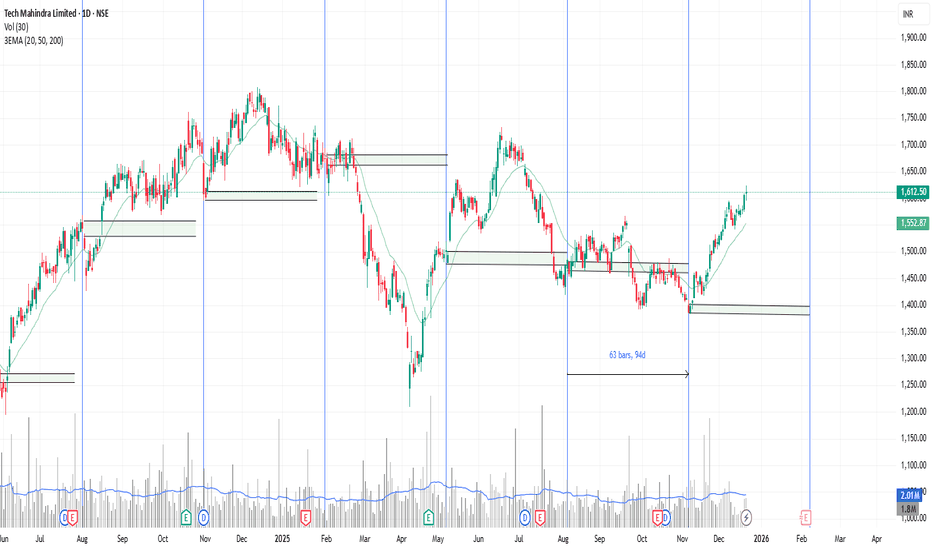
W.D.Gann Time Cycle in Indian Stock Market [Tech Mahindra Ltd.]Friends, let me tell you that W.D. Gann never traded in stocks; he preferred trading in commodities. This was because many of them were cyclical or seasonal, which made it a bit easier to understand their cycles, such as when demand would be high or low, etc.
If you've ever traded in commodities, you'll understand this well.
However, applying this cycle system to the Indian market is not very easy.
If you pay a little attention, you'll see that while the index has been showing movement for quit