Natural Gas: Buy Zone 210–222 | September Time CycleNatural Gas Futures – Weekly Analysis
Price is currently trading around 266.
I am watching the 210–222 zone as a potential buying area.
The setup is based on:
Weekly structure & historical support
61.8% Fibonacci retracement zone
Gann time-cycle observation
Potential Elliott Wave flat correction completing around September-end
Potential upside levels:
🎯 295
🎯 375
🎯 473
The idea is conditional — I would look for a suitable reversal/confirmation near the 210–222 zone rather than entering blin
Gann
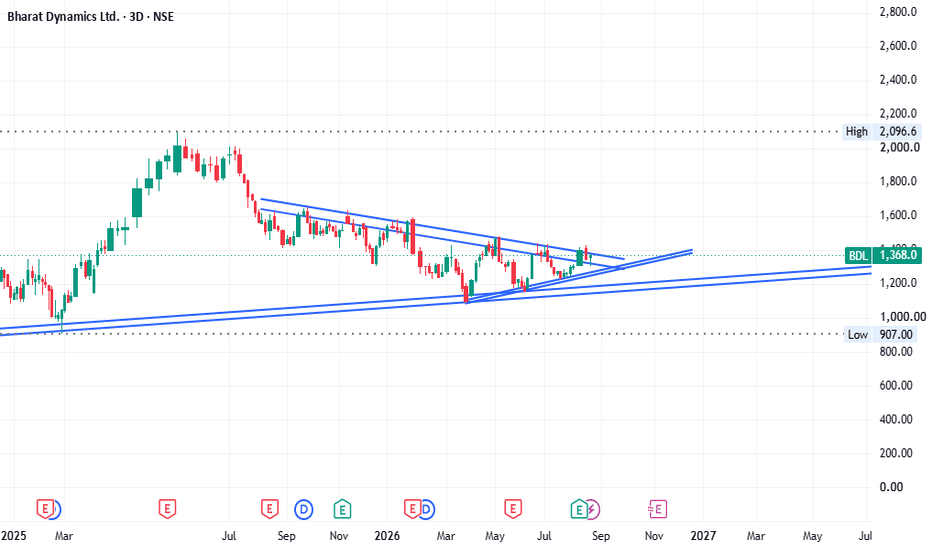
CMP: 1351 | Structure: Multi-month coil nearing resolutionWhat The Chart Is Telling Us
BDL has been building a classic compression pattern for the last 8-9 months. A descending trendline from the 2000 highs is sloping down, while an ascending trendline from the 1000-1100 lows is sloping up. Both are converging into an apex zone around 1300-1370 — and price is currently coiling right inside it.
This kind of price action — higher lows meeting lower highs — tells us that both supply and demand are exhausting themselves. Sellers who wanted out are largel
Option TradingIntraday trading involves buying and selling financial instruments within the same trading session, with all positions closed before the market ends. Traders aim to take advantage of short-term price fluctuations using fast decision-making and technical analysis. Intraday trading is highly active and often relies on chart patterns, volume analysis, momentum indicators, and market news to identify quick trading opportunities.
Trading Road Mapoptions trading and institutional trading are important parts of modern financial markets. Options trading offers flexibility and opportunities for profit, while institutional trading provides liquidity and stability to the market. However, beginners should learn market concepts carefully before entering options trading because losses can occur quickly without proper knowledge and risk management. Education, practice, and disciplined investing are essential for long-term success in trading.
Institution Option Trading Part-3PCR means Put Call Ratio
It tells us how many Put options and Call options people are buying or trading.
Why it matters for institution trading
Big players mostly use options. So PCR helps us understand what big money may be thinking.
If PCR is high
More puts than calls.
Means traders are scared or taking protection.
Sometimes big players expect weakness.
If PCR is low
More calls than puts.
Means confidence in upside.
Sometimes market is bullish.
BTC/USD Macro View: Multi-Year Support & Resistance BreakdownDescription:
Hello traders! Today, let's take a step back and look at the Bitcoin (BTC/USD) Weekly (1W) chart. Analyzing this macro timeframe helps us identify the critical historical support and resistance trendlines that are guiding Bitcoin's long-term price action.
Chart Breakdown:
1. Macro Dynamic Resistance (Red Trendline)
The red ascending upper trendline acts as a major historical resistance zone. It connects the previous major cycle tops. This is the crucial ceiling for the market; a pus
COLPAL - BULLISH - MOVING TOWARDS 2200+Company Name: Colgate-Palmolive (India) Limited
NSE Symbol: COLPAL
Sector: FMCG / Personal Care
Colpal as a stock is ready for a big move upwards from Monday 24th-Aug-2026 onwards. As per the technical analysis Colpal is at a major weekly support level and trend reversal can be seen from here. As per last 10 year analysis of Colpal, every year in Week 35 COLPAL has been 70% BULLISH. Expecting the same to be repeated this year as well from 24-Aug to 28-Aug.
In addition to the technical analysis
Institution Option Trading Part-2PCR (Put-Call Ratio) – Institutional Trading Strategy
What is PCR?
PCR = Put OI ÷ Call OI
It shows market sentiment of big players in indices like NIFTY 50.
Institutional Psychology
2. How Big Players Use PCR
Retail buys options randomly
Institutions control PCR zones to trap traders
👉 You follow PCR = You follow smart money
📈 PCR Levels (Game Changer)
3. Key Zones
PCR < 0.7 → Bearish sentiment (too many Calls) → ⚠️ Reversal possible
PCR 0.7 – 1 → Neutral zone
PCR > 1.2 → Bullish sentiment
Trading MasterclassPCR (Put-Call Ratio) – Institutional Trading Strategy
What is PCR?
PCR = Put OI ÷ Call OI
It shows market sentiment of big players in indices like NIFTY 50.
Institutional Psychology
2. How Big Players Use PCR
Retail buys options randomly
Institutions control PCR zones to trap traders
👉 You follow PCR = You follow smart money
📈 PCR Levels (Game Changer)
3. Key Zones
PCR < 0.7 → Bearish sentiment (too many Calls) → ⚠️ Reversal possible
PCR 0.7 – 1 → Neutral zone
PCR > 1.2 → Bullish sentiment
Institutional Trading MasterclassCore Structure of Institutional Option Trading
Institutions focus on 4 pillars:
A. Direction
Will market go up, down, sideways?
B. Volatility
Will movement increase or decrease?
C. Time Decay
How much premium melts daily?
D. Risk Exposure
How much capital at risk?
Rules to Become Consistent
Never trade without plan
Never increase size emotionally
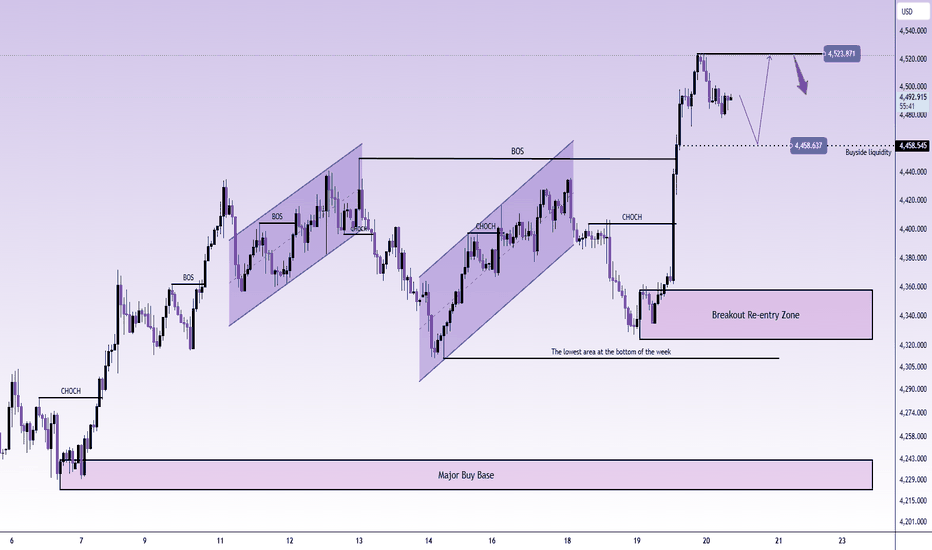
XAUUSD — 4,458 decides the next squeeze XAUUSD — 4,458 decides the next squeeze
Gold is finally sitting near the area where the move starts to feel heavy.
After the strong push from the breakout re-entry zone around 4,320 - 4,360, buyers managed to drive price straight into the 4,500 area and print a new short-term high near 4,528. That is strong momentum, no doubt. But the higher price goes, the more careful I become with late buys.
Right now, the chart is showing a simple SMC story.
The breakout above 4,458 confirmed that buyers
Option TradingIntraday trading involves buying and selling financial instruments within the same trading session, with all positions closed before the market ends. Traders aim to take advantage of short-term price fluctuations using fast decision-making and technical analysis. Intraday trading is highly active and often relies on chart patterns, volume analysis, momentum indicators, and market news to identify quick trading opportunities.
Intraday AnalysisOption Chain Analysis: Decoding Open Interest (OI) to find where the "Big Players" are positioned.
FII/DII Data: Understanding institutional activity and its impact on market direction.
Intraday Strategies: Scalping and swing setups using Price Action and key EMAs.
Global Market Cues: How GIFT Nifty and US Markets might influence our opening.
Option AnalysisOptions Data
PCR at 0.90, slightly bearish reading
Max call pain sitting near 55,000, acting as a ceiling
What to Do
Short traders hold with stop-loss above 54,609 on daily close
Long trades only if index closes above 54,609
Avoid aggressive buying unless 56,400 is reclaimed with a proper closing
Key Risk
Crude oil above 100 dollars is a pressure point for India
Any global news on geopolitics can cause sudden sharp moves either way
Oversold MarketsWhat is overbought?
When the market goes up too much, too fast — like it got overexcited. RSI crosses above 70. This means most people who wanted to buy have already bought. Not many buyers left. So the market will likely slow down or fall a bit.
What you do: don't buy now. If you're already in profit, book some of it. Keep your stop loss tight.
What is oversold?
When the market falls too much, too fast — like everyone panicked and sold everything. RSI drops below 30. Most of the panic sellin
Trading AnalysisWhere is Nifty right now?
Nifty closed at 23,689 on Thursday May 14. After a brutal fall earlier this week (it touched ~23,300), it bounced back for 2 days in a row. So right now it's in a recovery mood — but it hasn't really "fixed" itself yet. Think of it like someone who had a fever, now feeling slightly better, but not fully healthy.
2 What's the wall above? (Resistance)
If Nifty tries to go up next week, it will hit a wall around 23,500–23,600 first. That's the first test. If it somehow c
Intraday AnalysisOption Chain Analysis: Decoding Open Interest (OI) to find where the "Big Players" are positioned.
FII/DII Data: Understanding institutional activity and its impact on market direction.
Intraday Strategies: Scalping and swing setups using Price Action and key EMAs.
Global Market Cues: How GIFT Nifty and US Markets might influence our opening.
NIFTY till 25th August### NIFTY 50 Intraday Market Update | 15-Minute Chart
NIFTY 50 is currently trading around **24,231.85**, showing a mildly positive intraday bias. Price has recovered from the lower support zone and is now consolidating near the **24,200–24,250** area.
**Key Levels:**
* **Immediate Resistance:** 24,251.80
* **Breakout Zone:** Above 24,251.80
* **Target / Sell Zone:** 24,375.45 – 24,403.35
* **Immediate Support:** 24,197.80
* **Major Support / Buy Zone:** 24,074.15 – 24,024.30
### RSI Analysi
now gold downfall startedThe Psychology Behind This SELL Setup 📉
This trade is not about selling just because Gold reached resistance.
The idea is to sell into an area where price has already made an aggressive move upward and is now testing a major resistance zone around 4,520.
The psychology is simple:
After a strong rally, buyers become confident and late buyers start entering near the highs. That is exactly where liquidity builds.
If price fails to sustain above the resistance, those late buyers can become trap
Institutional Trading MasterclassCore Structure of Institutional Option Trading
Institutions focus on 4 pillars:
A. Direction
Will market go up, down, sideways?
B. Volatility
Will movement increase or decrease?
C. Time Decay
How much premium melts daily?
D. Risk Exposure
How much capital at risk?
Rules to Become Consistent
Never trade without plan
Trading MasterclassPCR (Put-Call Ratio) – Institutional Trading Strategy
What is PCR?
PCR = Put OI ÷ Call OI
It shows market sentiment of big players in indices like NIFTY 50.
Institutional Psychology
2. How Big Players Use PCR
Retail buys options randomly
Institutions control PCR zones to trap traders
👉 You follow PCR = You follow smart money
📈 PCR Levels (Game Changer)
3. Key Zones
PCR < 0.7 → Bearish sentiment (too many Calls) → ⚠️ Reversal possible
PCR 0.7 – 1 → Neutral zone
PCR > 1.2 → Bullish sentiment
Institutional Trading MasterclassCore Structure of Institutional Option Trading
Institutions focus on 4 pillars:
A. Direction
Will market go up, down, sideways?
B. Volatility
Will movement increase or decrease?
C. Time Decay
How much premium melts daily?
D. Risk Exposure
How much capital at risk?
Rules to Become Consistent
Never trade without plan
Never increase size emotionally