Gartley
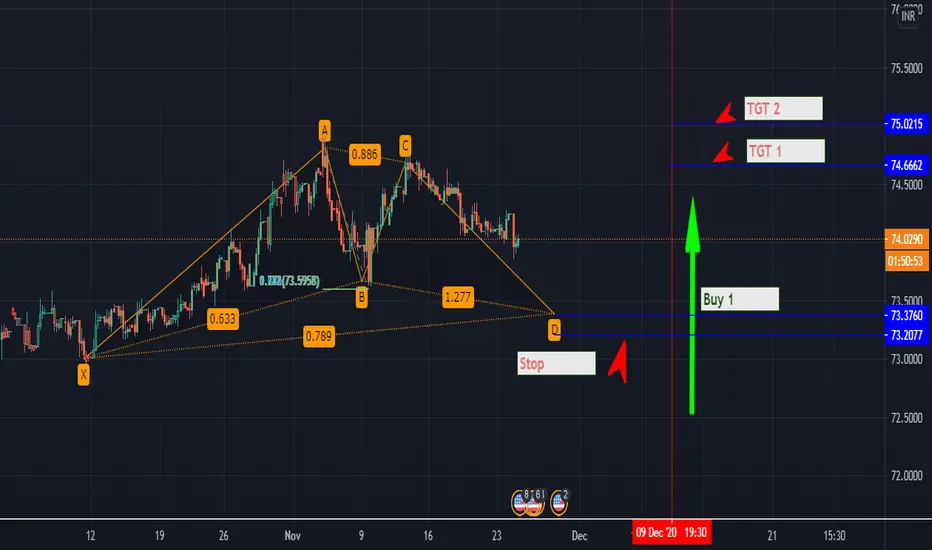
Apollo Hospital Multiple Trades, both Long and ShortPossible Gartley Formation:
1. Risky Traders: Can take Short Position @ CMP(2406) to 2427 and anytime below these levels as well:
A. Target : 2339/2340 (Which is a pivot point as well, further better target)
B. Stop Loss : 2430/2431
2. All Traders: Can Take a long position from 2339/2340:
A. Target 1 : 2383/2384, Target 2: (Will be updated later, once trade is ativated)
B. Stop Loss : 2323/2
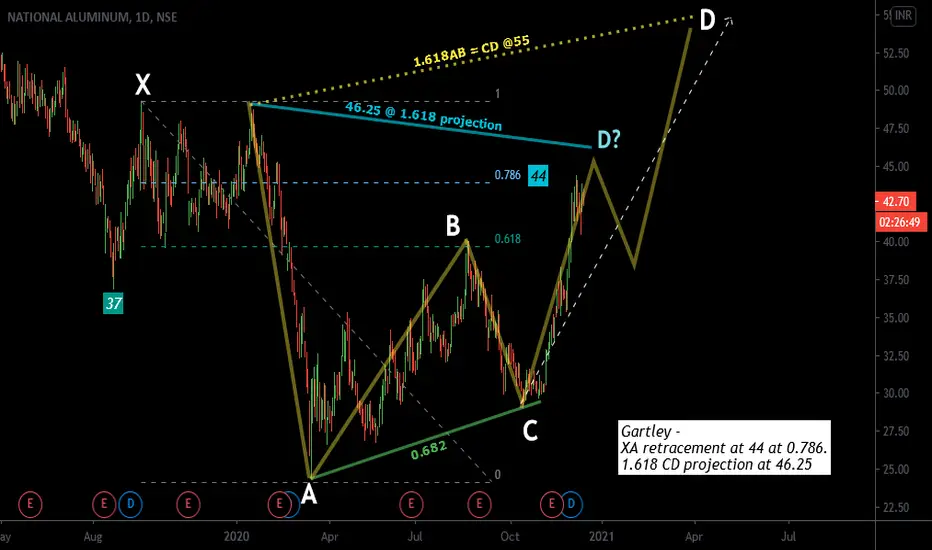
NATIONALUM, Harmonic Pattern & Fib. Ratio (Investors).Two important fibs ratio for Gartley -
XA retracement at 44 at 0.786.
1.618 CD projection at 46.25 .
=> 1.618AB = CD @55 ( investors )
The previous important level at 37 ( The price should not fall below it for long position)
Note: Investors should wait for pullback to enter.
=======================================================
Elliot Wave - Bottom is out? or new EW-Cycle.
Let's compare Elliot Wave of HINDALCO:
Longer & short TF - TimeCycle, NALCO.
Fundamental & Hindalc
UBL - VIEWBUY BASED ON (disclaimer - for study purpose only)
GARTLEY BEARISH PATTERN COMPLETION
BUY FOR TARGET 1245+, 1188 CAN BE IN BTW RESISTANCE
WITH STOP AS COMFORT
SUPPORTING FACTORS FOR BUY :->>>
***CONSISTENT VOLUME SUPPORT
***weekly oscillators neutral but strong buy support in daily frame
***weekly close above 200ma can give support
MCX Gold - Bullish Gartley + Piercing Pattern Candlestick-47550(Last - 49177 / 21:05 Hrs / 4th Dec2020)
Bullish Gartley + Piercing candlestick pattern (Bullish Candlestick) - suggest precious metal can start upside trend travel to 52500 (Target 1) & Strictly Above 52500 can travel to 56200+ (Target 2) - Stops below 47550
The piercing pattern is a two-day candle pattern that implies a potential reversal from a downward trend to an upward trend.
Three characteristics of this pattern include
1. Downward trend before the pattern,
2. Gap down after the fir
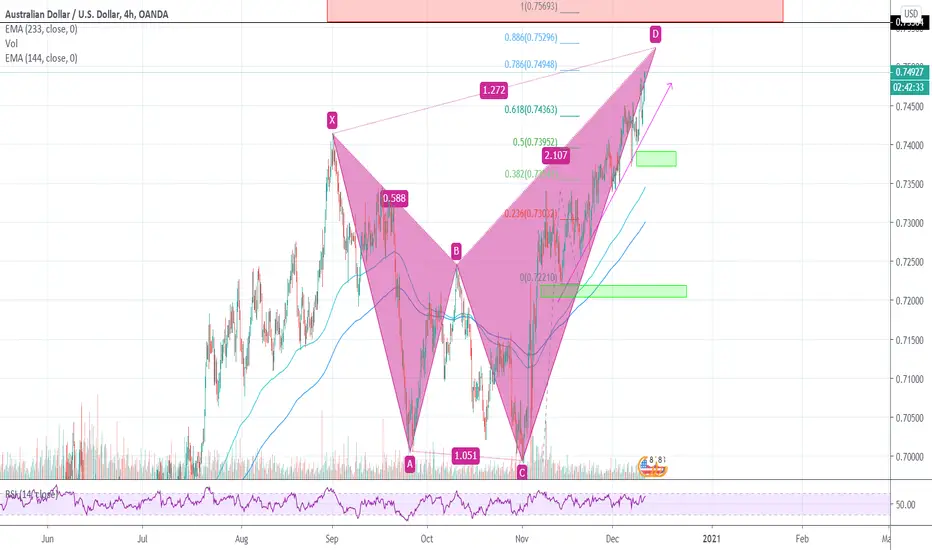
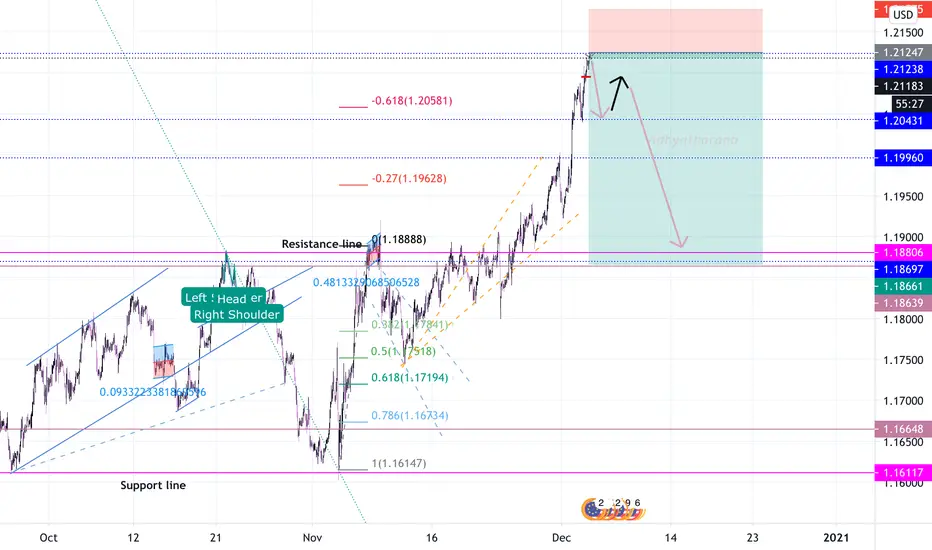
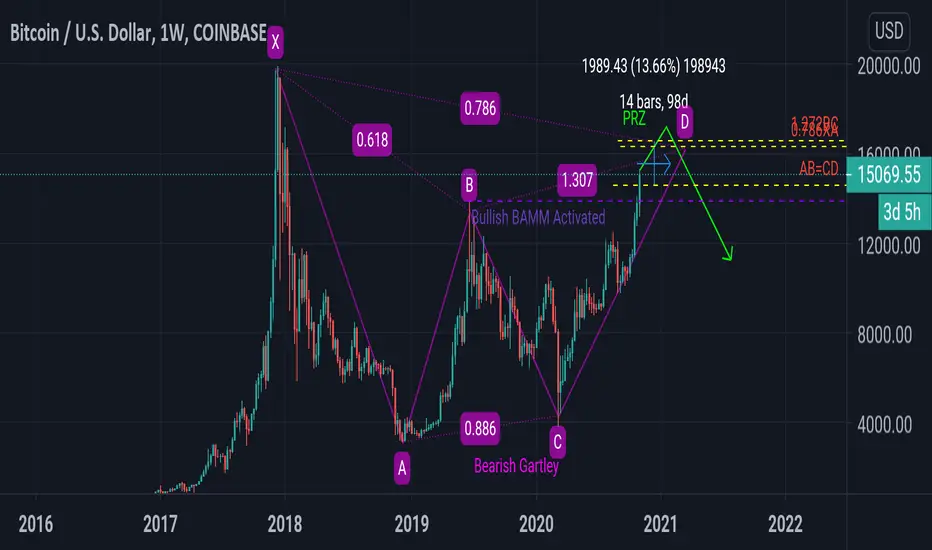
Bearish movementWe had a long side-away uptrends for past couple of week’s in EURUSD. There is no stopping out of biggest uptrends rally of EURUSD seems to be highest level of value,Since April 2018. According to our prediction and analysis the value of chart will goes downtrends and have a small wave up ⬆️ and starts to falls to the low high.
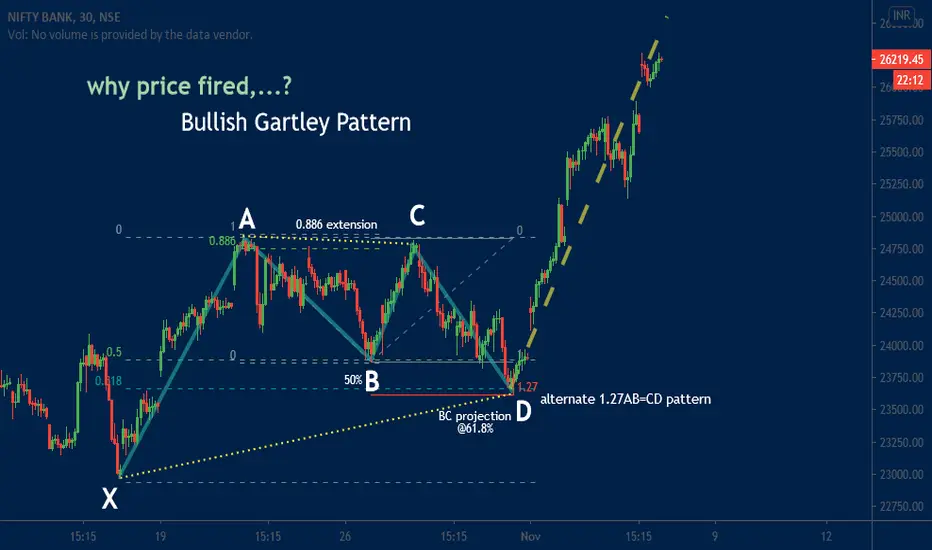
Question for Harmonic Trader & Why price fired? BANKNIFTYQuick reversals from Bat pattern PRZs are quite common.
The mid-point "B" at exactly 50% retracement.
Alternate 1.27AB=CD pattern.
BC projection @61.8%.
The price quickly reversal seen after "D".
Question of Harmonic Trader/Analyst is ,
Bat Or Gartley?
Why did birth to this question?
- The Gartley Pattern required point "B "50% and 1.27AB=CD pattern required. In essence, One of the most important numbers in the pattern is the completion of point D at the 0.786 of XA.
- Th
Harmonic Analysis Vs. US Election - How could affect of wining?Source Code of How U.S. Election could affect of EUR/USD pair.
If ( Biden = wins ) {
More buying interest may push the price > 1.20000 after slightly lower.
.
If ( Trump = wins ) {
Sellers will keep selling respectively & US dollar will strong , causing Gartely force to the price to slide up to 0.786 at 1.13465
}
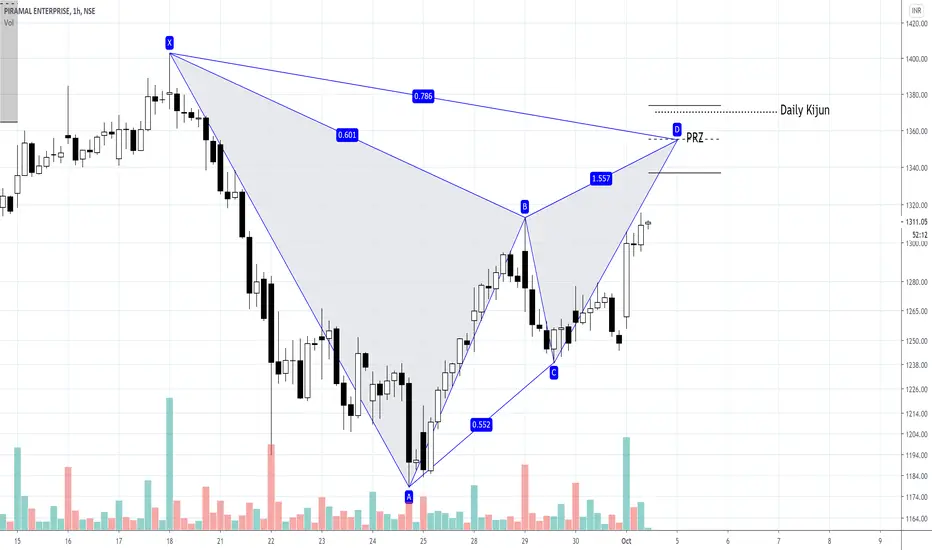
PEL - Hourly Chart - Bearish GartleyPEL seen forming bearish Gartley around with PRX around 1360 levels. The pattern is still in formation.
Wait for a strong reversal candle in PRZ before entering. I'll prefer a high volume candle for confirmation.
Do not hurry to enter, wait for confirmation.
Views only for educational purposes, and not a trading advise. Assess your risk and enter any financial positions. Always keep stop loss.
PShort