BULLISH GARTLEY ( POSITIONAL TRADE SETUP ON ABAN. DAILY CHART)Hi
A Bullish Gartley pattern is developing on Aban -0.47% Offshore Daily Charts .
Potential Price reversal zone will be
1.13BC = 211.5
0.786XA= 206
The PRZ zone is only a guideline of where we will be paying attention for trade setups and opportunity's.
Note : Daily Trend line shown as red color.
Stop loss would be placed below X leg structure support .
Target 1 - 229
Target 2 - 243
To protect the profits you have accumulated at target 1 it is advised you move your stop loss to breakeven once the 38.20% target 1 has been attained, thus giving you a risk free trade to target 2.
Trade with Care,
Gulz.
Gartley
Bearish Gartley - ACC (60 Mins)Hello Traders,
We have spotted a bearish Gartley pattern on ACC hourly chart. Price is near PRZ. Once it enters the PRZ, one can use their own set of rules for entry. I look for candle stick formation and OB/OS signal on oscillators for entries. Profit levels and SL are mentioned on chart.
Thank you.
Happy Trading!!!
Bearish Harmonic - SUNPHARMA (Daily)Hello Traders,
We have observed bearish Garltey pattern on Sun Pharmaceutical Ltd daily chart. We expect price to resist in PRZ and reverse. Here, PRZ is made of AB=CD, 0.786XA, 1.27AB, and 1.27BC Fibonacci ratio confluence. This potential trade setup has a risk/reward ratio of 1:1.1 for target-1 and 1:1.8 target-2.
Happy Trading!!!
Swing Trade Opportunity -Adani Power - Bearish Gartley at MarketHello Traders,
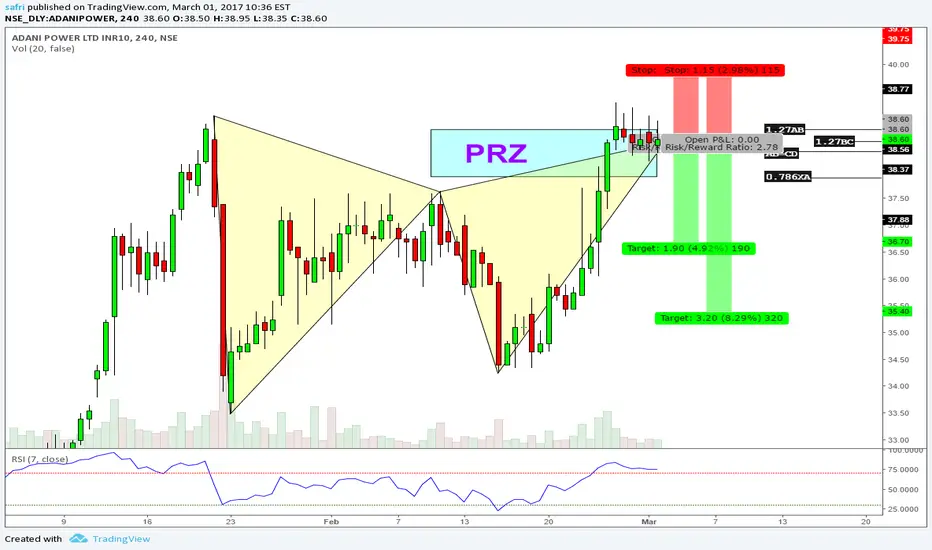
I have spotted Bearish Gartley Pattern on Adani Power. Price is already in PRZ and one can enter into trade at CMP. Here, PRZ is made of 1.27AB, 1.27BC, AB=CD, O.786XA Fibonacci ratio confluence. This trade set-up has a risk/reward ratio of 1:1.5 for Target-1 and 1:2.6 for Target-2.
Happy Trading!!!
Bat , Gartley Pattern - Educational Series 2Hi All,
Continue with Patterns :
Bat Pattern : XABCD are the point to be considered with following ratios
AB (fall) = 0.38 or 0.5 times XA (rise)
BC (rise) = 0.382 or 0.886 times AB (fall)
CD (fall) = 1.618 or 2.618 times BC (rise)
Interest point would be point D after completion of pattern as potential reversal zone (PRZ) , looking for buying opportunities after confirmation.
C can be consider as interest point in anticipation of BAT pattern formation after confirmation.
Gartley Pattern : XABCD are the point to be considered with ratios as shown in diagram
Difference in Gartley pattern and bat pattern is fall of Leg AB and fall of leg CD as shown in figure in blue color
D and C Points remain interest points for trade.
Bullish Harmonic - AUROBINO PHARMA (Daily)Hello Traders,
I have observed Bullish Gartley Pattern on AUROBINDO PHARMA. It look price soon will enter Potential Reversal Zone (PRZ). Here, PRZ is made of 0.786XA, AB=CD and 1.27AB Fibonacci ratio confluence. This potential trade has a risk/reward ratio of 1:1.2 for Target-1 and 1:2 for Target-2.
Follow this idea for further updates.
Happy Trading!
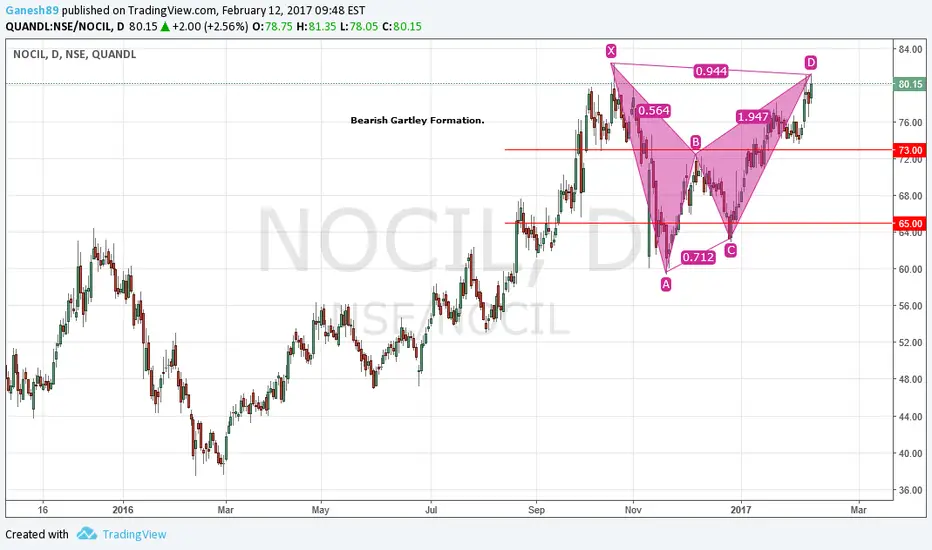
Bearish GartleyIn NOCIL a bearish gartley is formed i feel that it may drop to 73 rs if it break the 73 level then it will go to level of 65 rs.
NShort
Gartley on ABGSHIPGartley Pattern is about to complete on ABGSHIP. PRZ comes right in the previous support. Looks like a nice long trade opportunity.
ALong
Dabur - Bearish Gartley Pattern It is been observed on a daily chart that the price action forms a bearish harmonic pattern known as Bearish Garltey pattern where the D leg is near to 88.6 retracement levels of XA leg and also 1.618 Fibs extension of AB leg.
Now it shall retace back to 38.2% levels of AD leg at around 290 levels.
Target: 290
Stoploss: 305
Educational 06: Gartley Pattern It is the second most important trading pattern in Harmonic Pattern series , called Gartley Pattern which is also frequently observed in markets. This post a second post of educational series related to Harmonic Patterns,
In this post, I cover the following things regarding the pattern
1. Pattern Traits
2. Step by Step formation of the Pattern
3. Bullish Gartley Pattern measurements, labelling and targets
4. Bearish Gartley Pattern measurements, labelling and targets
5. Look of the pattern
Further to come in this Harmonic Pattern series , where I shall be discussing about the below patterns:
1. AB=CD Pattern (Completed) ----> Link below
2. Gartley Pattern (Present)
3. Cypher Pattern >>>>> Next
4. Bat Pattern (Coming up)
5. Butterfly Pattern (Coming up)
The best part of the above mentioned patterns that they can be used in all markets and at any time frame. It means you can use the patterns in stock markets, Forex , Commodities and at any time frame like hourly, daily, weekly etc. Therefore, they are important tools when analyzing the charts.
Purpose: To provide information to traders community that can help individual trader to learn more and take inform decisions while trading in order to generate consistent positive results.
Practice the above said chart pattern and share it below with us.
Thanks for the support,
Best Regards,
Neetesh Jain
IPCALAB Bearish Gartley Pattern SetupPreviously on daily chart, it is been observed that the price action is ranging in a uptrending channel. Today, on hourly chart, there is formation of Bearish Gartley pattern has been observed which indicates selling pressure at 630 levels, where Bearish Pin-bar pattern is also observed. There is also a MACD crossover that to be noticed too. The above said factors indicating bearishness in the chart and It shall further move down.
Target 1: 603
Stoploss: 625