Short
Short
 Short
Short
 Long
Long
 Long
Long
 Long
Long
 Short
Short
NYKAA Stock: Short Selling with Time frameNYKAA Short Selling Recommendation
Introduction:
This report aims to provide a technical analysis of the NYKAA stock and a recommendation for short selling the stock in the short term, with time frame of 30th Jan 2023. The analysis is based on the latest charts and indicators and is intended for investors and traders who are looking to capitalize on market movements.
Background:
NYKAA is an Indian e-commerce company that sells beauty and personal care products. The company's stock is listed on the National Stock Exchange of India (NSE) and is widely followed by investors and traders.
Analysis:
The NYKAA stock has been in a downtrend for the past few months, but recent price action suggests that the stock may be reaching a support level. The stock has been trading around 133.75 levels, and a breakdown below this level could signal a short-term trend reversal.
The technical indicators are also pointing to a potential short selling opportunity. The Relative Strength Index (RSI) has been trending lower, and is currently at overbought levels, indicating that the market is overbought and may be due for a pullback. Additionally, the Moving Average Convergence Divergence (MACD) histogram has crossed below the zero line, suggesting that the trend is losing momentum.
Furthermore, price action on the chart shows that the stock has reached a support level and is showing signs of a potential reversal with bearish cand formation.
Recommendation:
Based on the analysis above, we recommend short selling the NYKAA stock if it breaks down 133.75 levels, with a stop loss of 136.95. This strategy aims to capitalize on a short-term trend reversal and capture potential profits as the market pulls back. The target 1 is 130.55 and target 2 is 128.50 with time frame of 30th Jan 2023.
Disclaimer:
It's essential to keep in mind that the market is highly volatile and unpredictable. Therefore, it's recommended to keep a close eye on the price action, and use stop loss and take-profit levels to minimize risk and maximize returns. It's important to conduct your own research and analysis before making any investment decisions and always consult a financial advisor before taking any action.
Conclusion:
In conclusion, the NYKAA stock appears to be reaching a support level, and technical indicators suggest a potential short-term trend reversal. Therefore, short selling the NYKAA stock if it breaks down 133.75 levels with a stop loss of 136.95 and target 1 of 130.55 and target 2 of 128.50 with time frame of 30th Jan 2023 is a recommended strategy for traders and investors looking to capitalize on market movements in the short term.  Short
Short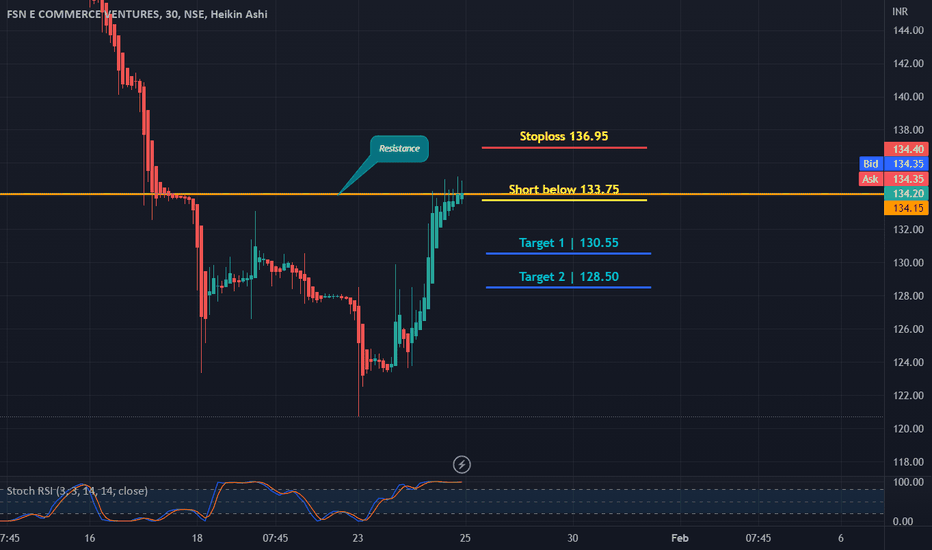
 Long
Long
 Long
Long
 Short
Short
 Long
Long
 Long
Long
Long 
 Long
Long
 Short
Short
 Short
Short
 Short
Short
 Long
Long